Matrix plots of reordered bistochastized transaction flow tables: A United States intercounty migration example
We present a number of variously rearranged matrix plots of the $3, 107 \times 3, 107$ 1995-2000 (asymmetric) intercounty migration table for the United States, principally in its bistochasticized form (all 3,107 row and column sums iteratively propo…
Authors: Paul B. Slater
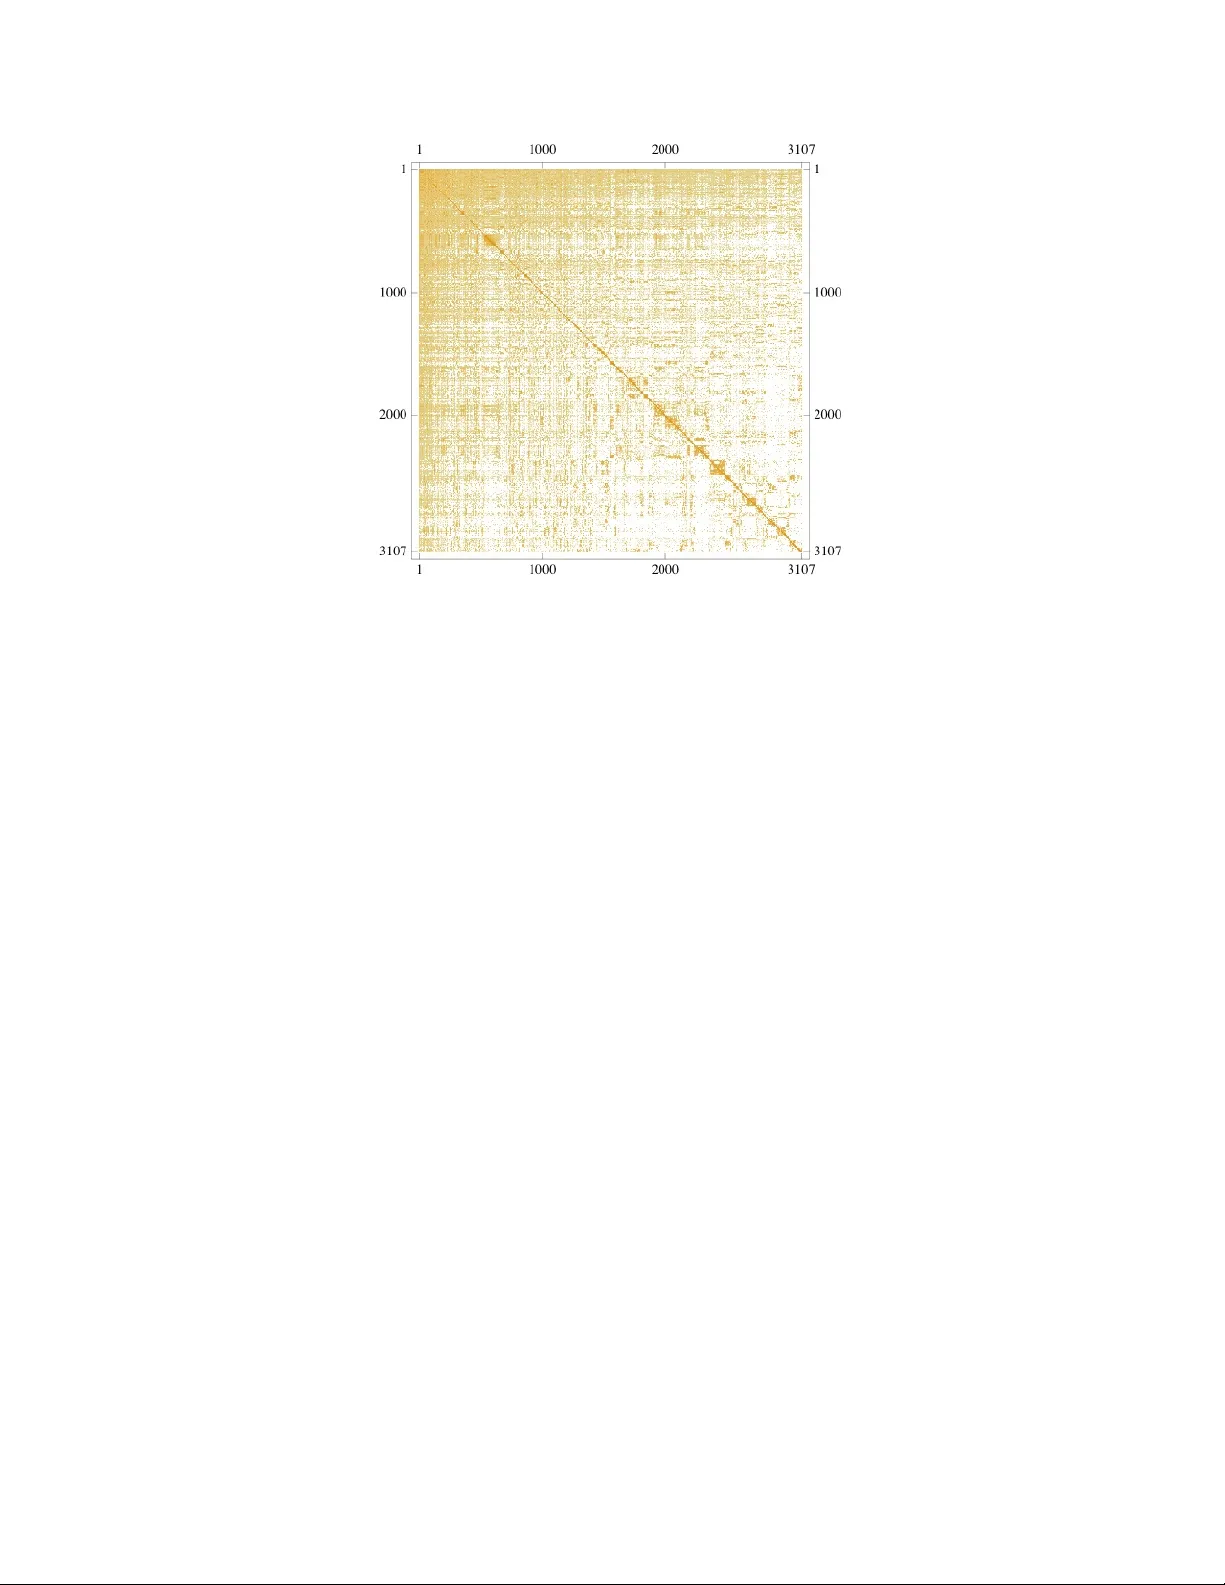
Matrix plots of reordered bisto c hastized transaction flo w tables: A United States in tercoun t y migration example P aul B. Slater ∗ ISBER, University of California, Santa Barb ar a, CA 93106 (Dated: Octob er 24, 2018) Abstract W e presen t a num ber of v ariously rearranged matrix plots of the 3 , 107 × 3 , 107 1995-2000 (asym- metric) in tercount y migration table for the United States, principally in its bisto c hasticized form (all 3,107 ro w and column sums iteratively prop ortionally fitted to equal 1). In one set of plots, the coun ties are seriated on the bases of the sub dominan t (left and righ t) eigen vectors of the bis- to c hastic matrix. In another set, we use the ordering of coun ties in the dendrogram generated b y the asso ciated strong comp onen t hierarchical clustering. Interesting, diverse features of U. S. in tercount y migration emerge–such as a con trast in cen tralized, hub-lik e (cosmop olitan/pro vincial) prop erties b et ween cosmop olitan “Sunbelt” and pro vincial “Black Belt” coun ties. The methodolo- gies emplo yed should also b e insigh tful for the many other diverse forms of interesting transaction flo w-type data–in terjournal citations b eing an ob vious, m uch-studied example, where one might exp ect that the journals Scienc e , Natur e and PNAS w ould display ”cosmopolitan” characteristics. P ACS n umbers: V alid P ACS 02.10.Ox, 02.10.Yn, 89.65.-s ∗ Electronic address: slater@kitp.ucsb.edu 1 I. INTR ODUCTION Based upon the 2000 United States Decennial Census, one can construct a square (origin- destination) matrix of 1995-2000 migration flo ws ( m ij ) betw een 3,107 coun ty-lev el units of the nation. In Fig. 1, we show a matrix plot of this (raw data) table. (In the absence of any further relev ant information, we set to zero the diagonal en tries–which conceptually migh t corresp ond either to the n umber of people who actually mo ved within the count y or who simply stay ed within it.) In the principal, admininstrative sorting of the rows/columns of the table, the fifty states are ordered alphab etically , while, secondarily , within the states, their constituen t counties are ordered also alphab etically . W e immediately discern a clear clustering along the diagonal in Fig. 1, indicativ e of the ob vious prop osition that migrants ha ve a pro clivit y to mo ve in trastate-wise, b oth for simple distance and state loy alt y/ties/allegiance considerations. Ho w ev er, the alphab etical ordering b y states is certainly highly fortuitous in c haracter, and we observ e relativ ely hea vy migration far remov ed from the diagonal (say for the ph ysically con tiguous, but alphab etically non- pro ximate pairs [California, Oregon] and [T exas, Lousiana].) (Historically , the design and la yout of coun ties differs considerably–somewhat unfortunately from a geographic-theoretic p oin t of view–betw een states, and w e note that T exas has the most counties, 254, and app ears as a large square far do wn the diagonal in Fig. 1, while the state of Georgia, with the second most coun ties, 159, is also apparen t near the upp er left corner.) Additionally , counties v ary widely in p opulation sizes. T o con trol for this (marginal) effect, one ma y biproportionally/iteratively adjust the ro w and column sums so that they all conv erge to b e equal (sa y to 1). In Fig. 2, w e sho w the 3 , 107 × 3 , 107 in tercoun ty migration table after such a double-standardization (bisto c hastization). Clearly , the un- derlying definition/delimitation of blocks has b een heightened b y this transformation. The purp ose of the scaling is to remov e ov erall effects of size (whic h certainly ma y be of interest in themselv es), and fo cus on relative, interaction effects. Nev ertheless, the cr oss-pr o duct r atios ( r elative o dds ), m ij m kl m il m kj , measures of asso ciation, are left invariant . Additionally , the en tries of the doubly-sto c hastic table provide maximum entr opy estimates of the original flo ws, giv en the constraints on the row and column sums [1, 2]. Let us also mak e the general observ ations that p o w ers of bistochastic matrices are also bistochastic, and that ph ysicists ha ve b een in terested in dev eloping conditions that indicate when a bistochastic matrix is 2 also unisto chastic [3, 4, 5, 6]. (These latter properties might b e of v alue in the mo deling of transaction flo ws.) An efficient algorithm–considered as a nonlinear dynamical system–to generate r andom bisto chastic matrices has recently b een presented [7] (cf. [3, 8]). The dominant left and right eigen vectors (corresp onding to the eigen v alue 1) of the doubly-standardized table are simply uniform vectors. The sub dominan t (left and righ t) eigen vectors (corresp onding to a r e al eigen v alue of 0.906253) are of interest [9]. (The cor- relation betw een these t w o eigen vector s is high, 0.971197. The third largest eigenv alue is real also, 0.868784, while the fourth is sligh tly complex in nature, 0 . 84562 + 0 . 000906373 i . The v ector of 3,107 eigenv alues has length 12.6472.) W e r e or der or seriate Fig. 2 on the basis of the left (in-migration) eigen vector and obtain Fig. 3, and on the basis of the righ t (out-migration) eigen vector and obtain Fig. 4. No w we see diminished clustering far from the diagonal. F urther, b oth of these figures suggest the division of the nation in to basically t wo large clusters. F urther, reordering on the basis of the (38-page-long, 3,107-coun ty) dendrogram ([10, Supplemen t]) generated by the strong component hierarc hical clustering (the directed-graph analogue of the single-link age metho d) [11, 12, 13, 14, 15, 16, 17, 18, 19, 20] of the bistochas- tized table, w e obtain Fig. 5. The correlation betw een the ordering used in this table and the admininstrativ e ordering used in Figs. is 0.0373522, and the orderings used in Figs. 3 and 4, resp ectiv ely , ev en low er, 0.00401504 and 0.0099957 (T able I). (The corresp onding correla- tions b et ween the administrative ordering and that employ ed in Figs. 3 and 4 are 0.0579257 and 0.0755089. Correlations greater in absolute v alue than 0.0353074 are significant at the 95% lev el, 0.0400655 at the 97 . 5% lev el, and 0.0458262 at the 99% lev el.) The dominan t feature of Fig. 5 is that the coun ties no w listed at the b eginning in the reordering–and, in general, the last to b e absorbed in the agglomerativ e clustering pro cess– are “cosmopolitan” or “h ub-like”. They tend to receive and send migrants across the nation, while those nearer to the end in the reordering tend to b e more pro vincial or limited in their breadth of interactions [13]. (A prototypical example of a hub-lik e in ternal migration area is P aris [13, 21]. In analytically parallel studies of interjournal citations [14, 22, 23], one migh t an ticipate that the broad journals, Scienc e , Natur e and the Pr o c e e dings of the National A c ademy of Scienc es migh t fulfill analogous roles.) The ultrametric fit to this reordered bisto c hastized table pro vided b y the strong compo- nen t hierarchical clustering [11, 12, 13, 14, 15, 16, 17, 18, 19, 20] is giv en in Fig. 6, and the 3 1 & 2 3 4 5 8 9 1 & 2 1. 0.0579257 0.0755089 0.0373522 -0.00868334 -0.0788444 3 0.0579257 1. 0.140583 0.00401504 0.00759781 -0.0202812 4 0.0755089 0.140583 1. 0.0099957 0.00207526 -0.000659818 5 0.0373522 0.00401504 0.0099957 1. 0.0551071 0.0206225 8 -0.00868334 0.00759781 0.00207526 0.0551071 1. 0.0467724 9 -0.0788444 -0.0202812 -0.000659818 0.0206225 0.0467724 1. T ABLE I: Correlations betw een the orderings of coun ties used in the sev eral n um b ered corresp ond- ing figures. Correlations greater than 0.0676788 in absolute v alue are significan t at the 99 . 99% lev el, those greater than 0.0458262 at the 99% level, and 0.0353074 at the 95% significance lev el. residuals (predominan tly negativ e) from the fit in Fig. 7. (These latter tw o figures, b oth in their own w ays, further reflect this cosmop olitan-pro vincial dic hotomy betw een the U. S. coun ties.) In Fig. 8 we display the bisto c hastic form of the 1995-2000 U. S. in tercoun ty migration table no w reordered on the basis of the hierarc hical clustering generated by appli- cation of the DirectAgglomerate command of Mathematica. (W e inputted our asymmetric v alues–con v erted to dissimilarity measures–ev en though the command assumes a symmetric input. W e also applied the same command to the tr ansp ose of the dissimilarity matrix, and obtained somewhat differing results [Fig. 9].) The correlation b etw een the orderings in Fig. 8 and Fig. 9 is 0.0467724, and that of the ordering in Fig. 5 with those in Figs. 8 and 9, 0.0551071 and 0.0206225, resp ectiv ely . (With the administrativ e ordering used in Figs. 1 and 2, the correlations with Figs. 8 and 9 are negativ e, -0.00868334 and [negatively significan t] -0.078844, resp ectiv ely .) Previously [17, 24], w e ha ve studied (without the aid of more recen tly-developed matrix plots) bisto c hastized forms of the 1965-70 U. S. in tercount y migration table with strong comp onen t hierarc hical clustering [11, 12, 13, 14, 15, 16, 17, 18, 19, 20], b oth with zero and non-zero (corresponding to in tracoun t y mo vemen ts) diagonal en tries. Coun ties with large ph ysical areas tend to absorb more of their own migran ts, and th us exhibit larger diagonal bisto c hasticized entries and smaller off-diagonal en tries, making them link at w eak er lev els in the dendrogram generated. Journals with high self-citations would be exp ected to b eha v e analogously in journal citation-matrix analyses [14, 22, 25]. In the application of our t w o- 4 FIG. 1: Unadjusted 1995-2000 in tercount y U. S. migration table. The large square near the end–for alphab etical reasons–of the diagonal corresp onds to the state with the most (254) counties, T exas, while Georgia, with 159 counties, is located near the b eginning. Coun t y 1000 is Boyd Count y , Ken tucky and 2000, Dunn Coun ty , North Dak ota. stage bisto chastization and strong comp onen t hierarchical clustering pro cedure to the 1967- 75 interjournal citations b et w een tw en t y-tw o mathematical journals, the Pr o c e e dings of the A meric an Mathematic al So ciety w as found to function in a particularly broad, cosmop olitan manner [14]. 5 FIG. 2: Doubly-sto c hastic form of the 1995-2000 in tercount y U. S. migration table Ac kno wledgments I w ould like to express appreciation to the Ka vli Institute for Theoretical Ph ysics (KITP) for tec hnical supp ort. [1] J. Eriksson, Math. Program. 18 , 146 (1980). [2] S. M. Macgill, Environ. Plann. A 9 , 687 (1977). [3] K. ˙ Zyczk owski, M. Ku ´ s, W. S lomczy ´ nski, and H.-J. Sommers, J. Phys. A 36 , 3425 (2003). [4] I. Bengtsson, ˙ A. Ericsson, M. K ´ us, W. T adej, and K. ˙ Zyczk owski, Comm un. Math. Phys. 259 , 307 (2005). [5] P . Dit ¸ ˘ a, J. Math. Ph ys. 47 , 083510 (2006). [6] J. D. Louck, F ound. Ph ys. 27 , 1085 (1997). 6 FIG. 3: Doubly-sto chastic matrix (Fig. 2) reordered on the basis of its subdominant left eigenv ector. The first 72 coun ties in the ordering are al l from Georgia (mostly lying in a [“Upper Coastal Plain”] band from the south west corner of the state [Seminole Count y] to its north central b oundary [F ranklin, Hart, Elb ert and Lincoln Counties]), and the last 110, all from the Great Plains states of North Dak ota (45), South Dakota (50) and (north central) Nebrask a (15). Coun ty 1000 is Bucks Coun ty , Pennsylv ania and 2000, Lubb o c k Count y , T exas. [7] V. Capp ellini, H.-J. Sommers, W. Bruzda, and K. ˙ Zyczk owski, Nonline ar dynamics in c on- structing r andom bisto chastic matric es , [8] R. C. Griffiths, Canad. J. Math. 26 , 600 (1974). [9] M. Meila and W. P entney , in Pr o c. Natl. Conf. Artificial Intel ligenc e (2005). [10] P . B. Slater, Hubs and clusters in the evolving U. S. inter c ounty migr ation network , [11] P . B. Slater, Regional Stud. 10 , 123 (1976). 7 FIG. 4: Doubly-sto c hastic matrix (Fig. 2) reordered on the basis of its sub dominan t right eigen- v ector. The first 74 coun ties in the ordering are all from Georgia, and the last 181, all from North Dak ota, South Dak ota, Nebrask a and Minnesota. Count y 1000 is W ashington Coun t y , Louisiana and 2000, Adair Coun ty , Oklahoma. [12] P . B. Slater, T r e e r epr esentations of internal migr ation flows and r elate d topics (Communit y and Organization Res. Inst., Santa Barbara, 1984). [13] P . B. Slater, IEEE Syst. Man. Cyb. 6 , 321 (1976). [14] P . B. Slater, Scientometrics 5 , 55 (1983). [15] P . B. Slater, Environ. Plann. A 16 , 545 (1984). [16] P . B. Slater, Rev. Public Data Use 4 , 32 (1976). [17] P . B. Slater, Quality and Quantit y 15 , 179 (1981). [18] R. E. T arjan, Info. Proc. Lett. 14 , 26 (1982). [19] R. E. T arjan, Info. Proc. Lett. 17 , 37 (1983). 8 FIG. 5: Doubly-stochastic matrix (Fig. 2) reordered on the basis of its strong comp onen t hier- arc hical clustering. The first tw elv e (“cosmop olitan”) counties in the seriation are all from the “Sun b elt” states of Florida (5 counties, a well-defined cluster of four of them b eing equiv alen t to the T ampa-St. Petersburg-Clearw ater Metrop olitan Statistical Area), Arizona (2), (southern) California (3), Nev ada (Las V egas) (1) and T exas (Dallas) (1). The last 35 (“pro vincial”) ones–lie principally in the “Black Belt”, stretching through the Deep South states of Mississippi (5), Al- abama (24), Georgia (4) and (P anhandle) Florida (2). Count y 1000 is Carroll Coun t y , Indiana and 2000, W arren Coun t y , New Jersey . [20] K. Oza wa, P att. Recog. 16 , 201 (1983). [21] P . B. Slater and H. L. M. Winc hester, IEEE Syst. Man. Cyb. 8 , 635 (1978). [22] M. Rosv all and C. T. Bergstrom, Pro c. Natl. Acad. Sci. 105 , 1118 (2008). [23] J. Bollen, H. Somp el, A. Hagb erg, L. Bettancourt, R. Chute, and L. Balakirev a, PLoS One 4 , e4803 (2009). [24] P . B. Slater, Migr ation r e gions of the Unite d States: two c ounty-level 1965-70 analyses (Com- m unity and Organization Res. Inst., Santa Barbara, 1983). [25] L. Leydesdorff, Scientometrics 60 , 159 (2004). 9 FIG. 6: Ultrametric (strong comp onent hierarchical clustering) fit to the doubly-stochastic matrix Fig. 5. The fits tend to b e higher in the lo wer right-hand corner, corresp onding to the more “pro vincial” (including “Blac k Belt”) coun ties. FIG. 7: Residuals (predominan tly negative) of the ultrametric fit (Fig. 6) to the doubly- sto c hastic matrix (Fig. 5). The residuals are most negative in the lo w er righ t-hand corner, where the fits pro vided b y the strong comp onen t hierarchical clustering were highest. 10 FIG. 8: Doubly-stochastic matrix (Fig. 2) reordered using the hierarchical clustering generated b y the DirectAgglomerate command of Mathematica–the only option in the Mathematica hierar- c hical clustering pack age that seemed computationally feasible. The first thirteen counties in the reordering are from Florida (10), Ha waii (1–Kalaw ao, the smallest U. S. count y) and T exas (2), while the last t wen t y-one are from Alabama (6), Georgia (10) and Florida (5). Coun t y 1000 is Rusk Count y , Wisconsin and 2000, Knott Count y , Ken tuc ky . 11 FIG. 9: Doubly-stochastic matrix (Fig. 2) reordered using the hierarchical clustering generated b y the DirectAgglomerate command of Mathematica applied to the tr ansp ose . The fiv e counties of Ha waii are clustered near the b eginning. The last thirt y-sev en coun ties belong to either Alabama or Mississippi. Count y 1000 is Sciotto Count y , Ohio and 2000, P olk Count y , Nebrask a. 12
Original Paper
Loading high-quality paper...
Comments & Academic Discussion
Loading comments...
Leave a Comment