Inference and Characterization of Multi-Attribute Networks with Application to Computational Biology
Our work is motivated by and illustrated with application of association networks in computational biology, specifically in the context of gene/protein regulatory networks. Association networks represent systems of interacting elements, where a link …
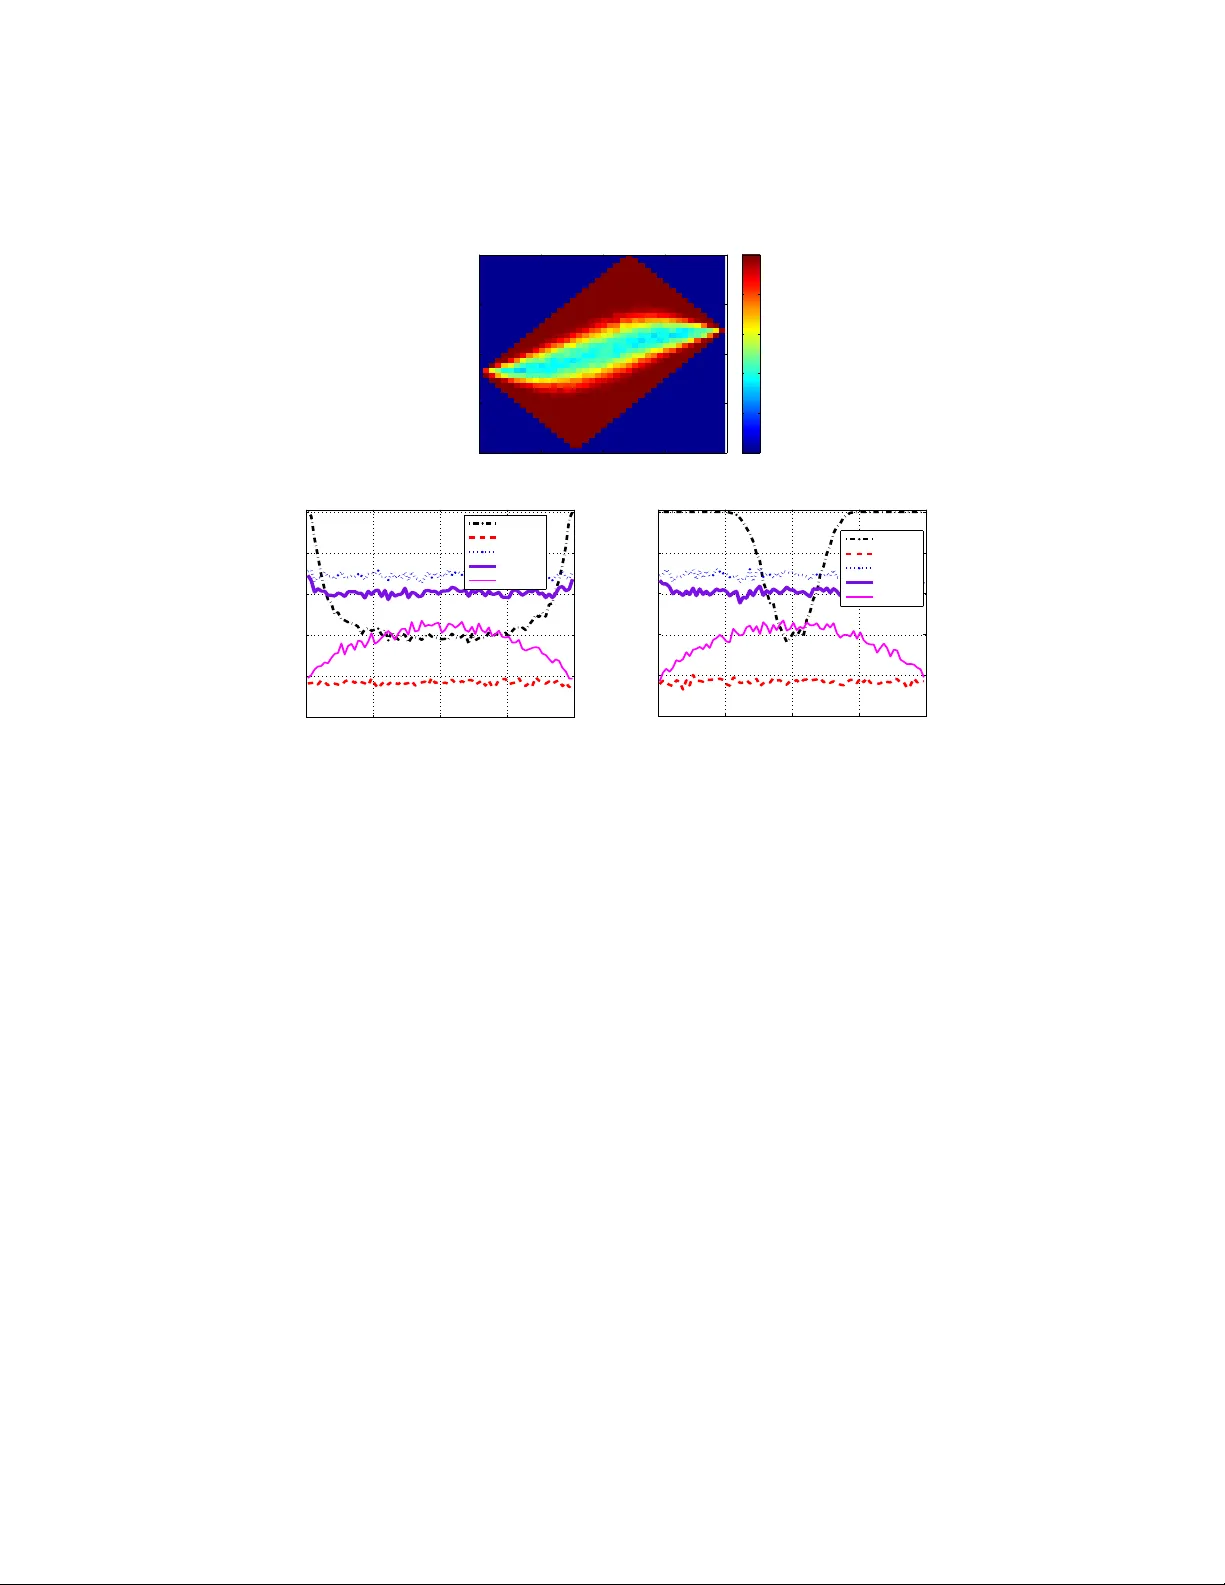
Authors: Natallia Katenka, Eric D. Kolaczyk
Submitted to the Annals of Applied Statistics INFERENC E AND CHARA CTERIZA TION OF MUL TI-A TTRIBUTE NETWORKS WITH AP PLICA TION TO COMPUT A TIONAL BIOLOGY ∗ B Y N A T A L L I A K A T E N K A A N D E R I C D . K O L AC Z Y K Boston Univer sity Our work is moti v ated by and illustrated with application of association networks in co mputational biology , specifically in the c ontext of gene/protein regulatory networks. Association networks represe nt systems of i nteracting elements, where a link between two different elements indicates a suf ficient lev el of similarity between element attributes. W hile in reality relational ties between elements can b e expected to be based on similarity across multi- ple att ributes, the vast majority of work t o date on association netw orks in- volv es ties defined with respect to only a single attribute. W e propose an approach for the inference of multi-attribute assoc iation netwo rks fr om mea- surements on continuous attribute variab les, using canonical correlation and a h ypothesis-testing s trategy . Within this context, we then study the impac t of partial informa tion on multi-attr ibute netwo rk inference and characterization, when on ly a subset of a ttributes is av ailable. W e consider in detail the case of two attributes, wherein we examine through a combination of analytical and numerical techniques the implications of the choice and number of node at- tributes on the ability to detec t network link s and, mo re generally , to estimate higher-le vel network summary statistics, such as node degree, clustering co- efficien ts, and measures of centrality . Illustration a nd app lications through out the paper are de veloped using gene and protein expression measurements on human cancer cell lines from the NCI-60 database. 1. Intr oduction. Network s ha ve been used for mathematical representat ion of systems of interacting elements in th e context of a wide range of technologic al, biolog ical, and social appl ications. S tatisti cal analysis of networ k data has bec ome particu larly popula r in th e past decade . S ee K olaczyk ( 200 9 ), for example, for a compreh ensi ve ove rvie w of the main classes of methods for statistica l inference on network s, as well as Goldenb erg et al. ( 2010 ),- f or a shorter revie w . Altho ugh the results presented in th is paper ar e ap plicable to v arious networ k appl ications, our curre nt wo rk has been moti v ated by and will be illustrated within the conte xt of gene/p rotein re gulatory network s. Reg ulatory interactio ns among genes /proteins are pi vot al to the func tion of li ving or ganisms, and understandi ng regulato ry net- works can help to char acterize bio logical pr ocesses in general, a nd also to diagnose ∗ This work w as supported in part by NIH award GM 078987 a nd by ONR award N0 001409106 54. K eywo rd s and phrases: multi-attribute association networks, gene/protein regulatory networks, canonical correlation 1 2 KA T ENKA AND K OLACZYK dif ferent diseases and dev elop ne w cures. The standard represen tation for a network i s a gra ph that co nsists of a collectio n of nodes (e.g., genes, prot eins, social actors, computer s) and links that indicate some notio n of node interactio n (e.g., co-re gulati on, interac tion, frien dship, com- municati on). Additionally , nodes or l inks, or both, can be accompani ed by a single or a set of multiple attrib utes or characteri stics. One of the fundamental proble ms in the area, common across dif ferent applicatio ns, is that of infe rring the under - lying network topology . Examples arise in the con text o f g ene/prote in regulator y netwo rks, computer netw orks, senso r networks , social netw orks, and more. For exa mple, bas ed on obse rved flow data between dif ferent co mputers, a reasonable communica tion network can be ap proximated (e.g., Eriksson et al. ( 2007 )); bas ed on obtained geographi cal positions, a randomly de ployed w ireless sensor network can be reconstr ucted (e.g., Pal ( 2011 )); or based on data gathered from indi viduals about their personal intera ction, preference and/or attitu des, a network of socia l relatio ns can be prod uced (e.g, Sampson ( 1969 )). There a re a nu mber of v ariatio ns on the problem of netw ork topol ogy inference . See Ko laczyk ( 2009 , Chap. 7), for example, for an over vie w . In this paper , we fo- cus on inferen ce of associat ion networks , where a link between two dif ferent nodes is said to ex ist when a suf ficient le ve l of associ ation is present be tween a certain set of node characteris tics (attrib utes ). A link between two nodes in an associatio n netwo rk m ay in dicate a certai n lev el of inte raction, dependen ce, or similarity , de- pendin g on ho w ‘associati on’ is quantified. While in reality the actua l relatio nal ties bet ween elements typic ally are based on a ssociatio n across multiple attrib utes , the va st majo rity of work to date on associatio n networks in v olves ties d efined with respec t to only a sing le attrib ute. Here we are in terested in reco vering the stru cture of an associ ation net work where multiple attrib utes are observ ed for each no de. Analysis o f multi ple attri bute s at their correspo nding network li nks has recei ved comparat iv ely little att ention in t he literat ure. In th e early 1980s log- linear mod- els were adap ted by Fienber g, Meyer and W asserman ( 1985 ) for the analysi s of social interactio n networks among 18 monks in a cloister and the analy sis of a corpor ate interlock netw ork of the 2 5 lar gest or ganiz ations in Minn eapolis/St.P aul; much later , canonical correlation analysis was applied by Carroll ( 2006 ) to two multiple x networks that described interdep endence and coop erati ve alliances be- tween 31 7 banks . Other examples incl ude work predicting friend ships, the part ic- ipatio n o f acto rs in e vents ,- and semantic relationship s such as ’adviso r-o f ’ based on web page links and cont ent (see Goldenb erg et al. ( 2010 ) for more a detaile d re vie w). More recently , Chang and Blei ( 2010 ) focused on multiple attrib utes of documen t networks and dev eloped a hierarc hical model of both network structure and n ode attrib utes. Using repeated interactio ns between sen ders an d rec eiv ers tab- ulated ov er time Perry and W olfe ( 2011 ) modeled message sending behav ior in a MUL TI-A TTRIBUTE NETWORKS 3 corpor ate e-mail network. Although these studie s are focused on the analysis of netwo rks equipped with mult iple node attr ibut es, they dif fer in a critical mann er from our work in that they assume obser ved network topologi es, rather than – as here – focus ing specifically on the pro blem of inferring the netw ork from the node attrib utes . The importance of this distinction is particu larly evi dent within the context of computa tional biol ogy and ou r motiv ating appl ication the rein. In particular , current and anticip ated ‘Omic’ techno logies (e.g., geno mics, tran scriptomics , proteomics and metabolomics) can profile cells at dif ferent biolo gical le vels, includi ng but not l imited to ge ne, prote in, metabolic, and e pigenetic le vels. While compu tational analys es (e.g., differ ential e xpressio n, clus tering, network, etc.) bas ed on indi vid- ual types of pro files hav e no doubt prov en to be us eful, analyses based on multip le types of molecula r profiles combined on the same set of biolog ical samples can be syner gisti c. See, for ex ample, Lee et al. ( 2004 ); Myer s et al. ( 2005 ); Naylor et al. ( 2010 ); Sha nka var am et al. ( 2007 ); W aaijenb org , V ersele wel de W itt Hamer and Zwinderman ( 2008 ). The work in Lee et al. ( 2004 ) is perhaps clo sest i n spir it to ours , in that mul- tiple networks init ially inferre d from di v erse sing le functi onal genomics d ata are inte grated to form a single network, using a log-li keliho od scoring scheme. T o the best of our kno wledge, there has been no work on direct inferenc e of multi-att ribu te net works with particular attenti on to spec ifically understan ding (a) ho w differe nt node attrib utes contrib ute to the str ength of a link between diffe rent nodes a nd (b) the imp act of ha ving a va ilable only a sub set of a ttrib utes, both o n the inferen ce of network to pology and the int erpretatio n of hi gh-le vel network cha rac- teristi cs. In the resea rch we report here w e addr ess th ese issues by answering the follo wing questi ons: how to aggre gate observ ed multiple continu ous attribu te vari- ables into a singl e m easure of the tota l similarity; ho w to a ssess the co ntrib ution of each node attrib ute to this similarit y measure; what the impl ications of the choic e and the number of node attrib utes a re on high-le vel network charact eristics, such as node degree , clust ering coef ficient, an d bet weenness cen trality; and , finally , ho w to ext ract an d interpret in formation obt ained fro m a net work inferred from mul tiple node attrib utes. Specifically , to aggregat e multiple attrib utes into a measu re of a total simila rity between a pair of nodes, we propose to quantify the strength of the link b etween dif- ferent nod es w ith c anonical correlatio n, or iginally introdu ced by Hotelling ( 19 36 ). W ithin this context , we then ex amine both analy tically and numerically the impact of partia l information on the ab ility to detect a li nk between a pair of nodes. T o assess the impo rtance of indi vidual n ode attrib ute s, we use a notion of cano nical weights. W e explo re the impact o f the attrib ute se lection on higher -le vel n etwork summary statis tics in the context of gene/protei n regulato ry network s in human cancer cells. Finally , based on the association network inferred from combined 4 KA T ENKA AND K OLACZYK profiles of genes and protein s, we propo se a simple heurist ic for link and nod e cla s- sification that allo ws to mak e rea sonable interp retation of the co nnection between attrib utes and classified node s. W e v alidat e the propo sed heuristic by determining the sign ificant en richments of kno wn genomic entities among acqu ired classes of nodes . The rest of th e paper is structure d as follo ws. In Section 2 we intr oduce the mo- ti va ting applicatio n of ou r study and desc ribe related work in th e area. In Secti on 3 we provi de a general formulati on of the problem, state the main assump tions, and introduc e the mathematical notion of canon ical correlatio n in terms of net- work inference. In Secti on 4 we describe a method of ne twork inference base d on hypot hesis tes ting and we exp lore the ef fect of dif ferent paramete rs on the po wer of link detection. In Section 5 we study potenti al implication s of node attrib ute selecti on on networ k summary s tatistics in the context of gene/pro tein reg ulatory netwo rks. W e conclude the pa per with the discussio n and fi nal remarks in Secti on 6 . 2. Moti vating A pplication. In the applica tion herein, we explor e the us e of multi-att ribu te association network analysis for combinin g measuremen ts on gene and protein expressi on le vels in order to recov er net works of gene/prote in interac- tions ef fecti vely . W e choo se to an alyze data from the well-kno wn NCI-60 database, w hich con- tains di ffer ent molecular p rofiles on a pa nel of 60 di vers e human can cer cell lines 1 . Specifically , we examine protein pro files (i.e., normalized rev erse-ph ase lysate ar- rays (RPLA) for 92 antibodies ) and gene profiles (i.e., normalized RN A microar - ray in tensities from H uman Genome U95 Affymetrix chip-set for > 9000 genes). T radition ally , it has been significan tly m ore difficult to obtain protein -lev el ex- pressi on measurements than gene-le v el exp ression measu rements, alth ough the former typi cally hav e been consi dered to be more acc urate and informati v e than the latte r . Accordin gly , our analysis will be restricted to a common subs et of 91 genes/ proteins for which both types of biolo gical measuremen ts are av ailable to us. E ach gene/protein is represen ted by its Entrez ID (a un ique ide ntifier common for a prote in and a correspo nding gene that encodes this protein) and has a pair of att ribu tes: p rotein profile and gene expressio n across the same set of 60 cance r cells. T ypically , pr otein-pro tein (gene-g ene) interaction network s are modeled by as- sociat ion graphs , with nodes cor respondin g to pr oteins (genes) , that has a si ngle attrib ute, that is, prote in profile (gene exp ression), and edges indica ting some lev el of assoc iation between a pair of proteins (genes) . Associations between pairs of protei ns can indicat e either direc t binding and indirect partici pation in the same 1 Dataset av ailable at http://discov er .nci.nih.go v/ MUL TI-A TTRIBUTE NETWORKS 5 metaboli c pathways or cellula r process, and usual ly are known or inferred from corres ponding protein profiles summariz ed into some association measu re. Simi- larly , gene-gene associatio ns may refer to direc t c o-regu lation or indi rect interac- tion in the same functional processes, and may also be known or inferred. V arious measures o f associatio n hav e been used in th e lite rature for the i nference of bi olog- ical associa tion networks, includ ing Pearson’ s product moment correlatio n (e.g., Steuer et al. ( 2003 )), partial correlatio n (e.g., de la Fuente et al. ( 2004 ); Shipley ( 2002 )), an d mutua l informatio n (e.g., B utte and K ohane ( 2000 ); Butte et al. ( 2000 ); Faith et al. ( 2007 )). See Gardner and Faith ( 2005 ); Lee and Tzou ( 2009 ), for ex- ample, for re vie ws of associatio n measu res and their correspo nding comput ational methods , as us ed in the contex t of inference of gene expressi on ne tworks. As descr ibed in detail in Section 3 , we use correl ation-bas ed measures of as soci- ation in this pape r , th at is, Pearson produc t moment cor relations fo r networks based on indi vidual attrib ute s and canonical correlation for multi-attrib ute netwo rks. Al- thoug h cert ainly th e work of o ther authors has in volv ed multiple types of da ta when inferri ng genomic network s (e.g., Naylor et al. ( 201 0 ); Shank av aram et al. ( 2007 ); W aaijenb org , V ersele wel de W itt Hamer and Zwinderman ( 20 08 ); Y amanis hi et al. ( 2003 )), to the best of our knowled ge ou r work is the first to do so in a manne r fo- cused specifically on the notion of a multi-attri bute netw ork and its relation to the corres ponding ind ivi dual-attri bute netwo rks. By way of illustratio n, consider the e xample of a simple protei n networ k con- sisting of three nodes: Anne xin A1, Anne xin A2, and Ker atin 8. Anne xin A1 an d Annex in A2 are two calcium-b inding proteins tha t are encoded by genes ANXA1 and ANXA2, respecti v ely . Ke ratin 8 is a k eratin pr otein encod ed by the gene KR T8. Ker atin 8 can be used to dif ferent iate lob ular carcin oma of the breast from ductal carcin oma of the b reast. Anne xin A1 has be en o f inte rest for use as a p otential anti- flamatory and antica ncer drug. T he gene for Ann exin A1 (ANXA1) is upre gulate d in hairy cell leu kemia and can be use d for diagnosin g the d isease. Annexin A2 is a less explo red pr otein that is usually in v olved in the m otility of the epithelia l (ski n) cells. Giv en protein profiles recorded on th e same set of cells for all three nodes (An- nex in A1, Anne xin A 2, and Kera tin 8) , we inferred the presence of links between all three pairs of nodes (left panel, Figure 1 ); gi ven correspon ding gene expre s- sions, we inferred links only between A NXA2 and ANXA1 and between AN XA2 and KR T 8 (middl e panel, Figure 1 ). This observ ati on confirms the expecta tion that dif ferent molecular profiles can produce diffe rent networks, and, hence, an associ- ation between protein p rofiles d oes no t necessarily imply an associat ion between corres ponding gene exp ressions, and vice versa. A priori, it is not immediatel y clear ho w to compare thes e netwo rks, and, more importantly , how to combine in- formatio n base d on both proteins profiles and gene express ions. 6 KA T ENKA AND K OLACZYK Annexin A1 (301) Keratin 8 (3856) Annexin A2 (302) ANXA1 (301) KRT8 (3856) ANXA2 (302) 301 3856 302 F I G 1 . Inferr ed association networks based o n pr otein pr ofiles (left panel), g ene expr essions (middle panel), and combined pr ofiles (right panel). Numbers r epr esent unique Entr ez IDs. Moti va ted by these question s, we utilize the canonic al corre lation framew ork from classica l multi va riate statistics to aggreg ate ge ne express ion and protein pro- files and cons truct a network ba sed on combined pro files (rig ht panel, Figure 1 ). W e see that the resul ting network includes links betwee n all three gene /protein pairs, like that net work based only on protei n profile s. As we describe lat er , in the applic ation of Section 5 , we are also able to equip this network with numerical v alues su mmarizing the contrib ution of each type of dat a (i.e., protein profile ver - sus gene expressi on) to each link, thus allowin g us to offer an interpret ation of the relati ve role of each link /node in this networ k in terms o f gene and protein acti v- ity . This int erpretatio n may be used in turn to classify nodes (i.e., into pro teomic, genomic , or ‘mixed’ roles) and we find, through enrichment analys is with a bi- ologic al databas es on molecula r pathw ays (i.e., KEGG 2 ), that ou r classification s appear to be quite sensibl e when interp reted within the broader biological context. See Section 5 for details . 3. Multi-Attrib ute Associatio n Netw orks. By an asso ciation networ k we will mean a graph G = ( V , E ) , for nodes v i ∈ V , i = 1 , . . . , N v = | V | , and edges e ( i, j ) ∈ E , in which edge s indicate a suf ficient le ve l of associati on between the attrib utes of these nodes, according to some criterion function. N ode attrib utes can be, for exa mple, personal characteri stics and prefer ences in social networks or le vels of acti vity on dif ferent biolog ical dimen sions of a cell in biological network s. Our i nterest h ere is in c ontext s where no des are possesse d of multiple attr ibu tes, all o f which may enter into determining associa tion between nodes. That is, we are interes ted in multi-attrib ute as sociation networ ks . The main issue we consider in this section is th e definition of a suitable summary of as sociation between pa irs of nodes an d the relationsh ip amon g suc h summaries when bas ed on only subse ts of the full set of attribu tes. The ques tion of inference of links in our network, giv en a 2 KEGG (Kyoto Encyclopedia of Genes and Genomes) is a bioinforma tics resource for l inking genomes to life and the en vironment, http://www .genome .jp/kegg/. MUL TI-A TTRIBUTE NETWORKS 7 choice of associat ion m easure , is ad dressed later in Section 4 . 3.1. Measur es of Associatio n. Suppose that for each node i one can poten- tially obser ve K attrib utes and define a correspond ing multiv ari ate random v ari- able X i = ( X (1) i , .., X ( K ) i ) T . In what follo ws, we assume that all attrib utes are contin uous random v ariables . L et S I M C ( i, j ) be a specified measu re of similar- ity between nod es i and j base d on the subset of the node attrib utes C , where C ⊂ { 1 , .., K } . For a suf ficientl y ‘l arg e’ value of similarity S I M C ( i, j ) between nodes i and j , an edge e ( i, j ) will be assig ned. In other words, we are intereste d in similarit y measures S I M C ( i, j ) that con stitute a ’non triv ial’ lev el of associatio n between attri bute s of two n odes i and j of ne twork G . Usu ally , the similarity func - tion S I M C ( i, j ) is not obs erv able, b ut, nev ertheless, can be potentially estimated from the informatio n cont ained by measurement s on node attri but es. Intuiti v ely , it is e xpected that any chos en simil arity measure S I M C ( i, j ) wo uld dif fer for a dif fere nt ch oice of subset of node at trib utes C . Therefore, it is i mportant to un derstand how similarity measure S I M C ( i, j ) varies fo r dif ferent subse ts of attrib utes within a giv en cl ass of similarity mea sures. As a rule, the choice of an approp riate similarity measure, to a lar ge e xtent, depe nds on a s pecific app lication. Here we restric t our at tention to correlatio n-based similarit y measures. When only a single attrib ute is a vail able ( K = 1 ), the Pearson product moment correla tion (1) ρ ( i, j ) = co v( X i , X j ) p v a r( X i )v ar ( X j ) is commonly used as a similarity m easure . When mor e than one node attri but e is under considera tion ( K > 1 ), Pearson’ s correlatio n between node s i and j can be compute d f or each common attribu te separatel y ρ l ( i, j ) = co rr( X ( l ) i , X ( l ) j ) , l ∈ C , and then, if desired, computed v alues can be summarized into some aggregat ed measure of total between node similarity S I M C ( i, j ) . For example : • Maximum cor relation (2) S I M C ( i, j ) ≡ max l ∈ C ρ l ( i, j ) , • Minimum cor relation (3) S I M C ( i, j ) ≡ min l ∈ C ρ l ( i, j ) . While these choices of multi-attrib ute similarity are intuiti ve and straigh tfor - ward, the ir main disadv antage is that they d o not take into acc ount the correlati ons between attrib ute s obse rved on the same node and the cross-corre lations between 8 KA T ENKA AND K OLACZYK attrib utes obs erved on dif ferent nodes . From thi s perspe ctiv e, canoni cal correlation is a more na tural choice of total similarity for two main reasons. First, because it tak es into consider ation both the cor relations between att ribu tes on the same node and the cross-cor relations between diff erent att ribu tes on dif ferent nodes, and sec- ond, because canonic al correlati on relates no de se ts of attrib utes in an o ptimal way . Addition ally , canonic al corre lation a nalysis prov ides a way to ev aluat e the effecti v e number and the importance of node attrib utes. Originall y , introduce d by Hotelling ( 19 36 ) and n ow a cl assical too l in mult iv ari- ate s tatistics, we propose t o use the canonical cor relation ρ c ( i, j ) here as a mea sure of to tal similar ity between multiple node attrib utes X i and X j of two nodes i and j in a network . W e recall that computatio n of ca nonical correlation ρ c ( i, j ) is eq uiv - alent to maximizat ion (in abso lute val ue) of the correlat ion between two linear combina tions w T i X i and w T j X j with respec t to the ve ctors of weights w i ∈ R | C | and w j ∈ R | C | , also called cano nical weigh ts: (4) ρ c ( i, j ) = max w i ,w j ∈ R | C | corr( w T i X i , w T j X j ) . Note that since canon ical weights w i and w j depen d on a pair of inde xes ( i, j ) , the y are defined for each pair ( i, j ) separately . Howe ver , we ha ve su ppressed this detail in our notati on for the purp ose of readability . By definition, the canonical correl ation ρ c is a boun ded quantit y that tak es v al- ues between zero and one. By const ruction, ρ c is alway s greate r or equal to the maximum in absolute v alue of any cr oss-attrib ute correlation between any pa ir of nodes in a network : ρ c ( i, j ) = max w i ,w j ∈ R | C | corr ( w T i X i , w T j X j ) ≥ max l 6 = k ∈ C | corr(X (l) i , X (k) j ) | . W e will find it useful to adopt the eig en v alue formulatio n of the can onical cor - relatio n, and we will express this formulation in terms of correlation matri ces. Let Σ ii = C orr( X i ) and Σ j j = C orr( X j ) be the mar ginal correl ation matrice s of attrib utes of nod e i and node j , respe ctiv ely; and let Σ ij = Corr( X i , X j ) be the cross- correlatio n m atrix between attribu tes of node i , and attrib utes of node j . The n the correla tion sup ermatrix Σ( i, j ) can be represented as (5) Σ( i, j ) = Σ ii Σ T ij Σ ij Σ j j , and the canoni cal co rrelation ( 4 ) can be exp ressed as (6) ρ c ( i, j ) = max w i ,w j ∈ R | C | w T i Σ ij w j q w T i Σ ii w i q w T j Σ j j w j , MUL TI-A TTRIBUTE NETWORKS 9 where the vectors of weigh ts w i and w j can be fou nd di rectly by solving the opti- mization proble m abo ve, or by solvi ng the system of eigen v alue equations (7) Σ − 1 j j Σ T ij Σ − 1 ii Σ ij w j = λ 2 w j , Σ − 1 ii Σ ij Σ − 1 j j Σ T ij w i = λ 2 w i . The canonica l weights w i and w j are the eigen v ectors that correspond to the max- imum eigen valu e λ 2 , the square root of which equals ρ c ( i, j ) . Using ca nonical correl ation, a natu ral criterio n for assigning an edge between two n odes i and j is that ρ c ( i, j ) be greater than ze ro. When an edge exis ts, the canon ical w eights w i , w j and the canonical scores w T i X i , w T j X j can be used to assess the relati ve contrib ution of each of the K attrib utes to that edge. This inter- pretati on is an analogy to ho w we would e v aluate the importan ce of e xplanato ry v ariables in a multiple regre ssion anal ysis. K ey ideas follo w from the interpret ation of these quantities. S pecificall y , the squared canonical correlation ρ 2 c ( i, j ) is inter - preted as the percentage of variat ion sh ared by the sets of attrib utes of nodes i and j along the directions defined by the cano nical weights w i , w j . F urther more, the standa rdized canonical weights can be u sed to as sess the relati v e importance of in- di vidual node attrib utes to a giv en canoni cal correlation . In part icular , the squared, standa rdized canonica l weig ht ( w ( l ) i ) 2 , l ∈ C , pro vides the relati v e contrib ution of attrib ute l of node i to ρ c ( i, j ) . Finally , canonical scores w T i X i and w T j X j repres ent aggre gated measures of attrib utes for n odes i and j , respecti ve ly . Often in network analysis it is not unreaso nable to assume a certai n le vel of homogen eity across nodes in a network. In the conte xt of our model for multi- ple attrib utes, a natural set of homogeneity as sumptions consi sts of assuming (a ) equali ty of th e margi nal correlatio n matric es, that is, Σ ii = Σ j j , and (b) symmet ry of the cros s-correlat ion matrix, that is, Σ ij = Σ T ij . The first assumption dictates that the corr elations among attrib utes within a nod e are the same for bo th i and j . The seco nd assumptio n dictates th at the corr elation among an y pair of attrib utes between no des i and j , one from i and one from j , respe ctiv ely , is un changed if instea d w e loo k at those same tw o attrib ute s but from j and i . In this case , we hav e the follo wing result. P RO P O S I T I O N 3.1 . Under the homoge neity assumpt ions that Σ ii = Σ j j and Σ ij = Σ T ij , th e opt imization ( 6 ) de fining the ca nonical corr elation ρ c ( i, j ) between nodes i and j s implifies to (8) ρ c ( i, j ) = max w ∈ R K w T Σ ij w w T Σ ii w , and the corr esp onding eig en va lue pr oblem is re duced to Σ − 1 ii Σ ij w = λw . (9) 10 KA T ENKA AND K OLACZYK A proof of this result is giv en in the appendix. T his result has the important im- plicati on that, under homogeneity , only one set of ca nonical weights is requ ired. Therefore , when an edge exists between nod es i and j , that is, when ρ c ( i, j ) > 0 , this single vector w is a summary of the relati v e con trib ution of each at trib ute to the e dge. W e will mak e us e of this ho mogeneity assumptio n and the correspo nding result both in the illustrat ion that follo ws ne xt, in Section 3.2 , and in the simula- tions of Sectio n 4.2 . In pr actice, these homogen eity conditions can be check ed, for each pair ( i, j ) , u sing a simple lik elihood ratio testing proc edure, as we do in the applic ation des cribed in Section 5 . 3.2. Illus tration : The C ase of K = 2 . For the purpose of illustratio n, we con- sider the spec ial ca se of a single pair of nodes and K = 2 attrib utes observ ed o n each node. Let X i = ( X (1) i , X (2) i ) T and X j = ( X (1) j , X (2) j ) T be the attrib ute ve c- tors for two nodes i and j , with common mar ginal corr elation matrix C orr( X ) ≡ Σ m and symmetr ic cross-corre lation matrix Corr( X i , X j ) = Corr( X j , X i ) ≡ Σ c . W e parametri ze Σ m and Σ c as Σ m = 1 r r 1 and Σ c = ρ 1 b b ρ 2 , yielding Σ = Σ m Σ c Σ c Σ m . Here the paramete r r = Corr( X (1) , X (2) ) represents the m ar ginal corre lation be- tween the two attribu tes o n a giv en node; b = Corr( X (1) i , X (2) j ) = Corr( X (2) i , X (1) j ) is the cr oss-attrib ute corr elation betwee n nodes; and ρ 1 = Corr( X (1) i , X (1) j ) and ρ 2 = Corr( X (2) i , X (2) j ) are the within-attrib ute co rrelations between nodes for the first and the second attrib utes , respec tiv ely . T o explor e the space of parameter values where the canon ical correlation ρ c is w ell-define d, and the effect of those parameter v alues on the v alue of ρ c , we in v estigate the conditions und er which the corre lation matrix Σ is pos itiv e-definite . The eigen valu es corres ponding to Σ are of the form eig 1 , 2 (Σ) = 1 − ( ρ 1 + ρ 2 ) ± p ( ρ 1 − ρ 2 ) 2 + 4( b − r ) 2 2 , eig 3 , 4 (Σ) = 1 + ( ρ 1 + ρ 2 ) ± p ( ρ 1 − ρ 2 ) 2 + 4( b + r ) 2 2 . These eigen valu es are posi tiv e, and, consequ ently , Σ is positi ve -definite, if the fol- lo wing condition s are satisfied: (10) | b − r | < A 1 = p (1 − ρ 1 )(1 − ρ 2 ) , | b + r | < A 2 = p (1 + ρ 1 )(1 + ρ 2 ) . MUL TI-A TTRIBUTE NETWORKS 11 The domain of the canonical correlatio n ρ c in terms of values r , b , for fixed v alues of ρ 1 and ρ 2 , where ρ 2 > ρ 1 , represents an oblique parallelep iped centered at the origin and w ith its size defined by value s of 2 A 1 and 2 A 2 , which in turn depen d on ρ 1 and ρ 2 . The correspon ding valu e of the ca nonical correlation can be compute d e xplicitly by solving Σ − 1 m Σ c x = λx with respect to λ , yieldin g ρ c = max eig 1 , 2 (Σ − 1 m Σ c ) = max ( ρ 1 + ρ 2 − 2 br ∓ √ D 2(1 − r 2 ) ) , (11) where D = ( ρ 1 − ρ 2 ) 2 + 4( b − ρ 1 r )( b − ρ 2 r ) . Figure 2 sho ws th e domain of canonical correlati on (le ft panel) and actual v al- ues o f cano nical correl ation (right pane l) compute d for fix ed v alue s of ρ 1 = 0 . 3 and ρ 2 = 0 . 1 as functions of r and b . If th e cross-co rrelation b is induce d by corre- lation r between at trib utes o f the same node, then the canoni cal correlation is not notice ably greate r tha n the m aximum in a bsolute v alue of ρ 1 , ρ 2 , and b . Howe ve r , if substa ntial cross- correlatio n b exists between dif ferent at trib utes, th en the value of the canonical correlatio n is noticeably greater than ρ 1 , ρ 2 , or b . Canonical weights F I G 2 . Domain of canonical corr elation (left pan el) and actual v alues of canonical co rr elation (right panel) computed for fixed values of ρ 1 = 0 . 3 and ρ 2 = 0 . 1 as functions of r and b . r b −1 0 1 −1 0 1 r b −1 0 1 −1 0 1 −1 −0.5 0 0.5 are depicted i n Figure 3 . Since a ll ne cessary con ditions of P ropos ition 3.1 are sati s- fied, only one set of weights ( w 1 , w 2 ) for eac h pai r o f no des n eeds to be computed. Squared, standardize d weights w 2 1 and w 2 2 , in this scenario, pro vide relati v e con- trib ution of the fi rst and the second attrib utes to ρ c . When b is relati vely small, meaning , there is no substan tial cross- correlatio n between dif ferent attrib utes of dif ferent no des, the val ue of canonic al correlati on is ef fecte d, to a lar ge extent, by that attrib ute on which the correla tion between two nodes is the strong est. T his results in a large valu e of w 2 1 (close to one), and conse quently a small value of w 2 2 (close to zero). For small and moderate valu es of r , as the cross- correlatio n 12 KA T ENKA AND K OLACZYK increa ses in absolut e v alue, the value of canonical correlatio n also increases, and so too the influen ce of the second attrib ute. This tendency results in lo wer v alues of w 2 1 and higher v alue s of w 2 2 . Due to th e cons traints on r and b for obtai ning a v alid cov ariance matrix Σ , not a ll combinat ions of these parameters result in p roper v alues of ρ c , w 1 , and w 2 . F I G 3 . Squar ed st andar dized canonical weights w 2 1 (left panel) and w 2 2 (right panel) computed for fixed values of ρ 1 = 0 . 3 and ρ 2 = 0 . 1 as functions of r and b . r b −1 0 1 −1 0 1 0 0.2 0.4 0.6 0.8 1 r b −1 0 1 −1 0 1 0 0.2 0.4 0.6 0.8 For K > 2 , in the simplest scenario , where all off-dia gonal elements of the matrix Σ m are equal to r and all diagonal elements equal to 1 , a nd all off -diagonal elements o f th e cros s-cov arian ce matrix Σ c are equal to b and diago nal elements equal to ρ , the correspo nding eigen v alues of Σ can be computed explic itly: eig 1 , 2 ,.., ( k − 2) (Σ) = (1 − r ) ± ( ρ − b ) , eig ( k − 1) ,k (Σ) = (1 + ( k − 1) r ) ± ( ρ + ( k − 1) b ) . These v alues are positi ve provide d − 1 / ( k − 1) < r < 1 , | ρ − b | < | 1 − r | , | ρ + ( k − 1) b | < | 1 + ( k − 1) r | , and the corresp onding can onical correlation is ρ c = max ρ − b 1 − r , ρ + ( k − 1) b 1 + ( k − 1) r . In this situation, there are only two unique cano nical roots, and so we can use any t wo or e ve n one attrib ute to infer lin ks in the networ k. In general, ho wev er , for netwo rks with an arbitrary number K of multiple attrib utes per node and less triv ial correla tion structure , the numbe r of parameters increases sign ificantly , so th at an exp licit expressi on of the cano nical correlation becomes intractabl e. MUL TI-A TTRIBUTE NETWORKS 13 4. Network T opology Inference . W e describe here a testing -based approach to inferrin g multi-attri bute assoc iation networ ks and we presen t the results of a small simulation study compari ng the po wer of edge detec tion using the se vera l definitio ns of si milarity detailed abov e in the previo us section. 4.1. Method s. R ecall that a link b etween tw o no des i and j in a mu lti-attrib ute associ ation netwo rk G = ( V , E ) is present when there is suffici ent similarity S I M C ( i, j ) between the correspon ding sets of attrib utes X i and X j , base d on some choic e of subset C ⊆ { 1 , . . . , K } of | C | attrib utes. Given appropri ate data, we wish to infer the t opology of our netw ork G . In gen eral, for inf erence of sin gle- attrib ute associatio n networ ks metho ds are of two types: those based on principles of hypothes is tes ting and those based on regress ion p rinciples. S ee K olaczyk ( 2009 , Chap. 7.3) for an ov ervie w . Here w e choose to employ a te sting-bas ed approach for inferri ng multi -attrib ute as sociation networks. Specifically , giv en a choice of similarity S I M C ( i, j ) , and n independen t and identi cally distrib ute d observ atio ns { ( x ik , x j k ) } n k =1 of the random varia ble pair ( X i , X j ) o f at trib utes for a pair of no des i and j , we approac h the task of d eter - mining whether e ( i, j ) ∈ E as one of testing the hypoth eses (12) H 0 : S I M C ( i, j ) = 0 versus H 1 : S I M C ( i, j ) 6 = 0 . W e test each such pair of nodes ( i, j ) , for i, j ∈ V and i < j , and control for the lar ge number of tests (i.e., N v ( N v − 1) / 2 in all) using false disco very rate princi ples, th rough applicatio n of the method of Benjamini and Hochber g ( 1995 ). The netwo rk G of primary inter est to us in this pa per is that defined through the use of canonical correlation as ou r similarity measure. The correspon ding hypoth- esis testin g prob lem is H 0 : ρ c ( i, j ) = 0 versus H 1 : ρ c ( i, j ) 6 = 0 . (13) There are se veral test statistics from classical multi v ariate statistics that can be used in testing these hypothese s. Here we employ the one argua bly mo st commonly used, Bartlett’ s χ 2 statist ics ( Bartlett , 1941 ). Specifically , we compute for each pa ir ( i, j ) the stat istic (14) χ 2 ( i, j ) = − [( n − 1) − ( | C | + 0 . 5)] ln | C | Y l =1 h 1 − ˆ ρ 2 c ( l ) ( i, j ) i , which, by W il k’ s theorem, under H 0 is asymptoticall y distrib uted as a χ 2 random v ariable with | C | 2 deg rees of freedom, when applied to a subset C ⊆ { 1 , . . . , K } of | C | attrib utes. Note that in order to comput e this stati stic it is necessary to es- timate the mar ginal and cross- correlatio n matrices for each edge i and j and to 14 KA T ENKA AND K OLACZYK solv e the generalize d eigen v alue problem ( 6 ) (or , under homogeneity , the eige n- v alue pro blem ( 9 )), comp uting all eigen v alue roots ˆ ρ 2 c ( l ) = λ l , l = 1 , ..., | C | . This may be done using standard softwar e. In addi tion, in order to estimate (2 | C | ) d i- mension al super- correlatio n matrix, fo r each attr ibu te, one needs to h av e at le ast (2 | C | )(2 | C | − 1) / 2 in dependen t obse rva tions. In the absence of suf ficiently large numbers of obse rva tions, if the unde rlying netw ork is expect ed to be s ufficie ntly sparse , an alternati v e would be to compa re the test st atistic to a null distrib utio n deri ved from empiric al nul l principles ( Efron , 2010 ). Note that by declaring an edge base d on Bartlett’ s χ 2 statist ics ( 14 ), we use canon ical v ariab les of all order s ρ 2 c ( l ) = λ l , l = 1 , ..., | C | by definition. Howe ve r , once an edge is declared, we assign it canonical weights th at corre spond to the first order (the maximum)cano nical cor relation ρ c ≡ ρ c (1) . By way of c omparison, and in preparatio n for ou r simula tion stu dy belo w , we also consider the co rrespond ing testing procedure s for inference of G bas ed on (i) just a single attrib ute and Pearson’ s product moment co rrelation, and (ii) a max- or min-base d aggre gation acr oss a ttrib utes, combin ing the indi vidual Pearson c orre- lation s per the express ions in ( 2 ) an d ( 3 ). In the cas e where only a single at trib ute is us ed fo r each node (in deed, perh aps only a single attrib ute is observ ed), and Pearson’ s correlat ion is used as a m easure of similarity between a pair of nodes, a link between nodes i and j is declared accord ing to the followin g test of hypothes es: (15) H 0 : ρ ( i, j ) = 0 ver sus H 1 : ρ ( i, j ) 6 = 0 . The natural test statist ic is the empirical correl ation ˆ ρ ( i, j ) , w hich is commonly transfo rmed and c ompared to ei ther standa rd normal distrib uti on or an appropri- ate Stud ent’ s t -dis trib ution. S ee K olaczyk ( 2 009 , Chap. 7.3.1). Here we adopt the former formulat ion, ba sed on Fisher’ s transformation , comparing the statistic (16) z ( i, j ) = √ n − 3 2 log (1 + ˆ ρ ( i, j )) (1 − ˆ ρ ( i, j )) , to a normal distrib utio n with mean zero and v ariance one. In the case of max- or min-based aggre gation across a ttrib utes, a link between nodes i and j is declar ed according to the follo wing tests of hypot heses, respec- ti vely: H 0 : ρ l ( i, j ) = 0 , ∀ l ∈ C ver sus H 1 : max l ∈ C ρ l ( i, j ) 6 = 0 (17) H 0 : ρ l ( i, j ) = 0 , ∀ l ∈ C ver sus H 1 : min l ∈ C ρ l ( i, j ) 6 = 0 . Here, we estimate the sample correlation ˆ ρ l ( i, j ) for each attrib ute l ∈ C and compute the corres ponding testing statist ic z l ( i, j ) using Fisher’ s transfo rmation MUL TI-A TTRIBUTE NETWORKS 15 ( 16 ). Since z ( i, j ) is an increasing functio n of ˆ ρ ( i, j ) , the maximum (min imum) of z l ( i, j ) will cor respond to the maxi mum (mini mum) of ˆ ρ l ( i, j ) . T o cal culate p - v alues assoc iated with su ch tests, approximatio ns ba sed on the so-c alled rhomb us formula may be used Efron ( 1997 ); Li et al. ( 2008 ). 4.2. A Simulation Study . In order to gain some insight into the comparati ve be- ha vior of these dif ferent tes t-based approa ches to in ferring associa tion networks , and the diff erent wa ys in w hich they utilize information on multiple attribu tes, we condu cted a small simulation study . In what follo ws w e e v aluate n umerically the po wer of each test to infer an indi vidua l link. Specifically , we in fer the presence of a link defined throu gh (1) Pearson’ s c orrelation measured on the first attri but e, based o n ρ 1 > 0 ; (2) Pearson’ s correlation measured o n the s econd attr ibut e, based on ρ 2 > 0 ; (3) the maximum correlation , max( ρ 1 , ρ 2 ) > 0 ; (4) the minimum cor- relatio n, min( ρ 1 , ρ 2 ) > 0 ; and (5) th e canon ical correla tion, ρ c . The correspon ding hypot heses to b e tested are 1. H 0 : ρ 1 = 0 vs. H 1 : ρ 1 > 0 , 2. H 0 : ρ 2 = 0 vs. H 1 : ρ 2 > 0 , 3. H 0 : ρ 1 = ρ 2 = 0 vs. H 1 : max( ρ 1 , ρ 2 ) > 0 , ( ρ 1 > 0 or ρ 2 > 0) , 4. H 0 : ρ 1 = ρ 2 = 0 vs. H 1 : min( ρ 1 , ρ 2 ) > 0 , ( ρ 1 > 0 and ρ 2 > 0) , 5. H 0 : ρ c = 0 vs. H 1 : ρ c > 0 . Our simulations are perfo rmed unde r the follo wing set up. W e fi x value s ρ 1 and ρ 2 to be 0 . 3 and 0 . 1 , respecti ve ly and generate 1000 independen t data samples of size n = 50 from the m ulti v ariate normal distrib ution ( X, Y ) ∼ N 4 (0 , Σ) , where Σ is de fined as in Section 3.2 , over a range of va lues for r and b . Gi ven simulated data, we estimate the value s of ρ 1 , ρ 2 , and ρ c and compute the approp riate test statist ics, as de scribed in Section 4.1 , and ev alu ate the power of t he tests under the descri bed fi ve sets of hypoth eses. Fo r Scenario 3, we approximat e p-v alues using a simpli fied vers ion of the rhomb us formula, the so-called W -formula, deri v ed by Efron ( 1997 ) and fitted for k = 2 : Pr(max( z 1 ( i, j ) , z 2 ( i, j )) > c ) ≈ ¯ Φ( c ) + φ ( c ) φ ( cL/ 2) − 0 . 5 c/ 2 , (18) where L = arccos( cor r ( z 1 ( i, j ) , z 2 ( i, j ))) and c is an ob served val ue of the max- imum of test statistics z 1 ( i, j ) and z 2 ( i, j ) , with ¯ Φ and φ denotin g the comple- mentary cumulat iv e distrib ution f unction and the densi ty function of the stand ard normal, respec tiv ely . Analog ously , for Scenar io 4, we hav e: Pr(min( z 1 ( i, j ) , z 2 ( i, j )) > ˜ c ) ≈ ¯ Φ( ˜ c ) − φ ( ˜ c ) φ (˜ cL / 2) − 0 . 5 ˜ c/ 2 , (19) 16 KA T ENKA AND K OLACZYK where ˜ c is an observe d value o f the maximum of test sta tistics z 1 ( i, j ) and z 2 ( i, j ) . Note tha t associatio n e xists (i.e., there is an edge present) unde r all fiv e m easure s of similarity . The resu lts of the simulati ons are depicted in Figure 4 . The top panel of Fig- ure 4 sho ws po wer as a function of r and b fo r canonical correlation only . Reca ll that r is the correla tion between attrib utes for a giv en ver tex (i.e., within-v ertex correla tion), w hile b is the co rrelation between attri but es acro ss two vertices (i.e., between- verte x correlation ). F rom the top pan el in the figure it is cle ar tha t, while po wer in creases as the within -verte x corre lation r increa ses, for a fixe d v alue of r e ven a small amount of between-v erte x correla tion b is suf ficient to greatly increase po wer . No w consider the left and right panels of Figure 4 , in which we present the power for all fiv e described scenarios as a function of r (where b = 0 . 2 r ) and as a function of b (where r = 0 . 2 b ). The power curv es for detecting the edge when using either the first or second attrib ute al one indicate w hat m ay be achi ev ed with only partia l informat ion, that is, on onl y one a ttrib ute or the other . That the highe r power curve corres ponds to the first attrib ute is natural, gi ven that ρ 1 = 0 . 3 > 0 . 1 = ρ 2 . More in teresting ly , we see th at amo ng the three sce narios under which inf ormation on bo th attrib utes is use d, only that ba sed on can onical correla tion o f attrib utes is capabl e of e xceedin g the po wer usin g the first att ribu te alone. More specifically , the left p anel sho ws the situa tion w here th e within-ve rtex correlati on r v aries fr om − 1 to 1 , but at the same time cross-corr elation between two nodes stays relativ ely small, in a range of ( − 0 . 2 , 0 . 2) . In this case, the effect of the cor relation based on the first attr ibu te on the power of link detecti on is reduced, and hence the p ower of the test for canonic al cor relation decreases. In contrast, when the cross-co rrelation between two nodes b gro ws more rapidly than correlatio n r , the po wer of the test for canon ical corre lation increases similarly rapidly and quickly achie ves a maximum of 1 . 0 . Thus, by means of this small, illustr ativ e simulation study , w e were able to pro- vide qualitati v e explanat ion of the rela tionship between the po wer for detecting an edge un der the fi ve diff erent scenario s and, in pa rticular , gain some ins ight into the way in which di fferi ng ex tents to which information on multiple attrib utes is used can af fect the power . 5. Infer ence and C haracter ization of a Gene-Protein Network. In this sec - tion, we turn our atten tion to th e gene /protein regul atory network applicatio n in- troduc ed in Secti on 2 . W e ana lyze a subset of the NCI-60 databas e that c ontains 92 protein pro files and gene express ions for approximate ly 9 , 000 genes. Note that the problem of combining multiple types of biolo gical profiles is nontri vial. W e adopt the procedu re descr ibed in Shanka v aram et al. ( 2007 ) to construct a so-called MUL TI-A TTRIBUTE NETWORKS 17 r b Power −1 −0.5 0 0.5 1 −1 −0.5 0 0.5 1 0 0.2 0.4 0.6 0.8 1 −1 −0.5 0 0.5 1 0 0.2 0.4 0.6 0.8 1 r Power cancorr attrib. 1 attrib. 2 max min −1 −0.5 0 0.5 1 0 0.2 0.4 0.6 0.8 1 b Power cancorr attrib. 1 attrib. 2 max min F I G 4 . T op panel shows power for canonical corr elation only (scenario (5)); lef t and right panels pr esent the power f or all five described scenarios as a function of r (wher e b = 0 . 2 r ) and as a function of b (where r = 0 . 2 b ). ‘conce nsus’ data set co mprised of 91 prote in profiles and 9 1 gene profiles matche d in corre sponding pairs by their common gene/protei n Entrez identifiers. In this manner w e obtain a set of bi v ariate measure ments on the expr ession for each 91 genes/ proteins ac ross 60 cancer cells. 5.1. Network Infer ence and Characte rization. W e inferred th ree types of net- works : a network of associated protei ns, based on similarity of protein e xpressio n profiles alo ne; a network of associated genes, base d on similarity of gene expres - sion pro files alone; and a sing le gene/prot ein netw ork, based on both type s of e x- pressi on profiles . W e used the methods of hypoth esis test ing describe d in Section 4 , with an FDR c ontrol le vel of γ = 0 . 05 . Note that since we fou nd (using fo rmal hy- pothes is testing) that netwo rk homogene ity is not support ed for all pai rs of nodes in the gene- protein network, the simplified homogeneou s co v ariance structure dis- cussed in parts of Section 3 is not assumed here. Before discussing the full netwo rks we obtained, cons ider the small illu strati ve exa mple introduc ed in Section 2 , i n v olving the three pro teins (Annexin A1, An- 18 KA T ENKA AND K OLACZYK nex in A2, and K eratin 8) and their three correspon ding gen es (ANXA1, A NXA2, and KR T8). Figure 5 sho ws these subnetwork s, no w annot ated with the val ues of their estimated correlat ions and, in the case of the gene/p rotein n etwork, the canoni- cal w eights as wel l. As one can easily observ e, th e protein and gene networks diffe r in the v alues of th eir (marg inal) correlation s and, conse quently , in thei r structure. For e xample, the co rrelation between protein s Annexin 1 and Kera tin 8 is ne ga- ti ve, − 0 . 18 , but, nev ertheles s, suffici ent to produc e an edge in the netwo rk; the correla tion between the correspond ing g enes AN XA1 and KR T8 is positi ve, 0 . 03 , b ut insu fficien t to decl are an edge. At the same time, the absolu te va lue of the canon ical correlat ion, based on the combined expres sion pro files, is equa l to 0 . 2 . Furthermor e, exa mining the canonic al weights on this edg e, we see that 93% o f the c anonical corre lation can be e xplained b y pro tein-le vel informati on, while only 7% is explaine d by gene-le vel information . F I G 5 . Inferr ed association network based on pro tein pr ofiles (lef t panel), gene expr essio ns (middle panel), and gene and pr otein pr ofiles combined (right panel). Numbers in boxes r epr esen t unique Entr ez IDs; numbers on edges rep r esent estimated corr elations and, f or gene -pr otein network (right panel), and corr espond ing canonical weights. Dashed lines indicate absent edges. Annexin A1 (301) Keratin 8 (3856) Annexin A2 (302) −0.18 0.29 0.47 ANXA1 (301) KRT8 (3856) ANXA2 (302) 0.03 0.24 0.31 301 3856 302 0.2 w 2 g =0.3 0.51 0.39 w 2 p =0.93 w 2 p =0.7 w 2 g =0.07 w 2 g =0.39 w 2 p =0.61 This e xample is sugges tiv e in two ways. First is th at dif ferent molecular p rofiles can pro duce differ ent networks; and seco nd is that the net work infer red from com- bined molecu lar profiles via ca nonical correlation can ef fecti vely summarize the combine d cont ribu tions of the two t ypes of measurements. No w consider the n etworks comprised of the full s et of 91 no des. T able 1 reports the number of edges declared for each netwo rk, and the correspo nding network densit ies, while T able 2 summarizes the extent to w hich edges are shared between netwo rks, through both the Jaccard similarities and the raw coun ts. W e see that the ge ne-protei n network has the lar gest nu mber of edges (7 91), with a dens ity of almost 0 . 20 , while the protein and gene ne tworks hav e noticeab ly fe wer e dges (426 and 240, respe ctiv ely), with densities roughly half and a qua rter t hat of the gene- protei n network. Further more, the gene- protein network shares ov er 40% of its edges (329) with the pro tein netwo rk, b ut on ly about 25% with the gen e netw ork. In contrast, the protein and gene netwo rks themselv es share compara tiv ely few edges (5 2). Most int erestingl y , the gene-protei n network con tains 309 edg es that MUL TI-A TTRIBUTE NETWORKS 19 are uniq ue and belong to neither the pro tein nor the gene network s. The presenc e of such ed ges indicates both high correlation of betwee n gen e and protein profiles for the same node and/or high cross-co rrelation of gene and prote in profiles for distin ct nod es. protein network gene netwo rk gene-protein network Nodes( N v ) 91 91 91 Edges( N e ) 42 6 240 791 Density 0.10 0.06 0.19 LCC 90 80 91 A vg Correlati on( ˆ ρ ) 0.26 0.18 0.53 A vg Degree ( ¯ d ) 9.36 5.27 17.38 A vg Cl ustering 0.36 0.31 0.39 A vg Betweenness 0.034 0.041 0.022 T A B L E 1 Summary statistics for pr otein, gene , and gene-pr otein networks: number of nodes, number of edges , density , size o f the larg est connected component (L CC), aver ag e nonzer o corr elation, de gr ee, clustering coeffi cient, and (normalized) betweenness centrality . protein network gene network gene-protein network Protein Network 1 .0 (426) 0.09(52) 0.37(329) Gene Network 1.0 (240) 0.25(205) Gene-Protein Network 1.0 (791) T A B L E 2 J accar d similariti es (numbe r of shar ed edges) between gene , pro tein, and gene-pr otein networks. Also shown in T able 1 are other standard summar ies of ne twork s tructure, in- cludin g the size of the lar gest connected component and the a verage degree, cluster - ing coe fficien t, and betweenne ss centrality . W e r efer the read er to K olaczyk ( 200 9 , Chap. 4) for definition s. W e se e that o nly the ge ne-protein network is fully con- nected . In addition, the a verage degre e of nodes in the gene -protein network is nearly twice that in th e protein netw ork and over three times tha t in the ge ne net- work. Furthermore, while the protein and gene-prote in network s display similar le vels of clust ering (i.e., proportions of triads closing to form triang les), th e gene netwo rk sho ws somewha t less. O n the other hand, all thre e net works show similar le vels of be tweenness cen trality . Particul arly inte resting, ho we ver , is the fa ct tha t the ge ne-protei n netw ork sho ws some evide nce for a bimodal degr ee distrib ution , sugge sting tha t there are potential ly tw o classes of nodes in the netw ork. Note that the spikes at zero in the histograms of degr ee, cluster ing, and betweenness for the gene network are due to isolat ed nodes. 20 KA T ENKA AND K OLACZYK F I G 6 . Distribu tion of de gr ee (top row), clustering coef ficient (middle r ow), and (normalized) be- tweenness centrality ( bottom row), for the pr otein (lef t column), gene ( middle column), and gene- pr otein (right column) networks. 0 10 20 30 40 0 0.1 0.2 0.3 0.4 0.5 node degree protein network 0 10 20 30 40 0 0.1 0.2 0.3 0.4 0.5 node degree gene network 0 10 20 30 40 0 0.1 0.2 0.3 0.4 0.5 node degree gene−protein network 0 0.2 0.4 0.6 0.8 1 0 0.1 0.2 0.3 0.4 0.5 clustering coefficient protein network 0 0.2 0.4 0.6 0.8 1 0 0.1 0.2 0.3 0.4 0.5 clustering coefficient gene network 0 0.2 0.4 0.6 0.8 1 0 0.1 0.2 0.3 0.4 0.5 clustering coefficient gene−protein network 0 0.05 0.1 0.15 0.2 0 0.1 0.2 0.3 0.4 0.5 betweenness centrality protein network 0 0.05 0.1 0.15 0.2 0 0.1 0.2 0.3 0.4 0.5 betweenness cetrality gene network 0 0.05 0.1 0.15 0.2 0 0.1 0.2 0.3 0.4 0.5 betweenness centrality gene−protein network 5.2. Edge and N ode Classifi cation. W e now focus on analy sis of the gene- protei n networ k alon e, with the specific go al of better understand ing the con trib u- tion of the two node attrib utes (i.e., gene expr ession and protein profile) to the edges incide nt to each node. W e sepa rate edges/node s in to three separate classes using a simple classification heurist ic based on the canonical weights. Alternat iv ely , we also trie d using more sophistica ted methods o f ’community de tection’ bu t found that the results obtain ed were su bstantial ly less interpret able. In our analy sis, for each pai r of nodes with a declared edges, we take the vect or of cano nical w eights , say w p and w g , corre sponding to protein and gene attr ibu tes, respec tiv ely , and standardi zed them to ha ve unit le ngth. A plot of the v alue s w 2 p , ov er all edges , is shown in Figure 7 . The distrib ution shows two clear peaks at the far left and rig ht ex tremes, co rrespond ing to w 2 p close to zero and one, respec- ti vely . The re mainder of th e distrib uti on between the two pe aks is rela tiv ely flat. These observ ations sugg est separati ng edges into thr ee cla sses, throu gh the use of a thr eshold, say T ∈ (0 , 1) , with edges for which 0 ≤ w 2 p ≤ T described as mainly gene-i nfluenced, edges for which 1 − T ≤ w 2 p ≤ 1 , as mainly pro tein-influen ced, MUL TI-A TTRIBUTE NETWORKS 21 and the r est as being of mixed type . By exten sion, we then simila rly classify nodes accord ing to the majority class of its incident edges. F I G 7 . Distribution of the canon ical weights (squar ed) corr esponding to gene-pr otein network. 0 0.1 0.2 0.3 0.4 0.5 0.6 0.7 0.8 0.9 1 0 50 100 150 200 250 300 350 400 w p 2 Edge Frequency (times 2) Mainly Protein Influence Mainly Gene Influence T (1−T) 1 2 3 Figure 8 pro vides a visual i llustratio n of the same proce ss of n ode classi fication, for the choices of threshold T = 0 . 1 , 0 . 25 , and 0 . 4 . For each node the propor - tions p g ene , p pr otein , and p mixed incide nt edg es were computed. Because the sum of the se proporti ons is on e, the nod es may be c on ve niently displaye d in the unit simple x. Nodes that are close to the botto m left corner hav e a lar ge proportio n of gen e edges, while th ose that a re close to the bottom rig ht corner ha ve a lar ge propo rtion of protei n edges. Mix ed nod es tend to be loca ted near th e top corner . Therefore , the locati on of each node is an indication of the contrib ution of each of the tw o attrib utes to its conn ecti vity in the gene-p rotein network. Based on visua l inspec tion of F igures 7 and 8 , we chose a th reshold of T = 0 . 25 as most reasonable and use that in the remainder of our analys is, desc ribed belo w . −1 −0.5 0 0.5 1 0 0.2 0.4 0.6 0.8 1 −p 1 +p 3 p 2 T=0.1 −1 −0.5 0 0.5 1 0 0.2 0.4 0.6 0.8 1 −p 1 +p 3 p 2 T=0.25 Gene Type Protein Type Mixed Type −1 −0.5 0 0.5 1 0 0.2 0.4 0.6 0.8 1 −p 1 +p 3 p 2 T=0.4 F I G 8 . Node classification, accor ding to prop ortion of gene / pr otein influence on incident edge s. Note that the abov e-descri bed approach f or cla ssifying n odes can be e xtended in a natural manne r when th ere are K > 2 attrib utes. First, o ne sepa rates edges/n odes 22 KA T ENKA AND K OLACZYK into K + 1 separate classes using the can onical weights. Specificall y , fo r each pair of no des with a declared edge, th e vector of canoni cal weights w 1 , w 2 , . . . , w K , corres ponding to each of the K attr ibu tes, are standardize d and the m aximum of the corres ponding squared v alues is noted, say w 2 l . Thro ugh the use of a threshol d T ∈ (0 , 1) , an edge is characteri zed as mainly influenced by this attribu te l if 1 − T ≤ w 2 l ≤ 1 ; otherwise the edge is characterized as bei ng of mix ed type. A node ca n then be cla ssified accord ing to the maj ority cl ass of its incident ed ges via the use of a multidimens ional analogu e of our triangular s trategy . In particular , for eac h no de, propo rtions { p attr l } and p mixed need to be computed and then analyze d on the multidimen sional u nit simplex. Note that nodes in ’bottom’ corners will corresp ond to groups of nodes mos tly ef fect ed by a si ngle att ribu te, while all mixed-typ e nodes will be concen trated ne ar the ’top’ corner . 5.3. Biolo gical Inter pr etation. O ur classification analy sis provide s an ability to suggest a pri mary ’ role’ in which each node p articipate s in the biology un der - lying ou r measur ements, that is, either at the le vel of gene expressio n, protein e x- pressi on, or both. In order to ass ess the e xtent to w hich such assignments may be biolog ically meaning ful, we perfo rm an enrich ment analysis of our three classes of gen es/protei ns again st the biochemical pathwa ys in the Kyoto Encyclope dia of Genes and Genomes (KEGG) pathways ( Kanehisa et al. , 2004 ). That is, we id en- tify those cases in which our classes contain significan t overla p with parti cular collec tions of genes related by their common participatio n in v arious specific bio- chemical processe s and, through our understa nding of those processes, offer an interp retation of th e assignments produced by our classificatio n. A preliminary compariso n of ou r 91 network node s with K EGG rev ealed that only 68 of the correspo nding genes w ere containe d in at least one of the 148 KE GG pathw ays. More specifica lly , 15 protein nodes , 18 gene node s, and 35 m ixed nodes were represe nted in KEGG. See the Appendix, T a ble 7.1 . According ly , our en- richment analysis is restri cted to this subset of no des. For each path way and each class, w e performed a standard hy per- geometric test (i .e., a so-called te st for en- richment in the compu tational biology lite rature) of indep endence for alloca tion of the g enes in that class between the, say , M gene s in th e pathw ay and the r emaining 5017 − M K EGG genes out side that pathway . A class is said to be ’enriched ’ for a giv en pathway if the nul l hyp othesis is rejected. T o adjust for multiplicity due to the lar ge nu mber of KEGG path ways, w e again use the Benjamini and Hochbe rg ( 1995 ) false disco very rate (FD R) control procedu re and set γ = 0 . 05 . Note that prior to conduct ing our tests, we exclude d from the anal ysis all KEGG pathw ays related to an y type of cancer or any other dis ease, in general, restricting ou r focu s to only those pathway s in v olved with more specific biologica l functio ns. In examinin g our results, we find that the protein nodes are enriched for 14 MUL TI-A TTRIBUTE NETWORKS 23 pathw ays, the gene nodes are enriched for one pat hway , a nd the mixed nod es are enrich ed for 37 pathways. See the Appendix, T able 4 . The pathwa ys for which the protein nodes are enriched are almost all in vo lved with signaling acti vity (e.g., J A K-ST A T -SIGN ALING , INSULIN-SIGNALING, GNRH-SIGNALING), for which we can e xpect to see co ordinated acti vity at the le vel of p rotein expre ssion. T he pathw ay for which the gene nodes are enriched is called MISMA TC H REP AIR, which r efers to the process whereb y mismatche s that may o ccur du ring DN A repli- cation and recombinati on are repaired. T his pathway also is among the 14 pathways enrich ed by our protein nodes. Howe ver , it makes sense that w e would see enrich- ment as well with nodes associated primarily at the le v el of gene expre ssion, due to the intimate connection b etween r eplication a nd gene tra nscriptio n/translation. Finally , we note that the se t of nodes classified as bein g of mixed stat us are en- riched for 2 4 KEGG pat hways. These in clude MISMA TCH REP AIR and 12 of the other pathw ays with which the protein nodes were enrich ed, b ut also inclu de, for exa mple, v arious metabolic pathways (e.g., RIBO FLA VIN-MET ABOLISM), thus seeming to confirm the appropr iateness of the la bel ’mixed’. 6. Concluding Remarks. In this paper , we propose d to use canonical corre- lation to incorpora te multiple node attrib utes and measure a total similar ity be- tween nodes pairs in associa tion netw orks. U sing es timated canonical weights, we assess ed the importance of in div idual node attrib utes and e xamined both an alyti- cally an d numeric ally the impact of part ial informatio n (i.e., measure ments of on ly some, but n ot all , attrib utes ) on th e abil ity to d etect an edge be tween two nodes. More general ly , we also ex amined the impact of attrib ute selection on higher -le vel netwo rk summary statistics, such as de gree distrib ution, and bet weenness cent ral- ity . For the speci al cas e o f a network with two attrib utes collected for each node, we proposed a simple heuristic to characte rize netw ork edges and g roup nodes with respec t to the influence of each attrib ute. W e ev aluate d the prop osed fra mewo rk in the cont ext of gene/protein regula tory networks in human cancer cells , and found that a networ k based on co mbined protein p rofiles and gen e expres sions appears to be a consid erably more rich summary of inf ormation than one de fined on only a single molecula r profile alone. Our work was de velop ed with an assumptio n of continuou s measu rements. While in pr inciple it is tru e that often cate gorical measur ements can b e transf ormed to th e contin uous case in a useful manner , a more satisfyin g solution would be an exten- sion of our work based on log-linear models. Previo us work on modeling m ultiple sociomet ric relation s (e.g., Fienber g, Meyer and W asserman ( 1985 )) sho uld be in - structi v e here. As noted earl ier , topology inference in associat ion network s typica lly is done using eith er hypothe sis testing or re gressio n m ethod s ( K olaczyk , 2009 , Chap. 7.3). 24 KA T ENKA AND K OLACZYK A regressi on-based analo gue of the work presented here would be welcome. Such an approach wo uld presumably e xploit the connection between cano nical correla - tion and multiple re gressio n. B ut giv en th e larg e number of v ariables enteri ng such a regress ion (e.g., one for each node being consid ered as a neigh bor for a fixed node of interes t), some ap propriate form of penalizati on will be critica l. Last, we mention that while we focused here lar gely on the cas e of just two node attrib utes , the other ext reme, in which the number of attrib utes K is v ery large, is also like ly to be of considerab le interest. In particula r , the re are li kely interes ting conne ctions be tween this case and the current body of work on high-dimensi onal inferen ce and sparsene ss, giv en that in reality a lar ge set of K measured attribu tes does not necessarily mean that any more than a fe w are actually important dr iv ers of associat ion between nodes. Refer ences. B A RT L E T T , M . S . (1941). The Statistical Significance of Canonical Correlati ons. Biometrika 32 29–37. B E N JA M I N I , Y . and H O C H B E R G , Y . (1995). Controlling the False Fiscov ery R ate: a Practical and Powerfu l Approach to Multiple T esting. J ournal Royal Statistical Society Series B 57 289–300. B U T T E , A . J . and K O H A N E , I . S . (2000). Mutual information rele v ance networks: functional ge- nomic clustering using pairwise entrop y measurements. In P ac Symp Biocomput 5 418–4 29. Cite- seer . B U T T E , A . J . , T A M AYO , P . , S L O N I M , D . , G O L U B , T. R . and K O H A N E , I . S . (2000). Di scov ering functional relationsh ips between RN A e xpression an d chemotherape utic susceptibility using re le- v ance ne tworks. Pr oceed ings of the Nationa l Acade my of Sciences of th e United States of America 97 12182. C A R R O L L , C . (2006). C anonical correlati on analysis: Assessing links between multiplex networks. Social Networks 28 310–330 . C H A N G , J . and B L E I , D . M . (2010). Hierarchical relational models for document netwo rks. The Annals of Applied Statistics 4 124-150. D E L A F U E N T E , A . , B I N G , N . , H O E S C H E L E , I . and M E N D E S , P. (2004). Discovery of meaningful associations in genomic d ata using partial correlation co efficients. Bioinformatics 20 3565–357 4. E F R O N , B . (1997). The length heuristic for simultaneous hypothesis tests. Biometrika 84 143–157. E F R O N , B . (2010). Lar ge-Sc ale Infer ence: Em pirical Bayes Method s for Estimati on, T esting, and Pr ediction . Cambridge Univ ersity Press. E R I K S S O N , B . , B A R F O R D , P . , N O W A K , R . and C R OV E L L A , M . (2007). Learning Network St ruc- ture from Passi ve Measurements. In Pro ceedings of the ACM/SIGCOMM Internet Measur ement Confer ence 209–214. F A I T H , J . J . , H AYE T E , B . , T H A D E N , J . T., M O G N O , I . , W I E R Z B O W S K I , J . , C O T TA R E L , G . , K A S I F , S . , C O L L I N S , J . J . and G A R D N E R , T. S . (2007). Large-scale mappin g and validation of Escherichia coli transcriptional regulation from a compendium of expression profiles. PLoS biology 5 e8. F I E N B E R G , S . E . , M E Y E R , M . M . and W AS S E R M A N , S . S . (1985). Statistical An alysis of Multiple Sociometric Relations. Jou rnal of t he American Statistical Association 80 51– 67. G A R D N E R , T. S . and F A I T H , J . J . (2005). Reverse-en gineering transcription control networks. Physics of Life Reviews 2 65–88. G O L D E N B E R G , A . , Z H E N G , A . X . , F I E N B E R G , S . E . and A I R O L D I , E . M . (201 0). A Survey of Statistical Network Models. F ound. T r end s Mach. Learn. 2 129–233 . MUL TI-A TTRIBUTE NETWORKS 25 H O T E L L I N G , H . (1936). Relati on Between T wo Sets of V ariates. Biometrika 28 321–377. K A N E H I S A , M . , G O T O , S . , K AW A S H I M A , S . , O K U N O , Y . and H AT T O R I , M . (2004). T he KE GG resource for deciphering the genome. Nucleic Acids Resear ch 32 D277–2 80. K O L A C Z Y K , E . D . (20 09). S tatistical Analysis of Network Data: Methods and Models . Springer Publishing Company , Incorporated. L E E , W. - P . and T Z O U , W. - S . (2009). Computational methods for discove ring gene networks from express ion data. Bri efings in Bioinformatics 10 408–4 23. L E E , I . , D AT E , S . V ., A D A I , A . T. and M A R C O T T E , E . M . (2004). A Probabilistic Functional Network of Y east Genes. Science 306 1555– 1558. L I , Q . , Z H E N G , G . , L I , Z . and Y U , K . (20 08). Efficient approximation of P-value of the maximum of correlated tests, with applications to genome-wide assoc iation studies. Ann als of Human Genetics 72 397–406. M Y E R S , C . L . , R O B S O N , D . , W I B L E , A . , H I B B S , M . A . , C H I R I A C , C . , T H E E S F E L D , C . L . , D O L I N S K I , K . and T R OYA N S K AY A , O . G . (20 05). Discov ery of biological netw orks from di- verse func tional genomic data. Genome Bi ol 6: R114 . N AY L O R , M . G . , L I N , X . , W E I S S , S . T. , R A B Y , B . A . and L A N G E , C . (2010). Using Canonical Correlation Analysis to Discov er Genetic Regulatory V ari ants. PLoS ONE 5 e1039 5. P A L , A . (2011). Loca lization Algorithms in Wireless Sensor Netwo rks: Current Approa ches and Future Challenges. Network Pr otocols and Algorithms 2 . P E R R Y , P . O . and W O L F E , P. J . ( 2011). Point process mode ling for directed i nteraction netwo rks. S A M P S O N , S . (1969). Cri sis in a Cloister. PhD dissertation, Cornell Uni versity . S H A N K A V A R A M , U . . , R E I N H O L D , W., N I S H I Z U K A , S . , M A J O R , S . , M O R I TA , D . , C H A RY , K . K . , R E I M E R S , M. A . , S C H E R F , U . , K A H N , A . , D O L G I N O W , D . , C O S S M A N , J . , K A L D J I A N , E . , S C U D I E R O , D . , P E T R I C O I N , E . , L I O T TA , L . , L E E , J . and W E I N S T E I N , J . (200 7). T ranscript and protein expression profiles of the NCI-60 cancer cell panel: an integromic microarray study. Molecular Cancer Therapeutics 6 820-83 2. S H I P L E Y , B . (2002). Cause and Corr elation in Biology: A User’ s Guide to P ath Analysis, Structur al Equations and Causal Infer ence , 1 ed. Cambridge Univ ersity Press. S T E U E R , R . , K U RT H S , J . , F I E H N , O . and W E C K W E RT H , W . (2003). Observing and interpreting correlations in metabolomic networks. Bioinformatics 19 1019 -1026. W A A I J E N B O R G , S . , V E R S E L E W E L D E W I T T H A M E R , P . C . and Z W I N D E R M A N , A . H . (2008). Quantifying the Association between G ene Expressions and DN A-Markers by Penalized Canon- ical Correlation Analy sis. Statistical Applications in Genetics and Molecular Biology 7 Art icle 3. Y A M A N I S H I , Y ., V E RT , J . P ., N A K AY A , A . and K A N E H I S A , M . (2003). Extraction of correlated gene clusters from multiple genomic data by generalized kernel canonical correlation analysis. Bioinformatics 19 i323–i330. 7. Appendices. 7.1. Biolo gical Inter pr etation T ables. Our cl assification analy sis prov ides an ability to sug gest a primary ’ role’ in whic h each node participa tes in the biolo gy underl ying our measu rements. 7.2. Pr opo sition Pr oof. Here we sho w that i f the assumpti on of equal marg inal cov aria nce matrices ( Σ ii = Σ j j = Σ m ) and symmetrical cros s-cov arian ce matrix ( Σ ij = Σ j i = Σ c ) for tw o nodes i and j are satisfied, then optimizat ion p roblem 26 KA T ENKA AND K OLACZYK ( 6 ) can be simplified to: (20) ρ c ( i, j ) = max w ∈ R | C | w T Σ c w w T Σ m w , and only one set of weights for each edge e ( i, j ) is required. T o proof that, we first observe that solution to the problem is not af fected by rescalin g w i or w j either in dependen tly or togeth er , that is, if replacin g w i by αw i and w j by β w j , canon ical co rrelation ρ ( i, j ) would not change: ρ c ( i, j ) = max w i ,w j ∈ αw T i Σ c β w j q αw T i Σ m αw i q β w T j Σ m β w j = max w i ,w j w T i Σ c w j q w T i Σ m w i q w T j Σ m w j , for all α, β ∈ R. Therefore , the can onical optimization problem ( 6 ) is equi v alent to: max w i ,w j w T i Σ c w j , subject to (21) w T i Σ m w i = 1 , w ′ j Σ m w j = 1 . Applying the method of Lagrang e multipliers , w e construct a m aximizati on crite- rion as L ( λ i , λ j , w i , w j ) = w T i Σ c w j − λ i 2 ( w T i Σ m w i − 1) − λ j 2 ( w T j Σ m w j − 1) . Nodes Protein T ype Gene T yp e Mixed T ype Contained in KEGG CDH1, CDK4, CDK5, CDK7, FN1, GRB2, MSH6, GTF2B, HRAS, I RS1, J AK1, S T A T1, ST A T6, IRF9, RN ASEH2A A CVR2A, F ASL G, CDH3, CDK6, ERBB2, MCM7, CD46, MLH1, MSH2, MSN, NCAM1, PRKCH, PRKCI, MAP2K2, TGFB1I1, V ASP , RIPK1, EXOC4 P ARP1, C ASP7, CCNA2, CCNB1, CDH2, CDKN2A, AP2M1, CRK, CTNNB1, CTT N, EP300, XR CC6, GSK3B, GSTP1, HSP A4, HSPD1, NME1, PCN A, PGR, PRKCA, P RKCB, MAPK1, MAP2K1,PTPN6, P TPN11, RB1, REL A, ST A T3, ST A T5A, TP53, TUBB2A, TYR, EZR, RADD, F ADD NO T con- tained in KEGG ANXA4, CDC2, KR T8, MGMT , ADNP ANXA1, ANXA2, KLK3, CASP2, DSG1, ESR1, KR T7, KR T19, AKAP5, AKAP8 KR T18, MCC, P RSS8, A TXN2, SMARCB1, VIL1, MVP , KR T20 T A B L E 3 Pr eliminary comparison of 91 network nodes with KEGG r evealed only 68 contained in at least one of the 148 K EGG pathways: 15 pr otein nodes, 18 gene nodes, and 35 mixed nodes. MUL TI-A TTRIBUTE NETWORKS 27 KEGG Pathwa y Gene T yp e P rotein T ype Mixed T ype MISMA TC H-REP AIR X X X J AK-ST A T -SIGNALING-P A THW A Y X X T -CELL-R ECEPTOR-SIGNALING-P A T HW A Y X X NEUR OTR OPHIN-SIGN ALING-P A THW A Y X X INSULIN-SIGNALING-P A THW A Y X X B-CELL-RE CEPTOR-SIGNALING-P A THW A Y X X FC-EPSI LON-RI-SIGNALING-P A T HW A Y X X CHEMOKINE-SIGNALING-P A T HW A Y X X ERBB-SIGNALING-P A T HW A Y X X GAP-JUNCTION X X DORSO-VENTRAL -AXIS-FORMA TION X X FOCAL-ADHES ION X X GNRH-SIGNALING-P A THW A Y X X DN A-REPLIC A T ION X TIGHT -JUNCTION X MELANOGENESIS X CELL-CYCLE X LONG-TERM-POTENTIA T ION X PR OGEST ER ONE-MEDIA TED-OOCYTE -MA T URA T ION X APOPTOSIS X N A TURAL-KILLER- CELL-MEDIA TED-CYTOT O XICITY X FC-GAMMA-R-MEDIA TED-PHAGOCYT OSIS X WNT -SIGNALING-P A THW A Y X ADIPOCYTOKINE-SIGNALING-P A T HW A Y X LEUKOCYTE-TRANSENDOTHELIAL-MIGRA T ION X ADHERENS-JUNCT ION X VEGF-SIGNALING-P A T HW A Y X ALDOSTERONE-REGULA TED-SODIUM-REABSO RPTION X MAPK-SIGNALING-P A THW A Y X TOLL-LIKE-RECE PTOR-SIGN ALING-P A THW A Y X OOCYTE-MEIOSIS X V ASCULAR-SMOOTH-MUSCLE-CONTRA CTION X P53-SIGN ALING-P A THW A Y X RIG-I-LIKE-RE CEPTOR-SIGNALING-P A THW A Y X B ASE-EXCI SION-REP AIR X NON-HOMOLOGOUS-END-JOINING X RIBOFLA VIN-MET A BOLISM X NOD-LIKE-RECE PTOR-SIGN ALING-P A THW A Y X T A B L E 4 Results of enrich ment analysis: protein type no des are enric hed for 14 pathways, the gene nodes - for one pathway , and the mixed nodes - for 37 pathways. T aking partial deri v ati ves of L ( λ i , λ j , w i , w j ) with respec t to w i and w j , we obta in the follo wing system of equations ( 7 ): Σ c ( i, j ) w j − λ i Σ m ( i ) w i = 0 , Σ T c ( i, j ) w i − λ j Σ m ( j ) w j = 0 . 28 KA T ENKA AND K OLACZYK Multiply ing the first equation by w T i and the second equation by − w T j and adding them togethe r , we h av e − λ i w T i Σ m w i + λ j w T j Σ m w j = 0 , which together with constraints implies λ i = λ j = λ . In this case, w e may reduce the system ( 7 ) to the system Σ c w j = λ 2 i Σ m (Σ − 1 c ) T Σ m w j Σ T c w i = λ 2 i Σ m Σ − 1 c Σ m ( i ) w i , or assuming Σ m = Σ m and Σ T c = Σ c : Σ c w j = λ 2 i Σ m Σ − 1 c Σ m w j , and Σ c w i = λ 2 i Σ m Σ − 1 c Σ m w i . The last set of equations shows that w i and w j are both the eigen v ectors of matrix Σ − 1 m Σ c Σ − 1 m Σ c , correspond to the same ei gen v alue λ 2 , and bo th sati sfy cons traints ( 22 ), so that implies w i ≡ w j = w . T hus, eige n v alue problem ( 7 ) is reduced to: Σ − 1 m Σ c w = λ i w. D E PA R T M E N T O F M AT H E M A T I C S A N D S TA T I S T I C S 1 1 1 C U M M I N G T O N S T R E E T , B O S T O N , M A 0 2 2 1 5 E - M A I L : nkatenk a@bu.edu D E PA R T M E N T O F M AT H E M A T I C S A N D S TA T I S T I C S 1 1 1 C U M M I N G T O N S T R E E T , B O S T O N , M A 0 2 2 1 5 E - M A I L : kola czyk@math.b u.edu
Original Paper
Loading high-quality paper...
Comments & Academic Discussion
Loading comments...
Leave a Comment