Rotating Stars and Revolving Planets: Bayesian Exploration of the Pulsating Sky
I describe ongoing work on development of Bayesian methods for exploring periodically varying phenomena in astronomy, addressing two classes of sources: pulsars, and extrasolar planets (exoplanets). For pulsars, the methods aim to detect and measure …
Authors: Thomas J. Loredo
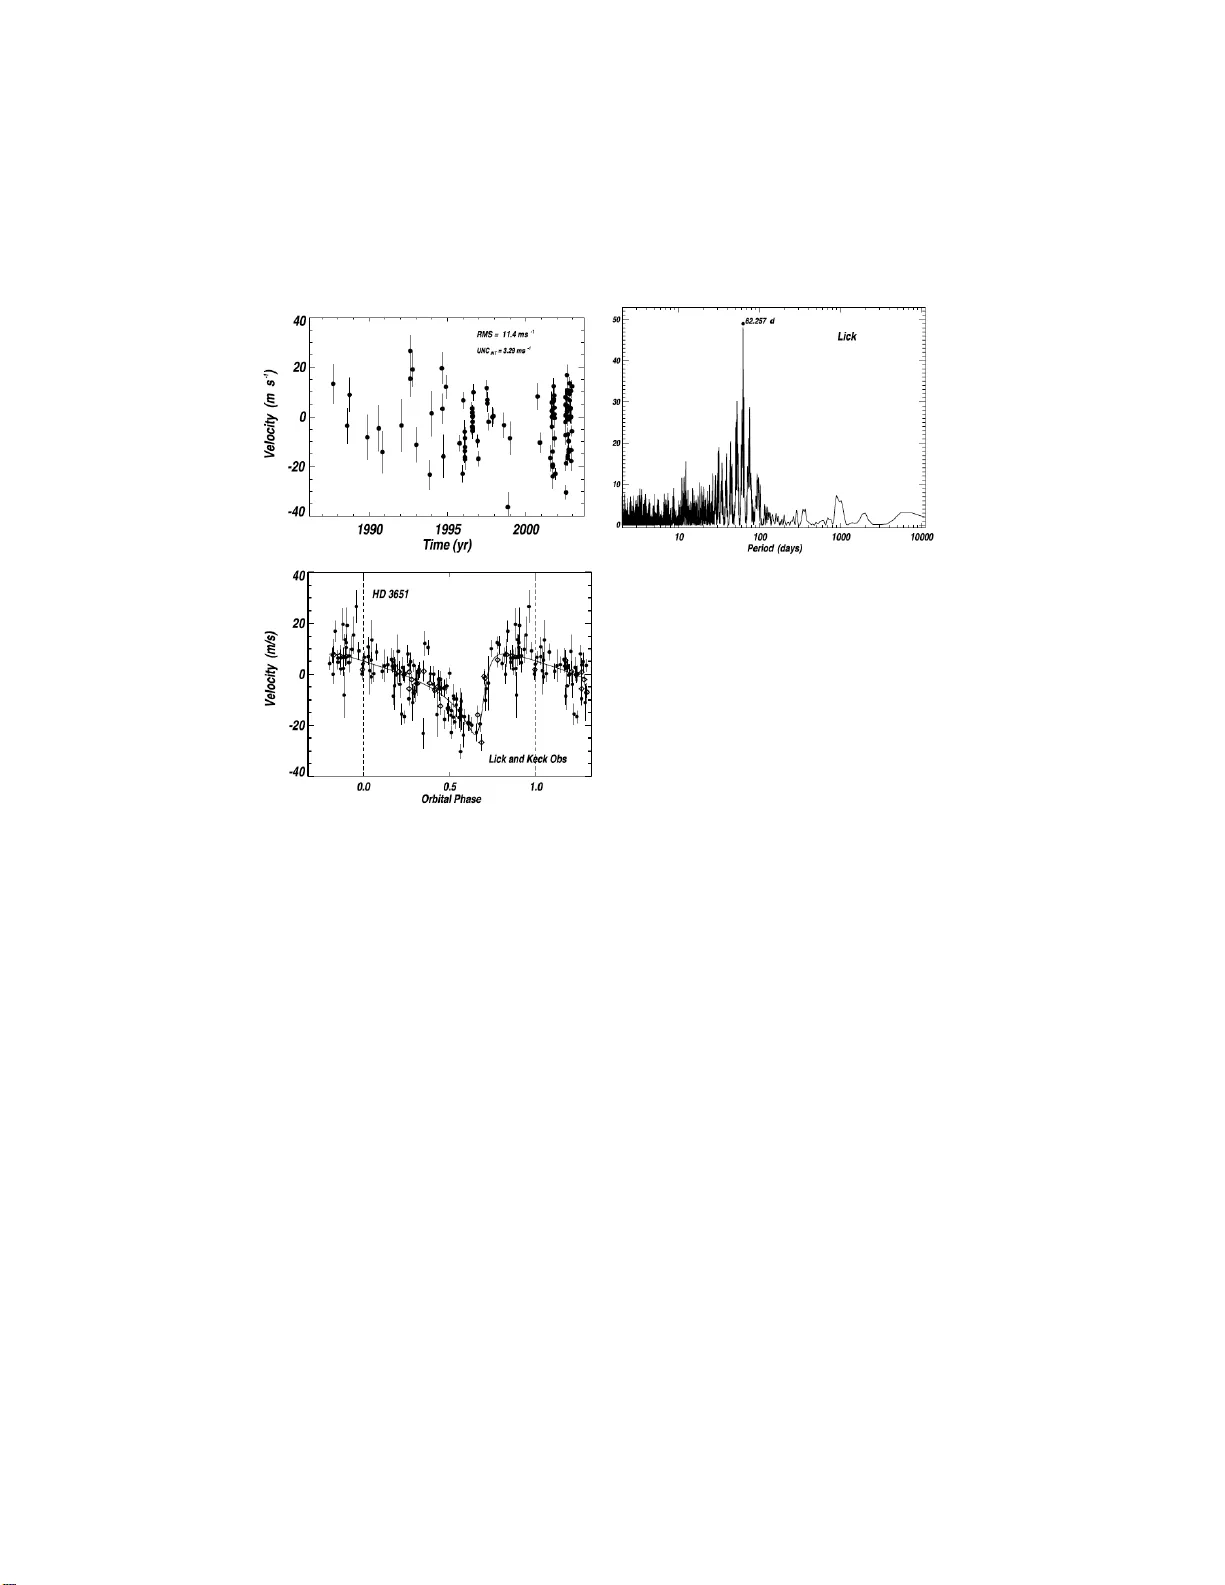
BA YESIAN ST A TISTICS 9, J. M. Bernar do, M. J. Bayarri, J. O. Ber g er, A. P. Dawid, D. He ckerman, A. F. M. Smith and M. West (Eds.) c Oxfor d University Pr ess, 2010 Rotating Sta rs and Revol ving Planets: Ba y esian Explo ration of the Pulsating Sky Thomas J. Loredo Cornel l University, U SA loredo@ast ro.cornell. edu Summar y I describe ongoing wo rk on dev elopmen t of Ba y esian methods for exploring p e- rio dically v arying phenomena in astronom y , addressing t w o classes of sources: pulsars, and extrasolar planets (exoplanets). F or pulsars, the methods aim to detect and measure perio dically v arying signals in data consisting of pho- ton arr iv al times, mo deled as non-homogeneous P oisson p oint pro cesses. F or exoplanets, the metho ds address detect ion and estimation of planetary or bits using observ ations of the reflex motion “w obble” of a host star, including adaptiv e sched uling of observ ations to optimize inf erences. Keywor ds and Phr ases: Time series; Poisson point proces ses; Harmonic anal ysis; Periodograms; Experiment al design; Astr onomy; Pulsars; Extrasolar planets 1. INTRODUCTION In his famous sonnet, “Brig ht Star” (1819), John Keats addresses a star, lamen t in g of the transience of human emotions—and of human life itself—in contrast to the star’s immutabili ty: Brigh t star, w ould I were steadfast as th ou art— Not in lone splendor hung aloft th e nigh t And w atc hing, with eternal lids apart, Like nature’s patient, sleepless Eremite. . . . . . yet still steadfast, still unchangeable. . . Man y decades later, Rob ert F rost alluded to “Keats’ Eremite” in his p o em, “Choose Something Like a Star” (1947). The po et queries a star ( “the fairest one in sigh t”), pleading for a celestial lesson t hat “we can learn/By heart and when alone rep eat.” He finds, W ork rep orted here was funded in part by NASA gran ts NAG 5-1758 and NNX09AK60G, b y NASA’s Sp ac e Interfe r ometry M ission , and by NSF grants AST- 0507254 and AST- 0507589. 2 T. J. L or e do It giv es us strangely little aid, But does tell something in the end. . . It asks of us a certain heigh t, So when at times the mob is sw ayed T o carry praise or blame to o far, W e may choose something like a star T o stay our mind s on and be staid. Both p o ets inv oke a millenia-lo ng, cross-cultural tradition of fin ding in the “fix ed stars” a symbol of constancy; sometimes cold, sometimes comforting. But these p o- ems of Keats and F rost b ookmark a p erio d of enormous change in our understand in g of cosmic v ariability . Already by Keats’s time—marked b y the d isco very of in visible infrared and ul- tra violet ligh t in the S un’s sp ectrum (b y Hersc hel, 1800 , and Ritter, 180 1), and by the dawn of stellar sp ectroscop y (F raunhofer, 1823)—astronomers were discov er- ing that there was quite literally “more than meets the eye” in starligh t. Later in the 19th century , long-exp osure astrophotography exten ded the reac h of telescop es and sp ectroscop es to ever dimmer and farther ob jects, and pro vided reprod u cibly precise records that enab led tracking of prop erties o ver time. In t he 20th cen tury , adv ances in op t ics and new detector technologies extended astronomers’ “vision” t o w a velengths and frequencies much furth er b eyond the narro w range accessible to the retina. By mid- century , some of these tools became capable of short-time-scale measuremen ts. Simultaneous with these tec hnological developmen ts w ere theoretical insigh ts, most imp ortantly from nuclear physics, that unveil ed the p rocesses p ow - ering stars, pro cesses with finite lifetimes, p redicting stellar evolution and death, including the formation of compact, dense stellar remnants. By th e time of F rost’s death (1963), astronomers had come to see stars as ev er- changi ng things, not only on the inhumanly long billion-year time scales of stellar evol ution, but even ov er humanly accessible p erio ds of years, months, and d ays. Within just a decade of F rost’s death, the disco veries of pu lsars, X-ray transients, and gamma-ray b ursts reveal ed that solar-mass-scal e ob jects were capable of pulsing or flashing on timescales as small as mil l ise c onds . W e now know that the “fix ed ” stars visible to the naked eye represent a highly biased cross-sectional sample of an ev olving popu lation of great heterogeneity . The more complete astronomica l census made p ossible b y m o dern astronomical instru- mentatio n revea ls the heav ens to b e as m uch a place of d ramatic—sometimes v iolent— change as a harb or of steady luminance. The same instrumentation also reveals subtle but significan t change even among some of the visible “fixed” stars. Here I wil l point a Ba yesian statistical telescope of sorts at one particular area of modern time-d omain astronomy: perio dic va riabilit y . Even this small area en - compasses a huge range of phenomena, as is the case in other disciplines study ing p eriodic time series. I will focus on tw o small bu t prominent corners of p eriodic astronom y: studies of pulsars (rapidly rotating neutron stars) and of extr asolar planets (“exoplanets,” p lanetary b o dies revolving around other suns). New and up coming instrumentation are pro ducing rich data sets and chal lenging statistical inference problems in b oth p ulsar and exoplanet astronomy . Bay esian methods are w ell-suited to maximizing the science ext racted from the exciting new data. The b est-known and most influ ential statistical method s for detecting and char- acterizing p erio dic signals in astronom y use p erio do gr ams . In th e next section I will take a brief, Ba yesi an look at p erio dograms; they shed light on important issues common to many p erio dic time series p roblems, such as strong multimodalit y in The Pulsating S ky 3 lik elihoo d functions and p osterior densities. In § 3 I describ e detection and mea- surement of pulsars using data that report precise arriv al times of individual ligh t quanta (photons), including Bay esian approaches to arriv al time series analysis us- ing parametric and semiparametric inhomogeneous Poiss on p oint pro cess mo dels. In § 4 I turn to exoplanets, where the most pro du ctive detection method s as of th is writing find planets th at are too dim to see d irectly by lo oking for the reflex motion “w obble” of their h ost stars. Here the data are irregularly sampled time series with additive noise, with very accurate but highly n onlinear parametric mo dels for th e underlying orbital motion. I will briefly describ e some key inference problems (e.g., planet detection and orbit fit t ing), but I will focus on application of Bay esian ex- p erimenta l design to the problem of adaptive scheduling of the costly observ ations of th ese systems. A running theme is devising Bay esian coun terparts to well-kno wn frequentist method s, and th en using the Bay esian framew ork to add n ew capab ility not so readily achiev ed with conven tional approaches. A fin al section offers some closing p ersp ectives . 2. PERIODO GRAMS AND MU L TIMODALITY Supp ose we ha ve data consisting of samples of a time-dep endent signal , f ( t ), cor- rupted by additve noise; sup p ose the sample times, t i ( i = 1 to N ) are u n iformly spaced in time, with spacing δ t and total duration T = t N − t 1 . The measured data, d i , are related to the signal by , d i = f ( t i ) + ǫ i , (1) where ǫ i denotes the unknown n oise contribution t o sample i . I f we susp ect the signal is p erio dic with p erio d τ and frequency f = 1 /τ , a standard statistical tool for assessing p erio dic hyp otheses is t he Schuster p erio do gr am (Schuster 1898), a conti nuous function of the unknown angular frequency of the signal, ω = 2 π f : P ( ω ) = 1 N C 2 ( ω ) + S 2 ( ω ) , (2) where C and S are pro jections of the data onto cosine and sine functions; C ( ω ) = X i d i cos( ω t i ) , S ( ω ) = X i d i sin( ω t i ) . (3) Using trigonometric identities one can sho w th at P ( ω ) = 1 N X i d i e iωt i 2 . (4) Thus the p eriodogram is the sq uared magnitude of a quan tit y like the discrete F ourier transform (D FT), but considered as a contin u ous fun ction of frequency; accordingly , t h e perio dogram ordinate is often called the p ower at frequency ω . The p eriodogram is a p eriod ic funct ion of ω , with p erio d 2 π /δ t , and it is reflection- symmetric ab out the midp oint of each such frequency interv al; t h ese symmetries reflect the aliasing of signals with p eriod s smaller than twice the interv al b etw een samples (i.e., p eriod s for whic h the d ata are sampled b elo w the Nyq uist rate). W e 4 T. J. L or e do will assume th e angular frequencies of interest hav e ω ∈ (0 , π /δ t ); equiva lently , f ∈ (0 , 1 / 2 δ t ). Supp ose the av ailable information justifies assig ning ind ep endent standard nor- mal probabilit y densities for the ǫ i . Then th e perio dogram has several simple and useful prop erties. Under the null hyp othesis ( H 0 ) of a constant signal, f ( t ) = 0, the F ourier fr e quencies , f j = j /T ( j = 1 to N / 2), play a sp ecial role. The N F = N / 2 v alues {P (2 πf j ) } are statistically indep end ent; the probabilit y distribution for eac h v alue of 2 P (2 π f j ) is χ 2 2 (i.e., t h e p eriodogram v alues themselves h a ve ex p onential distributions). The indep end ence implies that the con tinuous function P ( ω ) may b e exp ected to ha ve significant structure on angular frequency scales ∼ 2 π /T (or 1 /T in f ), the F ourier spacing. The b est-kn own use of p eriod ograms in astronomy is for n onparametric p erio dic signal d etection v ia a significance t est th at attempts to reject the null. The simplest proced ure examines P ( ω j ) at th e F ou rier frequencies to find the h ighest p ow er. F rom the χ 2 2 null distribut ion a p -v alue may b e calculated, sa y , p 1 . The ov erall p - v alue, p , must account for examination of N / 2 indep endent perio dogram ordinates; a Bonferroni correction leads t o p ≈ N F p 1 (for small p 1 ). Wh en p is small (say , p < 0 . 01), one claims there is significant evidence for a p eriod ic signal; astronomers refer to p as the signific anc e level associated with the claimed detection. In practice, when a p eriodic signal is present, its frequen cy will n ot correspond to a F ourier frequency , redu cing p ow er (in the Ney man-Pear son sense). Th us one oversamples by a factor M , ex amining th e p erio dogram at M × N F frequencies with a sub -F ourier frequency spacing, δ ω = 1 / ( M T ) with M t yp ically a small integer. The m u ltiple testing correction is no w more complicated b ecause the perio dogram ordinates are no longer ind ep endent random v ariables; an appropriate factor may b e found via Monte Carlo simula tion, though simple rules-of-th umb are often used. There is a complementary p ar ametric view of the p erio dogram, ari sing from time-domain harmonic mod eling of the signal. A s a simple perio dic mo del for the signal, consider a sinusoid of unkn own frequ ency , p h ase φ , and amplitude, A : f ( t ) = A cos( ω t − φ ). Least squares (LS) fitting of th is single harmonic to t h e data examines the sum of squared residuals, Q ( ω , A, φ ) = X i [ d i − A cos( ω t i − φ )] 2 . (5) The log-likeli ho od function, u sing t h e standard normal noise model, is L ( ω , A, φ ) = − 1 2 Q ( ω , A, φ ), so th e same sum plays a key role in max imum likel ihoo d (ML) fitting. F or a give n candidate frequency , w e can analytically calculate the conditional (on ω ) L S estimates of th e amplitude and ph ase, ˆ A ( ω ) and ˆ φ ( ω ). T o estimate the frequency , we can examine the profile statistic, Q p ( ω ) = Q ( ω , ˆ A ( ω ) , ˆ φ ( ω )); t he b est- fit frequency minimizes this ( i.e., maximizes the profile likelihoo d). The profile statistic is closely connected to the p erio dogram; one can show Q p ( ω ) = Const. − P ( ω ) , (6) where t he constan t is a function of th e data but not the parameters. A corollary of this intimate connection b etw een p arametric harmonic analysis and p erio dograms is that th e strong va riabilit y of the (nonparametric) p erio dogram implies strong multimodalit y of th e harmonic mo del likelihood fun ction (and hen ce of the p osterior distribution in Ba yesi an h armonic analysis), on frequency scales ∼ 1 /T . The Pulsating S ky 5 In astronom y it is frequently the case th at phenomena are not sampled uniformly , if only due to the constrain t of nigh t-sky observ ation and the va garies of telescope sc heduling and wea ther. The p eriod ogram/leas t squares connection p ro vided th e key to generalizing p eriod ogram-based nonparametric p eriod ic signal detection to non uniformly sampled data. Lomb (1976) and Scargle (1982) took t he connection as a defining prop erty of the p erio dogram, leading t o a natural generalization for nonuniform data called the L omb-Sc ar gle p erio do gr am (LSP). Though developed for analysis of astronomical data, th e LSP is now a widely used to ol in time series analysis across many disciplines. Only recentl y w as the Bay esian counterpart t o t his w orke d out, by Jaynes (1987) and Bretthorst (1988). Instead of maximizing a lik elihoo d function ov er amplitude and p hase, they “do the Ba yesia n thing” and mar ginali ze ov er these parameters. The logarithm of t h e marginal density for the frequency is then prop ortional to the p erio dogram; for irregularly sampled data, there is a similar conn ection t o t he LSP (Bretthorst 2001). But this w as more th an a red isco very of earlier results in new clothing. F rom within a Bay esian framew ork, th e calculations for conv ertin g p eriodogram v alues into probabilit y statemen ts about th e signal d iffer starkly from their frequentist sp ectral analysis coun terparts. The most stark difference app ears, not in parameter estimation, but in signal detection via mo del comparison. The conditional o dd s for a p eriod ic signal b e- ing presen t at an a priori k n ow n frequen cy is approximately an ex p onential of the p eriodogram. But t h e frequency is never known precisely a priori. F or detecting new p erio dic sources, one must p erform a “blind searc h” ov er a large frequency range. Eve n for recov ering a kn o wn signal in new data, the (predictive) frequency uncertaint y , based on earlier measuremen ts, is typically considerable. In Bay esian calculations, frequency uncertaint y is accounted for by calculating mar ginal rather than maximum likelihoo ds, with the av eraging ov er frequency in the marginalizatio n integ ral b eing the counterpart t o Bonferro ni correction. There is no special role for F ourier frequ encies in this calculation, either in location or in number; in fact, one w ants to ev aluate the p eriodogram at as many frequencies as n eeded to accurately calculate the integral under the c ontinuous perio dgram (ex p onentiated). Oversa m- pling, to get an accurate integra l, adds no n ew complication to the calculation. A further difference comes from quantif ying evidence for a signal with the prob- abilit y for a p erio dic h yp othesis, instead of a p - val ue quantifying compatibility with the null. V ery commonly , astronomers observe p opulations of sources; detection and measuremen t of individual sources is merely a stepping stone tow ard characteri za- tion of the p opulation as a whole. Signal probabilities (or marginal likelihoo ds and Ba yes factors) facilitate pop u lation mo deling via multilev el (h ieararc h ical) mo dels. Roughly speak in g, marginal lik elihoo ds pro vide a w eigh ting that allo ws one to ac- count for detection un certain ty in p opulation inferences; e.g., when inferring the num b er of dim sources, a large n umber of marginal detections ma y pro v ide strong evidence for a mo dest num b er of sources, even though one ma y not b e able to sp ecify precisely whic h of the candidate sources are actual sources. I n contra st, p opulation- leve l inference is awkw ard and challe nging when p - v alues are used to quantify the evidence for a signal. F or example, one might attempt to u se false-discov ery rate contro l to find a th reshold p -v alue corresp onding to a desired limit on the num- b er of false claimed detections within a p opulation (see Hopk ins et al. 2002 for an astronomical example). But th e (u nknown) actual false detections will b e prefer- entia lly clustered at lo w signal lev els, corrupting pop u lation-level inferences of the distribution of signal amplitudes. 6 T. J. L or e do A vali d criticism of th e Ba yes ian approach is the need to employ an ex plicit signal model, here a single sinusoid, raising concern about b ehavior for signals not resem bling the mo del. A frequentist nonparametric “omnibus” test that fo cuses on rejection of a null app ears more robust. But recent theoretical insights into the capabilities of frequentist h yp othesis tests ameliora te this criticism. Imagine an omnibus goo dness-of-fit test th at aims to d etect perio dicity by testing for arbitrary (p erio dic) departures from a constant signal. Set the test size α ( the maximum p -val ue we will accept as indicating the actual signal is not constant) to b e small, α ≪ 1, corresp onding to a small exp ected “false alarm” rate for a Neyman-Pearson test (it is wo rth emphasizing that th e observed p -v alue itself is not a false alarm rate, despite increasingly frequent use of such terminology in the astronom y literature). W e would lik e the test p ow er β (the long-ru n rate of rejection of the null when a non-constant signal is present) to b e as near unity as p ossible for arbitrary n on-constant signals. Janssen (2000) and Lehman an d Romano (2005; LR05) examine the p ow er of such omnibus tests ov er all local alternatives (i.e., alternativ es, described in terms of a basis, in a region of hyp othesis space ab out th e null shrinking in size like 1 / √ N for data sets of size N ). They show that β ≈ α for all alternatives except for those along a finite num b er of directions in hyp othesis space (indep endent of N ). As a result, “A p roper choice of test m u st b e based on some knowledge of the p ossible set of alternatives for a giv en exp eriment” (LR05). F reedman (2009) proves a complimen tary theorem show ing that, for an y choice of test, there are some r emote alternativ es (i.e., not in a shrinking neigh b orho o d of the null) for which β ≈ 0. As a consequ ence of these and related results, he concluded, “Diagnostics cannot hav e m uch p ow er against general alternatives.” These results are c hanging practice in construction of frequentist tests. Instead of devising clever statistics that embo dy an in tuitively app ealing “generic” measure of non- uniformit y , statisticians are turning to the practice of sp ecifying an explicit family of alternatives (e.g., via a sp ecific choice of basis), and deriving tests that concentrate p o we r within the chosen family (e.g., Bick el et al. 2006). An ex amp le in astronom y is the w ork of Bic kel, Kleijn and Rice (2008) on pu lsar detection, using a F ourier basis. These d evelo pments ind icate that, one wa y or another, one had b etter consider sp ecific alternatives to the null. In this resp ect, parametric Bay esian mod el comparison (with a prior ov er a broad parametric family) and nonparametric frequentist testing do not seem very far apart. With this p ersp ective, we can see the links b etw een the p erio dogram and b oth frequ entist and Bay esian h armonic analysis as exp osing th e c hoice of alternativ es implicit in p erio dogram-based p eriod ic signal detection. Summarizing, some key p oints from th is brief look at p eriodograms, which will guide subsequent developmen ts, are: (1) W e exp ect t h e likelihoo d (and thus th e p osterior) will b e h ighly multimodal in th e frequency dimension. (2) The scale of v ariability of the likel ihoo d in the frequency dimension will b e ∼ 1 /T . F or problems with long-duration datasets and significant prior frequency uncertaint y , exploring the frequ en cy dimension will b e c hallenging. (3) A key d ifference betw een Bay esian and frequentist approac hes arises from how frequency uncertaint y (and other pa- rameter uncertaint y) is hand led, e.g., wheth er one maximizes and then corrects for multiple tests, or marginalizes, letting probability a verag ing implicitly account for the parameter space size. The Pulsating S ky 7 3. PULSA R SCIENCE WITH SP ARSE ARRIV AL TIME SER IES So near you are, summer stars, So near, strumming, strumming, So lazy and hum-strumming. — Carl Sandb er g In 1967, Jocelyn Bel l, a graduate student of the radio astronomer Anthon y Hewish, wa s monitoring radio observ ations of the sky that combined goo d sensitivity with fast (sub-second) time resolution. She made a startling discov ery: a celestial source was emitting a strong p eriod ic signal with a p erio d of less than a se c ond . It is hard to appreciate tod a y just how sho cking this discov ery was. Theoretical astrophysici st Philip Morrison recalled th e early reaction to the news in an interview for the American Institute of Physics: 1 I remem b er m yself meeting at the airp ort a friend who just returned from Great Britain, an astronomer. An d he said, “Hav e you heard the latest? . . . They’ve got something that p ulses every second— a stel- lar signal that p ulses every second.” I said, “Oh, th at couldn’t b e true!” “Y es,” he said, “it’s absolutely t ru e. They ann ou n ced it recently . They’ve studied it for ab out five or six mon t hs. It’s extraordinary .” . . . [T]hey sat on t hese results for several months, b ecause the whole thing was so extraordinary and so unexp ected, that they d idn’t wan t to release it until they had a chance to confi rm it. The reason of course is quite simple. W e think of the stars quite sensi- bly as b eing—well we sa y the fix ed stars—as b eing eternal, long-liv ed , everl asting. And even though w e know that’s not 100% true—that th e star sometimes explo des a little bit, making a nov a, or explo des dis- ruptively flinging itself apart en tirely , making a sup ernov a—still those are n ot reall y fast ev ents from a human time scale. I f th ey t ake a few seconds or a da y , th at would b e remark able for a star. Y ou don’t see muc h happ ening on the stars in a second. . . . [W]e k new something remark able was going on and p eople gav e it a name, p ulsar. . . of course the whole astronomical comm u nity w as gal - v anized in looking at it. W e now und erstand pulsars to b e rapidly rotating, highly magnetized neutron stars, den se remnants of th e cores of massive stars, with masses somewhat larger than that of the S un, but occupying a nearly spherical vol ume only ∼ 10 km in radius, and hence with a d ensit y similar to that of an atomic nucleus. The pulsations are due to radiativ e pro cesses near the star that get their energy from the whirling magnetic field, whic h acts lik e a generator, accelerating charged particles to high energies. The particles radiate in b eams rotating with the star; the observe d p u lsars are those whose b eams sw eep across the line of sight to Earth, in the mann er of a ligh thouse. The fastest pu lsars rotate ab out 700 times a second; more typical pu lsars hav e p erio ds of order a second. If we could hear the v ariation in intensit y of the ligh t they emit, the slo wer ones would sound lik e a ticking clo ck (of extraordinary accuracy); the faster ones w ould hum an d whine. 1 Excerpt from the AIP “Moments of Discov ery” web exhibit at http://w ww.aip.org /history/mod/pulsar/pulsar1/01.html . 8 T. J. L or e do T o date ab out tw o thousand p u lsars hav e b een d isco vere d; ongoing surve ys con- tinue to add to the number. The ma jority of pu lsars pulse in radio wa ves. But a num b er of them also pulse in higher energy radiation: visible light, X ra y s, and gamma rays. Recently , a small num b er of r adio-quiet pulsars hav e b een found that pulse only in h igh energy radiation. Figure 1 sho ws folded light curves—radiation intensit y v s. time, with time measured in fractions of th e p eriod —for several pul- sars observ ed across the electromagnetic sp ectrum. There are clear differences in the light curves for a particular pulsar across energy ranges, indicating th at differ- ent physical pro cesses, p robably in spatially distinct regions, produ ce the v arious types of emissi on. Astronomers are trying t o d etect and measure as many pulsars as p ossible, across the electromagnetic sp ectrum, to chara cterize pulsar emissio n as a p op u lation phenomenon, p ooling in formation from individu al sources to unrav el the physics and geometry of pulsar emission and ho w it may relate to the manner of stellar death and the magnetic and material environmen ts of stars. Figure 1: R epresentative pulsar light c urves in various wavele ngth r egions (fr om NASA GSFC). X ra ys and gamma rays are energetic, with thousands to billions of times more energy p er photon (ligh t qu antum) than visible light. Even when a source is very luminous at high energies (i.e., emitting a large amount of energy p er unit time), the number fl u x (number per unit time and area) of X rays and gamma rays at Earth may b e low. A stronomers use instru ments that can d etect and measure individual ph otons. The resulting time series data are usually arrival time series , sequences of precisely measured arriv al times for d etected ph otons, t i ( i = 1 to N ); p h oton energy and direction may also b e measured as “marks” on this p oint process. F or gamma-ray emission, t he flux is so small that the eve nt rate is well b elo w one ev ent p er p eriod. But precise timing measuremen ts spanning long t ime p eriods—h ours to days—can gather enough even ts to un am biguously identify pulsar signals, particularly when multiple sets of observa tions sp an n ing weeks or months (with large gaps) are join tly analyzed. In June 2008, NA SA launched a new large sp ace-based telescop e t aske d with surveying the sky in gamma rays: the F ermi Gamma-R ay Sp ac e T elesc op e . One of F ermi ’s key scien tific goals is to undertake a census of gamma-ray pulsars (see Ab d o The Pulsating S ky 9 et al. 2010 for the first F ermi pulsar catalog). This has renew ed in terest in metho ds for analyzing arriv al time series data. Here I will survey Bay esian work in this area dating from the early 1990s that app ears little-kn o wn outside of astronomy , and then describ e new directions for researc h motiv ated b y F ermi observ ations. Since the photons originate from microscopic quantum mechanical pro cesses at different p laces in space, a Po isson p oint pro cess ( p ossibly non-homogeneous) can very accurately mo del the data. This is the found ation for b oth frequ entis t and Ba yesi an app roac hes to p erio dic signal detection in these data. F or brigh t X-ray sources, with man y even ts detected p er candidate perio d, even ts may b e b inned in time, and standard perio dogram tec h niques ma y then be applied t o the uniformly- spaced binn ed counts (the p - v alue calculation is adjusted to account for th e “root– n ” standard dev iation of the counts). W e focu s h ere in stead on the lo w-flux case, where the data are too sparse for binning to b e useful, so they must b e considered as a p oint pro cess. This is th e case for dim X-ray sources and all gamma-ray sources. F or most p erio dic signal detection problems with arriv al time data , astronomers use frequentist meth od s inspired by the p erio dogram approach in the additive noise setting d escrib ed in § 2: one attempt s to reject the null mo del of constant rate by using a frequency - dep endent test statistic, calculating p -v alues, and correcting for multiplicit y . A v ariet y of statistics h ave b een advocated, but three d ominate in practice (Lewis 1994 and Orford 2000 p ro vide goo d ove rviews of the most-used metho d s). All of th em start by folding the d ata modulo a trial p erio d to pro duce a phase, φ i , for each even t in the interv al [0 , 2 π ]; the statistics aim to measure depar- ture from uniformity ov er p hase (i.e., they are statistics for detecting nonuniformit y of directional data on the circle). First is the R ayleigh stat istic , R ( ω ), defined by R 2 = 1 N N X i =1 sin φ i ! 2 + N X i =1 cos φ i ! 2 . (7) The quantit y 2 R 2 ( ω ) is called th e R ayleigh p ower . It is the p oint p rocess analog to the Sch u ster p erio dogram of equation (2), and under the null, asymptotically 2 R 2 ∼ χ 2 2 (so R 2 follo ws an ex p onential distribution). In practice, the Rayleig h statistic p erforms w ell for detecting signals that hav e smooth light cu rves with a single p eak p er p eriod . As Figure 1 rev eals, this is n ot typically the case for high energy emission from pulsars, so statistics are sought that hav e greater p ow er for more complicated shap es. T aking a cue from the resemblence of R ( ω ) to a F ourier magnitude, the Z 2 m statistic sums p ow er from m h armonics (counting the fun damental as m = 1) of t h e Rayleig h p ow er: Z 2 m = 2 m X k =1 R 2 ( k ω ) . (8) Under th e null, asymptotically Z 2 m ∼ χ 2 2 m . The num b er of harmonics, m , is usually set to a small integer va lue a priori ( m = 2 is p opular), though it is also possible to allo w m to adapt to the data. The third commonly-u sed metho d is χ 2 ep o ch folding ( χ 2 -EF). F or every trial frequency , t h e folded p hases are binn ed into M equ al-width phase b in s, and P ear- son’s χ 2 is used to test consistency with the null hyp othesis of a constant p hase 10 T. J. L or e do distribution. The number of bins is c hosen a p riori. T he counts in eac h bin (for a chos en ω ) will dep end on th e origin of time; mo ving the origin will change the folded phases and shift events b etw een ph ase bins. T o account for this, the χ 2 statistic ma y be a vera ged ov er ph ase (Collura et al. 1987). This alters its distribution un der the null; Collura et al. ex plore it via Mon t e Carl o simulation. The Z 2 m and χ 2 -EF statistics can b e more sensitive to structured ligh t curves than t he R ayleigh statistic, but with additional complexity in the form of in tractable distributions or the need to fix stru cture p arameters (n umber of harmonics or bins) a priori. All of t h ese statistics are simple t o comput e, and th ere are goo d reasons to seek simplicit y . F or a typical detectable X-ra y pulsar, it ma y take observ ations of duration T ∼ 10 4 to 10 5 s to gather a few thousand photons; for a detectable gamma- ra y pulsar, it ma y take a week or more of integrated exp osure time, so T ∼ 10 6 s. The F ourier spacing for such d ata ranges from µ Hz to ∼ 0 . 1 mHz. F or a tar gete d se ar ch — attempting to detect emission from a previously detected p ulsar (e.g., detected in radio wa ves)—the frequency uncertaint y is typically hundreds to thousands times greater th an this F ourier spacing. F or a bl ind se ar ch —attempting to discov er a new pulsar—the number of frequencies to search is orders of magnitude larger. Pulsars are observe d with fundamental frequencies up to ≈ 700 Hz (centrifugal forces would destro y a neutron star rotating more rapidly than ab out a kilohertz). The n on- sin usoidal shap es of pulsar light curves imp ly there may b e significant p ow er in harmonics of the rotation frequency , at frequencies up to f max ≈ 3000 Hz. The num b er of frequencies that m ust b e examined is then ∼ f max T , which can be in the tens of millions for X-ray pulsars, or th e billions for gamma-ray pulsars. In fact, the computational burden is significantly w orse. The energy emitted b y pulsars is dra wn from the reservo ir of rotational energy in the spinn ing neutron star. Thus, by conserv ation of en ergy , an isolated pulsar m ust b e spinning do wn (a p u lsar in a binary system may instead spin up , if it is close enough to its companion star to accrete mass carrying angular momentum). The pulsar frequency thus c hanges in time; a linear change, parameterized in terms of the f r e quency derivative ˙ f , describ es most pulsars w ell, though a few have higher deriv atives that are measurable. A pulsar search must search ov er ˙ f v alues as w ell as frequency v alues. The num b er of ˙ f va lues t o examine is d etermined by requiring that the frequency d rift across the data set, ˙ f T , be smaller than the F ourier frequency spacing, giving a number of ˙ f trials of T 2 ˙ f max , with ˙ f max ≈ 10 − 10 Hz s − 1 for kn o wn pulsars. F or a targeted searc h with the shortest X-ray d ata sets, using a single ˙ f v alue (estimated from previous observ ations) may suffice. F or blind searching for gamma-ray pulsars, one ma y ha ve to consider ∼ 10 3 v alues of ˙ f . Clever use of F ourier tec hniques, in cluding tap ered transforms, can reduce the burden significantly (e.g., At woo d et al. 2006; Meinshausen et al. 2009). Even so, the num b er of effectively indep endent h yp otheses in ( f , ˙ f ) sp ace will b e thousands for targeted searc h , and many millions to a billion for blind search. This limits t he complexity of detection statistics one may consider, and requires that sampling distributions b e estimated accurately far in their tails. W e now consider Bay esian alternatives t o the traditional tests, bu ilt using time- domain models for a non-homogeneous Poiss on p oint process with time-depen dent intensit y (exp ected even t rate p er u nit time) r ( t ) . 2 F or p erio dic mo dels, the pa- rameters for r ( t ) will include an amplitude, A ; the angular frequency , ω ; a phase 2 The f ramework outlined here is presen ted i n more detail in an unpublished technical repor t (Loredo 1993); it was summari zed in Loredo (1992a), an abridged version of whi c h The Pulsating S ky 11 (correspond ing to defi n ing an origin of time), φ ; and one or more shap e parameters, S , that parameterize the light curve shap e. The likeli ho od function is, L ( A, ω , φ , S ) = exp − Z T dt r ( t ) N Y i =1 r ( t i ) , (9) written here with the parameter dep endence implicit in r ( t ) = r ( t ; A , ω , φ , S ). W e will b e comparing mo dels for the signal, including a constant “null” mo del that will hav e only an amplitud e parameter. Since all mo dels share an amplitude parameter, it is helpful to defin e it in a w ay so that a common prior may b e assigned to A across all mod els. W e write the p erio dic mo del rate as, r ( t ) = Aρ ( ω t − φ ) , (10) where ρ ( θ ) is a p eriodic function with perio d 2 π , and A is defined to b e the av erage rate, A ≡ 1 P Z P dt r ( t ) . (11) (F or a constant mo del, r ( t ) = A .) This implies a normalization constrain t on ρ ( θ ): Z 2 π 0 dθ ρ ( θ ) = 2 π , (12) or, equiv alently , Z τ dt ρ ( ω t + φ ) = 1 . (13) That is, ρ ( θ ) is normalized as if ρ ( θ ) / 2 π were a probability density in phase, or ρ ( ω t + φ ) were a probabilit y den sit y in time (ove r one p erio d). With th ese definitions, the lik elihoo d function ma y b e written, L ( A, ω , φ , S ) = h A N e − AT i Y i ρ ( ω t i − φ ) . (14) Here w e hav e presumed that T spans many p erio ds, so that the integral of th e rate o ver t ime in the exp onent is w ell-approximated by AT . Give n an ind ep en dent prior π ( A ) for t h e amplitude, t h e marginal likelihoo d for the frequency , phase, and shap e is simply L ( ω , φ , S ) ∝ Y i ρ ( ω t i − φ ) , (15) where the constant of prop ortionality is the same for all m o dels if a common am- plitude prior is used; it thus drops ou t of Bay es factors. 3 appeared as Loredo (199 2b). 3 This shared, indep endent prior assumption is a reasonable starting point for analyz- ing individual s ystems, but deserv es further consideration when population modeling is a goal, since differen t physics may underly emission from pulsars and non-pulsating neutron stars, and the exp ected amplitude of pulsar emission likely depends on fr equency (and other parameters). Since amplitude and frequency are precisely estimated when a signal is de- tectable, p opulation modeling ma y b e sim pl ified in an empirical Bay es s pi rit by inserting conditional pri or factors, conditioned on the estimated ampli tude and f requency . 12 T. J. L or e do T o go forw ard, w e now must sp ecify models for ρ ( θ ), b earing in mind the compu - tational burden of ( f , ˙ f ) searching. In particular, since we will need to integrate th e lik elihoo d function ov er parameter space (for ev aluating marginals for estimation, and marginal likelihoo d for mo del comparison), w e seek mo dels that allo w us to d o as much in tegration analytic al ly as p ossible. Here we focus on tw o complemen tary choi ces, one allo wing analytical phase marginaliza tion, the other, a semiparametric mod el allowing analytical shap e parameter marginalization. Since p ro du cts of ρ ( θ ) app ear in the likelihood , consider a log-sin usoidal mo del, so that multiplication of rates leads to sums of sin usoids in the likelihoo d. Since ρ ( θ ) must be normalized, this corresponds to taking ρ proportional to a von Mi ses distribution , ρ ( θ ) = 1 I 0 ( κ ) e κ cos( θ ) , (16) where I 0 ( κ ) denotes the mod ified Bessel function of order 0. This mo del has a single shap e parameter, th e c onc entr ation p ar ameter , κ , that simultaneo usly con trols the width of the p eak in the ligh t curve, and the p eak-to-trough ratio (or pulse fraction). If we assign a un iform prior distribution for the phase (implied by time t ransla- tion inv ariance), a straigh t forw ard calculati on giv es t h e marginal likelihood funct ion for frequency and concentration: L ( ω , κ ) = I 0 [ κR ( ω )] [ I 0 ( κ )] N . ( 17) The Rayleigh statistic arises as a kin d of sufficient statistic for estimation of fre- quency an d concentration for a log-sinuso id mo del. Interestingl y , t he κ dep endence dep ends only on the v alue of R and the sample size. Using asymptotic p rop erties of the Bessel function one can show that, when th ere is p otential evidence for a signal at a particular frequency (amounting to R > √ N ), the lik eliho o d is appro ximately a gamma distribution in κ . Also, the lik eliho o d function strongly correla tes ω and κ , so that the likelihood is larges t at frequencies for which the concentra tion wo uld b e estimated as large (which is intuitiv ely sensible). A gamma distribution prior for κ w ould b e asymptotically conjugate. This is an intere sting developmen t b ecause it op ens th e do or to Ba yesia n infer- ence using computational to ols already at hand for use of the Rayleigh statistic (see Connors 1997 for a tutorial example calculation). Bay esian inferences for frequency , and for signal detection (v ia mo del comparison), require integ ration of eq uation (17) o ver κ , bu t this is not a significan t complication. A table of v alues of the integral ma y b e pre-comput ed at the start of th e p erio d search, as a function of R , and interpolated for the fin al calculations. Benefits of this Bay esian counterpart to the Rayleig h test include simpler interpretation of results (e.g., probabilit y for a signal vs. a p -va lue), the p ossibilit y of integrating the results into a multil evel model for p opulation inferences, and the absence of complex, sample-dep end ent corrections for non-indep en dent test m u ltiplicit y due to ov ersampling. The complexit y of the ligh t curves in Figure 1 indicates that a model allo wing more stru ct ure than a single, smooth p eak p er p erio d will b e better able to detect pulsars th an the simple log-sinusoid mo del. Ideally , on e might consider a ric hly flexible nonparametric model for ρ ( θ ), the ov erall mo del now b eing semiparametric (with scalar p arameters f , ˙ f , and φ ) . But the scale of t he ( f , ˙ f ) searc h precludes The Pulsating S ky 13 use of a computationally complex model. Inspired b y th e χ 2 -EF method, Gregory and Loredo (1992; GL92) consider a pie c ewise c onstant shap e ( PCS) mod el for ρ ( θ ), with ρ constant across M equal-width phase bins. Allowing M to b e determined by the data makes t his mod el semiparametric in spirit ( in the fashion of a sieve), if not formally nonparametric. The PCS shape function ma y be written ρ ( θ ) = A M f j ( θ ) , with j ( θ ) = ⌊ 1 + M ( θ mod 2 π ) / 2 π ⌋ , (18) where the step parameters f = { f j } specify the relative amplitudes of M steps, eac h of width 1 / M p erio d; with this parameterization, the step parameters are constrained to b e p ositive and to lie on the un it simplex, P j f j = 1. The (marginal) lik elihoo d funct ion for angular frequ en cy , phase, and shap e then has the form of a multinomi al distribution: L ( ω , φ , f ) = M N M Y j =1 f n j j , (19) where n j = n j ( ω , φ ) is t he number of even ts whose times place them in segmen t j of the ligh tcurve, given the phase and frequency . These num b ers corresp ond t o t he counts in bin j in the EF metho d. The app eal of the PCS mo del is the simple dep enden ce on f , which allows analytic marginalization ov er shap e if a conjugate prior is used. GL92 adopted a flat shap e pr ior , π ( f ) = 1 / M !. With this choice, t h e marginal likeli ho od for frequency , p hase, and M is L ( ω , φ ) = M N ( M − 1)! ( N + M − 1)! n 1 ! n 2 ! . . . n M ! N ! . (20) Only the term in b rac kets dep ends on ω and φ . I t is just the reciprocal of the mul- tiplicit y of the set of n j v alues—the num b er of w ays N events can b e distributed in M bins with n j even ts in eac h b in. Physicists know its loga rithm as the configura- tional en tropy of the { n j } . In fact, I devised this m o del sp ecifically to obtain this result, formalizi ng a cleve r intuition of Gregory’s that entropy provides a measure of distance of a binned distribu tion from a uniform distribution that could b e sup erior to the χ 2 statistic used in χ 2 -EF. In a Ba yes ian setting, the recipro cal m ultiplicit y provides more th an a simple test statistic; it en ables calculation of posterior proba- bilities for frequency , phase, and the n umber of bins. F urther, by mo del av eraging (o ver the choice of M , p hase and frequency), one can estimate the light curve shap e without committing to a particular binned representation. A collection of p oint wise estimates of ρ ( θ ) vs. θ is smo oth (alb eit somewhat “boxy”), though considered as a function the estimate is outside the supp ort of the mo del. A drawbac k of th e PCS mo del is th at the ph ase parameter may not b e marginal- ized analytically . Numerical quadrature must be used, whic h makes the approac h significan tly more compu tationally burdensome than the log-F ourier mo del (though not more burdensome than phase-av eraged χ 2 -EF). Figure 2 sh ows an ex ample of th e PCS mo del in action, from Gregory an d Loredo (1996; GL96). These results use data from R OSA T satellite observ ations of X -ray pulsar PSR 0540 − 693, lo cated in th e Large Magellanic Cloud, a small irregular galaxy companion to the Milky W ay . This pulsar was first d etected in earli er data 14 T. J. L or e do from the Einstein O bservato ry (Seward et al. 1984); it is fast, with a p erio d of ≈ 50 ms. Later, less sensitive ROSA T observ ations w ere undertaken to confirm the detection and improv e the estimated parameters, but the pu lsar w as not detectable using the R aylei gh statistic (implemen ted via FFT). Figure 2a sho ws th e marginal lik elihoo d for the pulsar frequency for a 5-bin model, scaled to give the conditional odd s in fa vor of a p eriodic mod el over a constant mo del, were the frequen cy sp ecified a priori (and the constant mo del considered equ ally prob ab le to th e set of mo dels with M = 2 to 10 a priori). In fact, the prior measurements predicted the frequen cy to lie within a range spann ing 6 × 10 − 4 Hz (containing ab out 144 F ourier frequen cies for th is d ata sp an n ing T = 116 , 341 s). Marginalizing ov er this range giv es o dd s vs. M as sho wn in Figure 2b. There is ov erwhelming evidence for the p ulsar. F urther results, including ligh t curve estimates and comparison with χ 2 -EF, are in GL96. Figure 2: (a) Mar ginal l ik eliho o d for PSR 0540 − 693 fr e q uency using ROSA T data, for a 5-bin PCS mo del; likeliho o d scale d to indic ate the conditional (on fre- quency) odds favoring a perio dic signal. (b) Odds for a p eriodic mo de l v s. a c on- stant mo del, vs. numb er of bins. A connection of th e PCS mo del to χ 2 -EF is wo rth h ighligh ting. U sing Stir- ling’s approximation for the factorials in eq uation (20), one can sho w that, for large num b ers of counts in the bins, log L ( ω , φ ) ≈ 1 2 χ 2 + 1 2 X j log n j + C ( M ) , (21) where C ( M ) is a constan t dep ending on M , and χ 2 is the same statistic used in the χ 2 -EF method. In fact, exp[ − χ 2 / 2] can be a goo d approximation to the m arginal lik elihoo d for ω and φ . Despite this, in simulations the PCS model prov es b etter able to detect weak p eriod ic signals than th e ph ase-a vera ged χ 2 statistic. The reason probably has less to do with failure of t he appro ximation than with the fact that, from a Ba yesia n viewp oint, th e prop er quantit y to a verage over p hase is not χ 2 , but exp[ − χ 2 / 2]. Ad ho c a veraging of χ 2 to eliminate the ph ase nuisance parameter essen tially “ov ersmo oths” in compariso n to a p rop er marginali zation. The launc h of F ermi has renewed interest in imp roving our capabilit y to detect w eak p eriod ic signals in arriv al time series. O n the computational fron t , imp ortant recent advances includ e the use of tap ered transforms (Atw o od et al. 2006) and The Pulsating S ky 15 dynamic programming (Meinshausen et al. 2009) to accelerate ( f , ˙ f ) exp loration (in the context of Ra yleigh and Z 2 m statistics). Statistically , the most imp ortan t recen t developmen t is the introdu ction of likel iho o d- based score tests by Bic kel et al. (2006, 2008). Inspired by the recent th eoretical wo rk on th e limited p ow er of omnibus tests d escrib e in § 2, t h ese tests seek high p o w er in a family of mo dels built with a F ourier basis. A n in teresting innov ation of this approac h is the use of aver aging over fr e quency , rather than maximizing, to account for frequency u ncertaint y . As in the χ 2 -EF case, the a veraging is of a quantit y th at is roughly the logarithm of the marginal likel iho od that would app ear in a Bay esian log-F ourier mo d el. It seems lik ely that a fully Bay esian treatment of an analogous mo del could do b etter, though generalizing the log-sin usoid mo del describ ed ab ov e to include multiple harmonics is not trivial (Loredo 1993). On the Bay esian front, a simple modification ma y impro ve the capab ilit y of the PCS mo del. Figures 3a,b sho w dra ws of shap es using the flat p rior for M = 5 and M = 30; the shap es gro w increasingly flat with gro wing M . A b etter prior would aim to stay v ariable as M increases. Consider the family of conjugate symmetric Diric hlet priors (to keep th e calculatio n analytic), π ( f ) ∝ δ 1 − X j f j ! Y j f α − 1 j . (22) One wa y to maintain vari abilit y is t o make α dep end on M in a manner that keeps the relative standard deviation of any particular f j constant with M . More funda- mental ly , w e might seek to make the family of priors divisible . Both requirements p oint to the same fix: take α = C / M , for some constant C . Figure 3c shows samples from an M = 30 prior with α = 2 / M (the M = 2 prior w ould b e flat for this choice); v ariability is restored. Informally , we might set C a priori based on examination of kn own light curves. A lternately , inferring C from the data, either case-by-case or for p opu lations (e.g., separately for X-ray and gamma-ra y pulsars), ma y pro vide useful insigh ts into p u lsar prop erties. These a venues are currently being exp lored. Figure 3: (a, b, left) 10 r andom sample s (stacked) fr om a flat shap e distri- bution, for M = 5 and M = 30 bins. (c, righ t) 10 r andom samples fr om a Dirichlet shap e distribution for M = 30 bins, with α = 2 / M . A p ossible approac h for using more complex nonparametric Ba yesia n mo dels may b e to use a computationally inexp ensive metho d, like th e log-sinusoid model or the dynamic programming search algorithm of Bic kel et al., for a “first pass” analysis that identifies promising regions of ( f , ˙ f ) space. The more complicated analysis 16 T. J. L or e do w ould only b e undertaken in t h e resulting target regions. Ho w ever, the regions ma y still be large enough to significantly constrain the complexit y of nonparametric mod eling. W e close this section with an observa tion about the apparently b oring null hy- p othesis, traditionally framed as a constant rate model, r ( t ) = A . It may b e more accurate to frame it as a constant shap e mo del, ρ ( θ ) = 1. These do not quite amount to the same thing, b ecause in th e shap e description, w e implicitly hav e a candidate p eriod in pla y , and w e are asserting flatness of a “per p erio d” or folded rate. In fact, few X-ray or gamma-ra y sources h a ve constant observed fl uxes o ver th e d uration of pulsar searc h observ ations. Sources often v ary in luminosity in complex wa y s o ver time scales of hours and days. In some cases, the flux may v ary b ecause a survey instrument is not alw a ys pointing d irectly at the source. Although the rate as a function ex amined o ver the full duration, T , ma y strongly v ary , when folded o ver candidate p erio ds (alwa ys muc h smaller than T ) and viewe d vs. phase, it may b e v ery close to constan t. This is essen t ially an example of Poincar ´ e’s “method of arbitrary functions” (e.g., Diaconis and Engel 1986). Similar considerations apply to p erio dic mo dels: models allo wing p eriod -to-p erio d va riabilit y b ut with a p eri- odic exp ected rate can lead to the same likelihoo d function as the strictly p erio dic mod els considered ab o ve. These considerations remind us th at our h yp otheses are alw ays in some sense a caricature of realit y , but that in some cases w e ma y b e able to formally justify the caricature. 4. BA YESIAN INFERENCE AND DESIGN FOR EXOPLANET ORBIT OBSER V A TION S Something there is more immortal even than the stars. . . Something that shall endure longer even th an lustrous Jupiter Longer than sun or any revolving satellite, Or the radiant sisters the Pleiades. — Walt W hitman Ancient sky -wa tchers n oted the complex mov ement of the planets with respect to the fi xed stars; in fact, “planet” deriv es from the Greek w ord for “wa nderer.” Even b efore the heliocentric models of Copernicu s, Galileo and Kepler, th is motion was attributed to r evolution of t h e planets around a host ob ject, originall y Earth, later the Sun . By N ewton’s time, a more sophisticated view emerged: F or an in ertial observer (one exp eriencing n o measurable acceleration), the planets and the Sun app ear to orbit around their common center of mass. The Sun is so muc h more massiv e than even the most massive planet, Jupiter, th at the cen ter of mass of the solar system—t he b aryc enter —lies within the Sun (its offset from the Sun’s center is of order the solar radius, in a direction determined mostly by the p ositions of Jupiter and S aturn). The helio centric descriptions of Cop ernicus, Galileo and Kepler were approximatio ns. Had they b een able to make precise observ ations of the solar system from a v antage p oint abov e the ecliptic plane, they would have not only seen the planets whirling ab out in large, elliptical, p erio dic orbits; they w ould h a ve also seen the Sun executing a complex, wobbling dance, albeit on a muc h smaller scale. What th e ancien ts could not see, and what mod ern instruments rev eal, is th at some of the “fixed” visible stars are in fact wo bbling on the sky , sketc h in g out small ellipses or more complex patterns similar to the Su n’s unnoticed wobble. The largest motions arise from pairs of stars orbiting each other. But in th e last 15 years , as a consequence of dramatic adv ances in astronomers’ abilit y to measure The Pulsating S ky 17 stellar motions, ov er 400 stars have b een seen to wobble in a manner indicating the presence of exoplanets. T o date, th e most prolific technique for detecting ex oplanets is the D oppler radial velocity “R V” technique. Rather than measuring the p osition of a star on the sky vers us time ( whic h w ould require extraordinary angular precision only no w b eing achiev ed) , this technique measures th e l ine-of-sight velo city of a star as a function of time—the to ward-and-aw ay wo bble rather than the side-to-side wobble. This is p ossible using h igh precision sp ectroscopic observ ations of lines in a star’s sp ectru m; the wa velengths of the lines shift v ery sligh tly in time du e to the Doppler effect. Radial velocities as small as a meter p er second ma y be accurately measured this w ay . The resulting data comprise a time series of velocities measured with add itive noise, and irregularly spaced in time. Figure 4 depicts a typical data set and the currently dominant analysis metho d . Figure 4a shows the velocity data; due to noise and the irregular spacing, the kind of p eriodic t ime dep end en ce exp ected from orbital reflex motion is not visually ev id ent, though it is clear something is going on that noise alone cannot account for. Figure 4b show s a Lom b-Scargle p erio dogram of the data. The resulting p ow er sp ectrum is very complex but has a clearly d ominant p eak. The p erio d corresp onding to the peak is used to initialize a χ 2 minimization algorithm th at attemp ts to fi t the data with a Keplerian orbit model, a strongly nonlinear model describing the motion as p erio d ic, planar, and elliptical. Figure 4c sho ws the d ata folded with resp ect to the estimated p erio d, with the estimated Keplerian velocity curve; an impressive fit results. F or some systems, the residuals are large, and further p erio dic comp onents may b e found by intera tive fitting of residuals, correspond ing to multiple-planet systems. This setting offers an interesting complement t o pulsar data analysis. In b oth problems, astronomers are searching for p eriodic signals. But for planets, there is a highly accurate parametric model for the signal. A lso, there is no p eriod d eriv ative to contend with, and the number of frequ encies to examine in a blind searc h is typicall y th ousands to hundreds of thousands, rather than many millions or a b illion (b ecause the highest frequencies of interest are far lo w er t han in th e pulsar case). As a result, although perio dograms are part of the astronomer’s to ol kit in b oth settings, in other resp ects, the data analysis metho dologies d iffer greatly . A num b er of challenges face astronomers analyzing exoplanet R V d ata with con- ven tional techniques. The lik elihoo d is highly multimodal, and in some cases n on - regular (e.g., for some orbital parameters, such as orbital eccen tricit y , the likelihood is maximized on a b ound ary of parameter space). The mo del is highly nonlinear. As a consequence, Wilks’s theorem is not v alid, and it b ecomes challenging to comput e confidence regions from χ 2 results. Astronomers seek to use the orbital mod els to estimate derived quantities such as planet masses, or to make predictions of future motion for futu re observ ation; propagation of un certain ty in such calculations is difficult. As noted ab ov e, th e LSP implicitly presumes a sinusoidal signal, which corresponds to circular motion. But man y exoplanets are found to b e in eccentric orbits, so the LSP is suboptimal for exoplanet detection. These challenges make it difficult to quantify uncertaint y in marginal detections. As a result, only systems with unambiguous detections are announced , and th e implications of data from thousands of examined systems with no obvious signal s remains unquantified. Fi- nally , muc h of t h e interesting astrophysics of exoplanet formation requires accurate inference of p opulation p rop erties, but results produ ced by conve ntional method s make it challengi ng to p erform accurate p opulation-level inferences. 18 T. J. L or e do System: HD 3651 P = 62.23 d e = 0.63 m sin i = 0.20 M_J a = 0.28 AU Figure 4 : Depiction of the con ventional R V data fitting pr oc ess, base d on data fr om star HD 3 6 5 1 , fr om Fischer et al. (2003). Several inve stigators h a ve ind ep endently turned to Ba yes ian method s to address these c hallenges (Loredo and Chernoff 2000, 2003; Cumming 2004; F ord 2005; Gre- gory 200 5; Balan and Lahav 2008). Here I will briefly describe ongoing work I am pursuing in coll ab oration with my astronomer colleague David Chernoff, and with statisticians Bin Liu, Merlise Clyde, and James Berger. The most nov el asp ect of our w ork applies the theory of Ba yesi an exp erimental design to th e problem of adaptive sche duli ng of observat ions of exoplanets. Exoplanet observ ations use state- of-the-art instrumentation; th e observ ations are exp ensive, and observers compete for time on shared telescope facilities . It is imp ortant to optimize use of these re- sources. This concern will b e even stronger for use of u p coming space-based facilities that will enable m easurement of the motion of the side-to-side p ositional wobble of nearby stars. O nly relatively recently h a ve simulation-based comp u tational tech- niques made it feasible to implemen t Ba yesian experimental d esign with nonlinear mod els (e.g., Clyde et al. 1995; M¨ uller and Parmigiani 1995a,b; M ¨ uller 1999). Ba yesi an exp erimenta l design is an application of Ba yesian decision theory , an d requires sp ecification of a utility function to guide d esign. A stronomers hav e v aried goals for exoplanet observ ations. Some are interested in detectin g individual sys- tems; others seek systems of a particular typ e (e.g., with Earth-like planets) and ma y wa nt to accurately predict p lanet p ositions for futu re observ ations (e.g., of The Pulsating S ky 19 transits of a p lanet across the d isc of its host star); others may b e interested in p opulation prop erties. N o single, tractable utility function can directly target all of these needs. W e t hus adopt an information-based utilit y function, as describ ed by Lindley (1956, 1972) and Bernardo (1979), as a kind of “general pu rp ose” utilit y . As a simple example, consider observ ation of an exoplanet sy stem with a single detected planet, with the goal of refin ing the p osterior distribution for t he orbital parameters, θ . D enote the currently av ailable data by D , and let M 1 denote the information sp ecifying the single-planet Keplerian orbit mo del. The current p oste- rior d istribu tion for t h e orbital parameters is then p ( θ | D , M 1 ) (we will sup press M 1 for the time b eing). F or an exp eriment, e , pro ducing future data d e , the up d ated p osterior will b e p ( θ | d e , D ); here e lab els the action space (e.g., the time for a future observ ation), and d e is the associated (uncertain) outcome. W e take the utilit y to b e the information in the up dated p osterior, quantified by the negative Shann on entrop y , I ( e, d e ) = Z dθ p ( θ | d e , D ) log [ p ( θ | d e , D )] (23) (using the Kullback-Leibler diverg ence b etw een th e original and up dated p osterior prod uces the same results; we use t h e Shannon entropy here for simplicity). The optimal exp eriment maximizes th e exp ected in formation, calculated by a verag ing o ver t h e uncertain v alue of d e ; E I ( e ) = Z dd e p ( d e | D ) I ( e , d e ) , (24) where the predictive distribu t ion for the future data is p ( d e | D ) = Z dθ p ( θ | D ) p ( d e | θ ) . (25) Calculating the exp ected information in equation (24) requires ev aluating a triply-nested set of integrals (tw o ov er the parameter space, and one ov er th e future sample space); we must then optimize t his o ver e . This is a formidable calcula- tion. Bu t a significant simplification is a v ailable in some settin gs. Sebastiani and Wynn (2000) p oint out that when the information in the future sampling distribu- tion, p ( d e | θ ), is ind ep endent of the choice of hypothesis (i.e., the parameters, θ ), the exp ected information simplifies; E I ( e ) = C − Z dd e p ( d e | θ ) log[ p ( d e | θ )] , (26) where C is a constant (measuring the e -indep endent informatio n in the prior and the sampling distribut ion). The in tegral (including the minus sign) is the Shannon entrop y in the predictive distribution. Th us the ex p erimen t that max imizes the exp ected information is the one for whic h the predictive distribution h as minimum information, or maxim um entrop y . The strategy of sampling in this optimal wa y is called maximum entr opy sampling (MaxEnt sampling). Col loq uially , this strategy sa ys we will learn the most by sampling where w e know the least, an ap p ealingly intuitiv e criterion. 20 T. J. L or e do As a simplified example, consider an R V data model with measurements giv en by d i = V ( t i ; τ , e , K ) + ǫ i , (27) where ǫ i denotes zero-mean Gaussian noise terms with k now n v ariance σ 2 , and V ( t i ; τ , e, K ) giv es the Keplerian v elocity along the line of site as a function of time t i and of the orbital p arameters τ (p erio d), e (eccentricit y), and K (velocity ampli- tude). F or simplici ty tw o add itional parameters required in an accurate mo del are held fixed: a parameter describing th e orbit orien tation, and a p arameter specifying the origin of time. The vel ocity function is strongly nonlinear in all v ariables excep t K (its calculation requires solving a famous transcendental equation, th e Kep ler equation; see Dan by 1992 for details). Our goal is to learn ab out the parameters τ , e and K . Figure 5 sho ws results from a typical simulation iterating an observ ation-inference- design cycle a few times. Figure 5a shows simulated data from a hypothet ical “setup” observ ation stage. Observ ations were made at 10 eq uispaced times; t he curve shows th e true orbit with typical exoplanet parameters ( τ = 800 d, e = 0 . 5, K = 50 ms − 1 ), and the noise distribution is Gaussian with zero mean and σ = 8 m s − 1 . Figure 5b shows some results from the inference stage using these data. Sh own are 100 samples from th e marginal p osterior density for τ and e (ob - tained with a simple but inefficient accept/reject algorithm). There is significant uncertaint y that would not b e wel l appro ximated by a Gaussian (even correlated). Figure 5c illustrates the design stage. The thin curves d ispla y the uncertaint y in the predictive d istribu t ion as a function of sample time; they sho w the V ( t ) curves associated with 15 of the parameter samples from the inference stage. The spread among these curves at a p articular time displa ys the uncertaint y in the p redictive distribution at that time. A Mon te Carlo calculation of the exp ected information vs. t (using all 100 samples) is plotted as th e thick curve (righ t axis, in b its, offset so the minimum is at 0 bits). The curve p eaks at t = 1925 d, the time used for observing in the next cycle. Figure 5d shows interim results from the inference stage of the n ext cycle after making a single simulated observ ation at the optimal time. The p erio d u n certaint y has decreased by more th an a factor of tw o, and the prod uct of the p osterior standard deviations of all three parameters (a crude measure of “p osterior volume”) has decreased by a factor ≈ 5 . 8; this w as accomplished by incorp orating the information fr om a single wel l-chosen datum . Figures 5e,f show similar results from the next tw o cycles. The p osterior volume contin u es to decrease muc h more rapidly than on e w ould exp ect from the random-sampling “ √ N rule” (by factors of ≈ 3 . 9 and 1 . 8). T o implement t his approac h with the full Keplerian R V mo del requ ires a non- trivial p osterior sampling algorithm. O ne p ip eline we hav e developed is inspired b y the con ven tional LSP+ χ 2 technique. A s a starting point, w e use the fact th at the Keplerian velocity mod el is a sep ar able nonlinear mo del, which may be reparame- terized as a linear sup erp osition of t w o nonlinear comp onents. W e can analytically marginalize ov er the tw o linear parameters, pro ducing a marginal likelihood for three nonlinear parameters: τ , e , and an origin-of-time parameter, µ 0 (an angle denoting the orbit orien tation at t = 0). W e eliminate e and µ 0 , either by crude qu adrature, or by using heuristics from F ourier analysis of the Keplerian mo del to estimate val - ues from a simple harmonic fit to the d ata. This p rodu ces an appro ximate marginal lik elihoo d for p erio d t hat we call a Kepler p erio do gr am (K- gram). It plays the role of the LSP in the conv entional analysis, but accoun ts for orbital eccentricit y . The Pulsating S ky 21 Figure 5 : Initi al observations (a, top left) , interim infer ences (b , t op mid- dle) , and design stag e (c, top righ t) for a simulated observ ation-infer ence-design cycle implementing adaptiv e design for a simplifie d e c c entric ex oplanet mo del. (d– f, bottom) Evolution of infer ences in subsequent cycle s. The K-gram (multiplied by a log-flat p rior in p erio d) is an approximate marginal density for the p eriod. Rather than use a p eriodogram p eak t o in itialize a χ 2 param- eter fit, we dra w ∼ 10 to 20 samples from the K- gram to define an initial p opulation of candidate orbits. Finally , w e evolv e the p opulation using a p opulation-based adaptive MCMC algorithm. Our current pip eline u ses the differential evolution MCMC algorithm of T er Braak (2006). When applied to sim ulated and real data for systems with a single, well -detected exoplanet, this p ip eline pro duces p osterior samples m uch more efficiently than other recently-developed algorithms (e.g., the random w alk Metropolis algorithm of F ord 2005, or the parallel temp ering algorithm of Gregory 2005). The success of the algorithm app ears due t o the “smart start” provided by the K-gram, and the adaptivity of p opulation-based MCMC. How ever, this pip eline has limitations that ha ve led us to explore more thor- oughgoing departures from existing algorithms. The first limitation is t hat when there is significan t m ultimo d alit y (i.e., more th an one mo de with significant poste- rior p rob ab ility), our popu lation-based sampler explores parameter space muc h less efficien tly due to the difficulty of swapping b etw een mo des. The second limitation is more fun damental. So far, we ha ve fo cused on adaptive design for parameter estimation, presuming the stellar target is known to host a star. In fact, initially we will not kn o w whether a star hosts a planet or not; we initially need to opt imize for dete ction (i.e., mo del comparison), not estimation. Even after a planet is detected, while w e w ould like fut ure observ ations to improv e the orbital parameter estimates, w e would also like the observ ational design to consider the p ossibilit y that an additional planet may b e p resent. T o pursue more general design goals, we in tro duce a set of mo dels, M k , with k planets ( k = 0 to a few), with asso ciated parameter spaces θ k . W rite the join t p osterior for the mo dels and their parameters as p ( M k , θ k | d e , D ) = p ( M k | d e , D ) p ( θ k | d e , D , M k ) ≡ p k q k ( θ k ) , (28) 22 T. J. L or e do where p k is the p osterior probability for M k , and q k ( θ k ) is the p osterior density for the parameters of model M k . Then the information in the join t p osterior is, I [ M k , θ k | D ] = X k Z dθ k p k q k ( θ k ) log[ p k q k ( θ k )] (29) = X k p k log p k + X k p k Z dθ k q k ( θ k ) log q k ( θ k ) . (30) The first sum in equ ation (30) is th e information (negative entrop y) in the p osterior o ver the mod els; the second sum a verages the information in the v arious p osterior densities, weigh ted by the mo d el probabilities. Once the data b egin to focus on a particular mo del (so one of the p k v alues approaches un it y and the others approach zero), the first term will n early vanish, and the sum comprising the second term will b e dominated by the term q uantifying the informatio n in the p osterior den sity for the b est mo del. That is, th e p arameter estimation case described ab ov e is reco v- ered. When mo del uncertaint y is signfican t, the first term pla y s a significan t role, allo wing mo del uncertaint y to drive th e design. This u t ilit y thus naturally mov es b etw een opt imizing for detection and for parameter estimation. W e hav e found that Borth (1975) derived essen tially t he same criterion, dubb ed a total entr opy criterion , though it has gone unused for decades, presumably b ecause the requ ired calculations are c hallenging. Three features make use of th is more general criterion significantly more c h al- lenging than MaxEnt sampling. First, m o del probabilities are n eeded, requiring calculation of marginal lik eliho o ds (MLs) for the models. MCMC metho ds do not directly estimate MLs; they must b e sup p lemented with oth er techniques, or MCMC must b e abandoned for another approach. Second, the condition leading to th e Max- Ent simplification in the parameter estimation case—that the entropy in t h e predic- tive distribut ion not dep end on the choice of hypoth esis—does n ot hold when th e hypothesis sp ace includ es comp osite hypotheses (marginaliza tion ov er riv al mo dels’ parameter spaces breaks the condition). Finally , for adaptive design for parameter estimation ab ov e, we adopted a greedy algorithm, optimizing on e step ahead. F or mod el choice, it is typically th e case that non-greedy designs significan tly out- p erform greedy designs (more so th an for parameter estimation). This significantly complicates the optimization step. Motiv ated b y t hese c h allenges, we h ave d evelo p ed an alternative compu tational approac h that aims to calculate marginal likel iho ods directly , pro du cing p osterior samples as a bypro duct: anne aling adaptive imp ortanc e sampling (A AIS). This al- gorithm ann eals a target distribution (prior times lik elihoo d for a particular mo del), and adapts an imp ortance sampler built out of a mixture of multiv ariate Student- t distributions to the sequence of ann ealed targets, using techniques from sequen- tial Monte Carlo. The number of comp onents in the mixture adapts via birth, death, merge and split op erations; the parameters of each comp onent adapt via exp ectation-maximization algorithm steps. The algorithm currently w orks well on sever al published data sets with multimodal p osteriors and either one or tw o planets. A forthcoming publication (Liu et al. 2011) provides details. 5. PERSPECTIVE I hav e highlighted here only tw o among many areas in astronomy where astronomers study p eriodic ph enomena. So far Bay esian metho ds are relativel y new for such The Pulsating S ky 23 problems. I k now of only tw o other app lications where astronomers are studying p eriodic p h enomena with Ba yesian metho ds: Berger et al. ( 2003) address nonpara- metric modeling of Cepheid v ariable stars that are used to measure distances to nearby gala xies (via correlation betw een luminosity and p erio d); and Brewer et al. (see White et al. 2010 and references therein) address detection and estimation of lo w-amplitude, nearly-p erio dic oscillations in stellar luminosities (asteroseismo logy). Broadening the p ersp ective b eyond p erio dic phenomena, astronomy is on the verge of a revolution in the amount of time-d omain data av ailable. Within a decade, what w as once the science of the fixed stars will b ecome a thoroughly time-domain science. While muc h time-domain astronomy to date h as come from targeted ob- serv ations, u p coming large-scale surveys will so on pro duce “whole-sky time-lapse mo vies” with many-ep och m ulti-color observ ations of hundreds of millions of sources. The p rime examp le is th e L ar ge Synoptic Survey T elesc op e , whic h will b egin pro- ducing such d ata in 2019 . Hop efully the v astness and richness of the n ew data will encourage further developmen t of Bay esian tools for exploring the dynamic sky . In this decade marking dramatic growth in the importance and public visibilit y of time-domain astronomy , it is p erh aps n ot surp rising to find contemporary writers relinquishing stars as symbols of steadfastness; th ey are instead symbols of enduring mystery . I n her p o em, “S t ars” (Manfred 2008), Wisconsin-based p o et F reya Manfred depicts a moment of ex asperation at life in a mercurial w orld, with the p o et finding herself “past hanging on.” On e t hing is able to distract h er from the v agaries of daily life —not t h e illusory steadfastness of the once fixed stars, b u t the enigma of the pulsating sky: But I don’t care about y our birthday , or Christmas, or lov er’s lane, or even you, n ot as much as I pretend. Ah, I wa s ab out to say , “I don’t care about the stars” — bu t I had to stop my p en. Sometimes, out in the silen t black Wisconsin countryside I glance up and see everything that’s not on earth, glowi ng, pulsing, eac h star so close to the next and yet so far aw ay . Oh, the stars. In lines and curves, with fainter, more mysteri ous designs b eyond, and again, b eyond. The longer I look, the more I see, and the more I see, the deep er the universe grows . REFERENCES Abdo, A. A. et al. (2010). The First F ermi Large Area T elescop e Catalog of Gamma-Ray Pulsars. Astr ophys. J. Supp. Se r. 18 7 , 460–494. At woo d, W. B., Ziegler, M., Johnson, R. P . and Baughman, B. M. (2006) . A Time-differencing T ec hnique for Detecting Radio-quiet Gamma-Ray Pulsars. Astr ophys. J. 652 , L49–L52. Balan, S. T. and Lahav , O. (2008). EXOFIT: orbital parameters of extrasolar pl anets from radial v elo cities. Mon. Not. R oy. Ast. So c. 394 , 1936–1944. Berger, J. O., Jefferys, W. H., M ¨ u ller, P . and Barnes, T. G. (2003). Bay esian model selection and analysis for Cepheid star oscillations. Statistica l chal lenges i n astr onomy (E. D. F eigelson and G. J. Babu, eds.) New Y ork: Spri nger, 71–88. Bernardo, J. M. (1979). Exp ected inf ormation as exp ected utilit y . A nn. Statist. 7 , 686–690. Bick el, P ., K leijn, B., Ri ce, J. (2008). W eight ed T ests for Detecting Periodicity in Photon Arriv al T i mes. Astr ophys. J. 685 , 384–389. 24 T. J. L or e do Bick el, P . J., Ritov, Y. , Stok er, T. M. (2006) . T ailor- made tests f or go o dness of fit to semiparametric hypotheses. A nn. Statist. 34 , 721–741. Borth, D. M. (1975) . A total entrop y criterion for the dual problem of mo del determination and par ameter estimation. J. R oy. Statist. So c . B 37 , 77–87. Bretthorst, G. L. (1988). Bayesian Sp e ctrum Analysis and Par amete r Estimation . Berlin: Springer-V erlag. Bretthorst, G. L. (2001). Nonuniform sampling: Bandwidth and aliasing. Bayesian Infer enc e and Maximum Entr opy Met ho ds in Scienc e and Engine ering (J. Ryc hert, G. Erickson and C. R. Smith, eds.). New Y ork: Am er ican Inst. of Ph ysics, pp. 1–28. Clyde, M. , M ¨ uller, P . and Parmigiani, G. (1995 ). Exploring exp ected util ity sur faces by marko v c hains. ISDS Discussion Paper 95-39, Duke Universit y . Collura, A. , M aggio, A., Sciortino, S., Serio, S. , V aiana, G. S. and osner, R. (1987) . V ari abil ity analysis in low count rate sources. Astr ophys. J. 3 15 , 340–348. Connors, A. (1997). Periodic analysis of time seri es data as an exemplar of Bay esian methods. Data An alysis in Astr onomy (V. Di Gesu, M. J. B. Duff, A. Hec k, M. C. Maccarone, L. Scarsi and H. U . Zimmerman, eds.). Singap ore: W orld Scientific Press, 251–260. Cumming, A. (200 4). Detect ability of extrasolar planets in radial velocit y surveys. Mon. Not. R oy. Ast. So c. 354 , 1165–1176. Dan by , J. M . A. (1992). F undamentals of Celestial Mecha nics . Ric hmond, V A: William-Bell , Inc. Diaconis, P . and Engel (1986). Comment on ‘Application of P oisson’s W ork’. Statist. Scienc e 1 , 171–17 4. Fische r, D. A., Butler, R. P ., M arcy , G. W., V ogt, S. S., Henry , G. W. (2003). A sub-Saturn mass planet orbiting HD 3651. Astr ophys. J. 590 , 1081–1087. F reedman, D. (2009). Diagnostics canno t ha ve muc h pow er against general alternatives. Int. J. F or ec asting 25 , 833–839. F ord, E. (2005). Quantifying the uncertaint y in the orbits of extrasolar planets. Astr onomic al J. 129 , 1706–1717. Gregory , P . (2005). A bay esian analysis of extrasolar planet data for HD 73526. Astr ophys. J. 631 , 1198–121 4. Gregory , P . and Loredo, T. J. (1992). A new method for the detection of a p erio dic s i gnal of unkno wn shape and p erio d. Astr ophys. J. 398 , 148–16 8. Gregory , P . and Loredo, T. J. (1996). Bay esian perio dic signal detection: Analysis of ROSA T observ ations of PSR 0540 − 693. Astr ophys. J. 473 , 1059–1056 . Hopkins, A. M . et al. (2002). A new source detection algori thm using the false-discov ery rate. Astr on. J. 123 , pp. 1086–10 94. Janssen, A. (2000). Global p ow er functions of goo dness of fit tests. Ann. Statist. 28 , 239–253. Ja ynes, E. T. (1987). Bay esian sp ectrum and ch irp analysis. Maximum Entr opy and Bayesian Sp ectr al A nalysis and Estimation Pr oblems (C. R. Smith and G. J. Erickson, eds.) Dordrech t: D. Reidel, 1. Lehmann, E. L., Romano, J. P . (2005). T est ing Stati stic al Hyp otheses . New Y ork: Springer. Lewis, D. A . (1994). W eak p erio dic signals in p oint pro cess data. Statistic al metho ds for physic al scie nc e, Metho ds of Exp e rimental Physics V ol. 28 (J. L. Stanford and S. B. V ardeman, eds.) San Diego: A cademic Press, 349–373. Lindley , D. V. (1956). On a measure of the infor mation prov ided by an exp eriment. Ann. Math. Statist. 27 , 986–1005. Lindley , D. V. (1972). Bayesian Statistics—A R eview . M ontpelier: SIAM/Capital City Press. The Pulsating S ky 25 Liu, B., Clyde, M., Berger, J. O., Loredo, T. J., Chernoff, D. C. (2010). An adaptive annealed imp ortance sampling method for calculating margi nal lik eliho ods with application to ba yesian exoplanet data analysis. In preparation. Lomb , N . R. (1976). Least-squares frequency analysi s of unequally spaced data. Astr ophys. Sp. Sci. 39 , 447–462. Loredo, T. J. (1992a ). The promi se of Bay esian inference for astroph ysi cs. (Unabridged v ersion of Loredo 1992b) http://c iteseerx.i st.psu.edu/viewdoc/summary?doi=10.1.1.56.1842 , 1–49. Loredo, T. J. (1992b) . The promi se of Bay esian inference f or astrophy sics. Statist ic al Chal lenges in Mo dern Astr onomy (E. F eigelson and G. J. Babu, eds.) New Y ork: Springer-V erlag, 275–306 (with discussion). Loredo, T. J. (1993) . Bay esian inference with l og-F ourier arriv al time m o dels and eve nt lo cation data. T ec hnical rep ort. http:/ /www.astr o.cornell.edu/staff/loredo/ Loredo, T. J. and Chernoff, D. C. (2000). Ba yesian methodology for the space int erferometry m ission. Bul l. Am. Astr on. So c. 32 , 767. Loredo, T. J. and Chernoff, D. C. (2003). Ba yesian adaptiv e exploration. Statistic al chal lenges in astr onomy (E. D . F eigelson and G. J. Babu, eds.) N ew Y ork: Springer, 57–70. Loredo, T. J. (2004) . Bay esian adaptiv e exploration. 23r d International Workshop on Bayesian Infer enc e and Maximum Entr opy Metho ds in Sc ienc e and Engine e ring (G. J. Erickson and Y. Zhai, eds.) New Y ork: AIP Conference Pro ceedings bf 707, 330–346. Manfred, F. (2008). Swimming with a Hundr e d Y e ar Old Snapping T urtle . Northfield, MN: Red Dragonfly Press. Meinshausen, N., Bic ke l, P . and R ice, J. (200 9). Efficien t blind search: Optimal p ow er of detect ion under computational cost constraint s. A nn. Appl. Stat. 3 , 38–60. M ¨ uller, P . and Pa rmigiani, G. (1995a). Numerical ev aluation of information theoretic measures. Bayesian Statistics and Ec onometrics: Essays in Honor of A. Zel lner (D. A. Berry , K. M. Chaloner and J. F. Gewe ke , eds.) New Y ork: Wiley , 397–406. M ¨ uller, P . and Pa rmigiani, G. (1995b). Optimal design vi a curve fitting of m on te carlo experiments. J. Amer. St atist. Asso c. 90 , 1322–1 330. M ¨ uller, P . (1999). Sim ulation based optimal design. Bayesian Statistic s 6 (J. M. Bernardo, J. O. Berger, A. P . Dawid and A. F. M. Smith, eds.) Oxford: U nive rsity Press, 459–474. Orford, K. J. (2000) . The analysis of cosmic ray data. J. Phys. G: Nucl. Part. Phys. 26 , R1–R26. Scargle, J. D. (1982) . Studies i n astronomical time series analysis. I I - Statistical asp ects of sp ectral analysis of unev enly spaced data. Astr ophys. J. 26 3 , 835–853. Sc h uster, A. (1898) . On the inv estigation of hidden per io di cities with application to a supposed 26 day peri od of meteorological pheno mena. T errestrial Magnetism and Atmo spheric Ele ctric ity 3 , 13–41 Sebastiani, P . and Wynn, H. P . (2000). M aximum Entrop y Sampling and Optimal Ba ye sian Exp erimental Design. J. R oy. Statist. So c. B 62 , 145–157. T er Braak, C. J. F. (2006). A Mark o v chain Monte Carlo version of the genetic algori thm differen tial Evolution: Easy Ba yesian computing f or real parameter spaces. Statist. Computing 16 , 239–249. White, T. R. , Brewer, B. J., Bedding, T. R., Stello, D. and Kjeldsen, H. (2010). A comparison of Bay esian and F ourier m ethods for frequency determination in asteroseismology . Comm. i n Aster oseismolo gy 161 , 39–53. 26 T. J. L or e do Resp onse to discussion b y Pe ter M ¨ uller As a non-statistician interloper of sorts, I am grateful to the organizers for t he privilege of b eing invited to p articipate in this last V alencia meeting, and for assign- ing me so effective (and gracious) a discussant. Prof. Peter M ¨ uller presents a num b er of useful new ideas and clarifying questions in his deceptively short discussion. I will touch on a selection of his p oints in this resp onse; limits of space provide me a conv enient excuse for postp oning the address of other imp ortant p oints for another forum where I may hav e “pages enough and time” to explore M¨ uller’s suggestions more fully . F or the pulsar detection problem, M¨ uller suggests c hanging the prior to a sym- metric Dirichlet prior with a small ex p onent in order to fav or light curve shap es with spikes. With a similar motiva tion, in the pap er I prop osed adopting a divisible Diric hlet prior, say with α = 2 / M for the M -b in shap e mo del. This b ecomes a small- α prior once M is larger than a few. Preliminary calculatio ns indicate this is a promising d irection, but not entirely satisfactory . Figure 6 shows, as a fun ction of num b er of b ins, the Bay es factor for a model using the divisible prior versus one us- ing th e Gregory & Loredo flat prior, for three representativ e typ es of d ata. F or data distributing even ts uniformly across the bins, t he (red) squares show that adopting the divisible prior allo ws one to more securely reject p erio dic mod els. F or d ata plac- ing all even ts in a single-bin pulse, the (blue) diamonds sho w th at the divisible prior results in dramatically increased sensitivit y to p ulsations. How ever, as is ev ident in Figure 1 in the pap er, gamma-ra y pu lsations typically ride on top of a constant backgro und comp onent. A dding such a component to th e single-bin pulse d ata (at abou t 9% of the pulse level) pro duces the Ba yes factors indicated by the (green) circles; these indicate less sensitivit y to p u lsations with the divisible prior than with the fl at prior. Small- α priors put prior mass on truly spiked signals, with all events in ve ry few bins. This preference has to b e temp ered in order to realisti cally mo del pulsar light curves with a background component. I am exploring how to achiev e this, follo wing some of M¨ uller’s leads. M¨ uller raised q u estions about treatment of tw o parameters in the semiparametric pulsar ligh t curve model: the pulse phase, φ , and the frequ ency , f . R igh tly n oting that the shap e prior is shift-inv arian t, h e asks if φ may b e eliminated altogether. But the likel iho o d is n ot shift-inv ariant. F or example, for a particular choi ce of M , there could b e a pulse that is, say , nearly exactly tw o bins wide. Dep en ding on φ , the eve nts from this pulse may b e concentrated in tw o bins, or spread out o ver three; the former case has higher likel ihoo d. Regarding frequency , M ¨ uller asks, why not “treat the unk nown p eriod as an- other parameter.” This p oints to a wea kness in my description. F rom a probabilis- tic p oint of view, the frequency is handled as a parameter in t he same mann er as other parameters. The commen ts at the end of Section 2, regarding the contrast b etw een Bay esian marginalization ov er frequency and frequentist maximization ov er frequency , extend to how we treat frequ ency uncertaint y in b oth the pulsar and ex- oplanet problems. It just happ ens that there is so muc h structure in the frequ en cy dimension (nearly as many mo d es as F ourier frequencies), that something like ex- haustive searc h is the b est w a y we currently know of for making sure we find th e dominant mo des among the dense forest of mo des. I say “something like exhaustive searc h” b ecause there are clever wa ys to ex p lore the frequency parameter without doing the naive searc h describ ed b efore equation (10). At w oo d et al. (2006) show how t o u se time-difference tapering to do the search efficiently; Meinshausen et al. The Pulsating S ky 27 Figure 6: Bayes factors for M -bin stepwise light cu rve models with divisible Dirichlet priors ( α = 2 / M ) vs. mo de ls with flat priors, for thr ee typ es of r epr e- sentative light curve data: from a flat light curve (re d squa res), fr om a pulse light curve placing al l photons in a single phase bin (blue diamonds), and fr om a pulse light curve with a flat b ac kground ≈ 9 % of the pulse amplitude. (2009) describ e a more complex bu t p otential ly more p o w erful and general approac h com bining tap ering with dy n amic programming to maximize p ow er sub ject to com- putational resource constraints (and incidentall y sho wing how muc h may b e gained by having statisticians work on the problem). In the pulsar problem, th e mode forest is to o dense for exploration using standard Monte Carlo meth od s. But for the exoplanet problem, Gregory (2007) has successfully used parallel temp ering for frequency searc h ; it req uires millions of likelihoo d eval uations, indicating it would b e unfeasible for pulsar blind searching ( where t he num b er of mod es is v astly larger). F or the exoplanet adaptive scheduling p roblem, M ¨ uller suggests m -step lo ok ahead pro cedures ma y out-p erform our myopic pro cedure, an issue that has con- cerned our exoplanet team but which we have yet to significantly explore. The sequential design folklore that has motiv ated our efforts to date is that, for param- eter estimation, m -step look ahead tends not to y ield significan t gains o ver myopic designs, but th at for mo del comparison, few-step lo ok ahead can p erform signifi- cantl y b etter than my opic design. W e hav e devised a heuristic few-step lo ok ahead approac h for th e mod el compariso n problem of planet detection, but we cannot sa y yet h o w muc h it gains us ove r my opic designs. The earliest ex pression of the folklore that I hav e come across is a pap er by Chern off on sequential design (Chernoff 1961). He observes: “The sequential exp erimentation problem for estimation. . . seems to b e substantial ly th e same p roblem as that of fi nding ‘locally’ optimal exp eriments. . . . On the other hand the sequential exp erimentation problem of testing hyp otheses does not degenerate and is b y no means trivial.” It wo uld be v aluable t o hav e more theoretical insight into the folklore, particularly from a Ba yes ian p ersp ective. 28 T. J. L or e do Finally , M ¨ uller offers qu estions and suggestions p ertaining to the choi ce of utility for orbit estimation and for hand ling model uncertaint y (planet detection). Since the observ ations will u ltimately be used by v arious inv estigators for different purp oses, some generic measure of information in the p osterior distribution seems ap p ropri- ate, though with the future use of inferences b eing somewhat v ague, there cannot b e any single “correct” choice . Our use of Kullback-Leibler divergence (or, eq uiv alently here, Shan n on entro py) is motiv ated by the same intuitio n motiv ating M¨ uller’s sug- gestion to u se precision (which I take to mean inver se v ariance): we w ant the data to tell u s as muc h ab out the parameters as p ossible. Precision d oes not app eal to us b ecause exoplanet p osterior distributions can b e complex, with significan t skewness, nonlinear correlations, m ultiple mo des, and mod es on b ound aries of t h e parameter space (esp ecially for orbital eccentri city , b ounded to [0 , 1) and often near a b ound - ary for physical reasons). In th is setting, precision seems an in ad eq uate summary of uncertaint y . In the limit where the p osterior is unimo dal and approximately normal, the entropic measures b ecome the logarithm of t he precision (in the mul- tiv ariate sense of determinant of th e inverse co v ariance m atrix) . W e thus think of these measures as providing a kind of “generalized precision.” Noting that the total en tropy criterion for th e join t estimation/mo del compari- son p roblem reduces to separate terms for mo del and parameter uncertaint y , M¨ uller suggests generalizing the criterion t o enco de an explicit tradeoff b etw een th e esti- mation and model c hoice tasks. This is an intriguing idea. At the moment I cann ot see obvious astrophysical criteria th at w ould enable quantification of such a tradeoff. But M ¨ uller’s suggestion, along with his observ ation that sampling cost is not in our form ulation, present me an opp ortunity to clarify how complex the actu al observing decisions are for astronomers. Mission planners for space-based missions, or telescop e allocation committees (T ACs) for ground-based observ atories, must schedule observ ations of many sources. F or exoplanet campaigns, t h ey will b e considering as-yet u n examined sy stems, and systems known to hav e a planet bu t with d iverse co vera ge of prior data. Most exoplanet campaigns share telescopes with observers pursuing completely differen t science. Schedulers must make tradeoffs b etw een science goals within the exoplanet campaign, and b etw een it and competing science. There are costs associated with observ ations, b ut th ere are other nontrivial constraints as well, such as w eather patterns and the phase of the moon (“dark time” near the new mo on is at a premium; dimmer sources may b e observed then). In princip le one could imagine formal form ulation of t he decision problems facing m ission planners and T ACs, taking all of these complications in to account via ut ilities or losses. This ma y be a worth while exercise for a focu sed mission (e.g., devoted solely to exoplanet observ ations); in more general settings the criteria are probably to o h op elessly sub jective to allow quantification. In all of these settings, we th ink it would b e u seful for exoplanet observers to b e able to pro vide exp ected information gain versus time calculations, simply as one useful inpu t for complex scheduling decisions. M ¨ uller’s description of our approac h as a “useful default” is more apt than he may hav e realized. Sequential design is relatively new to astronomy; w e hop e w e can follow u p on some of M¨ uller’s insigh tful suggestions as the field mov es b eyond these starting p oints. REFERENCES F OR DISCUSS ION Chernoff, H. (1961 ). Sequen tial Exper iment ation. Bul l. Int. Stat. Inst. 38 (4), 3–9. Gregory , P . C. (2007) . A Bay esi an Kepler p erio dogram detec ts a second planet in HD 208487. M on. Not. R oy. Astr on. So c. 374 , 1321–133 3.
Original Paper
Loading high-quality paper...
Comments & Academic Discussion
Loading comments...
Leave a Comment