On the unmixing of MEx/OMEGA hyperspectral data
This article presents a comparative study of three different types of estimators used for supervised linear unmixing of two MEx/OMEGA hyperspectral cubes. The algorithms take into account the constraints of the abundance fractions, in order to get ph…
Authors: Konstantinos E. Themelis, Frederic Schmidt, Olga Sykioti
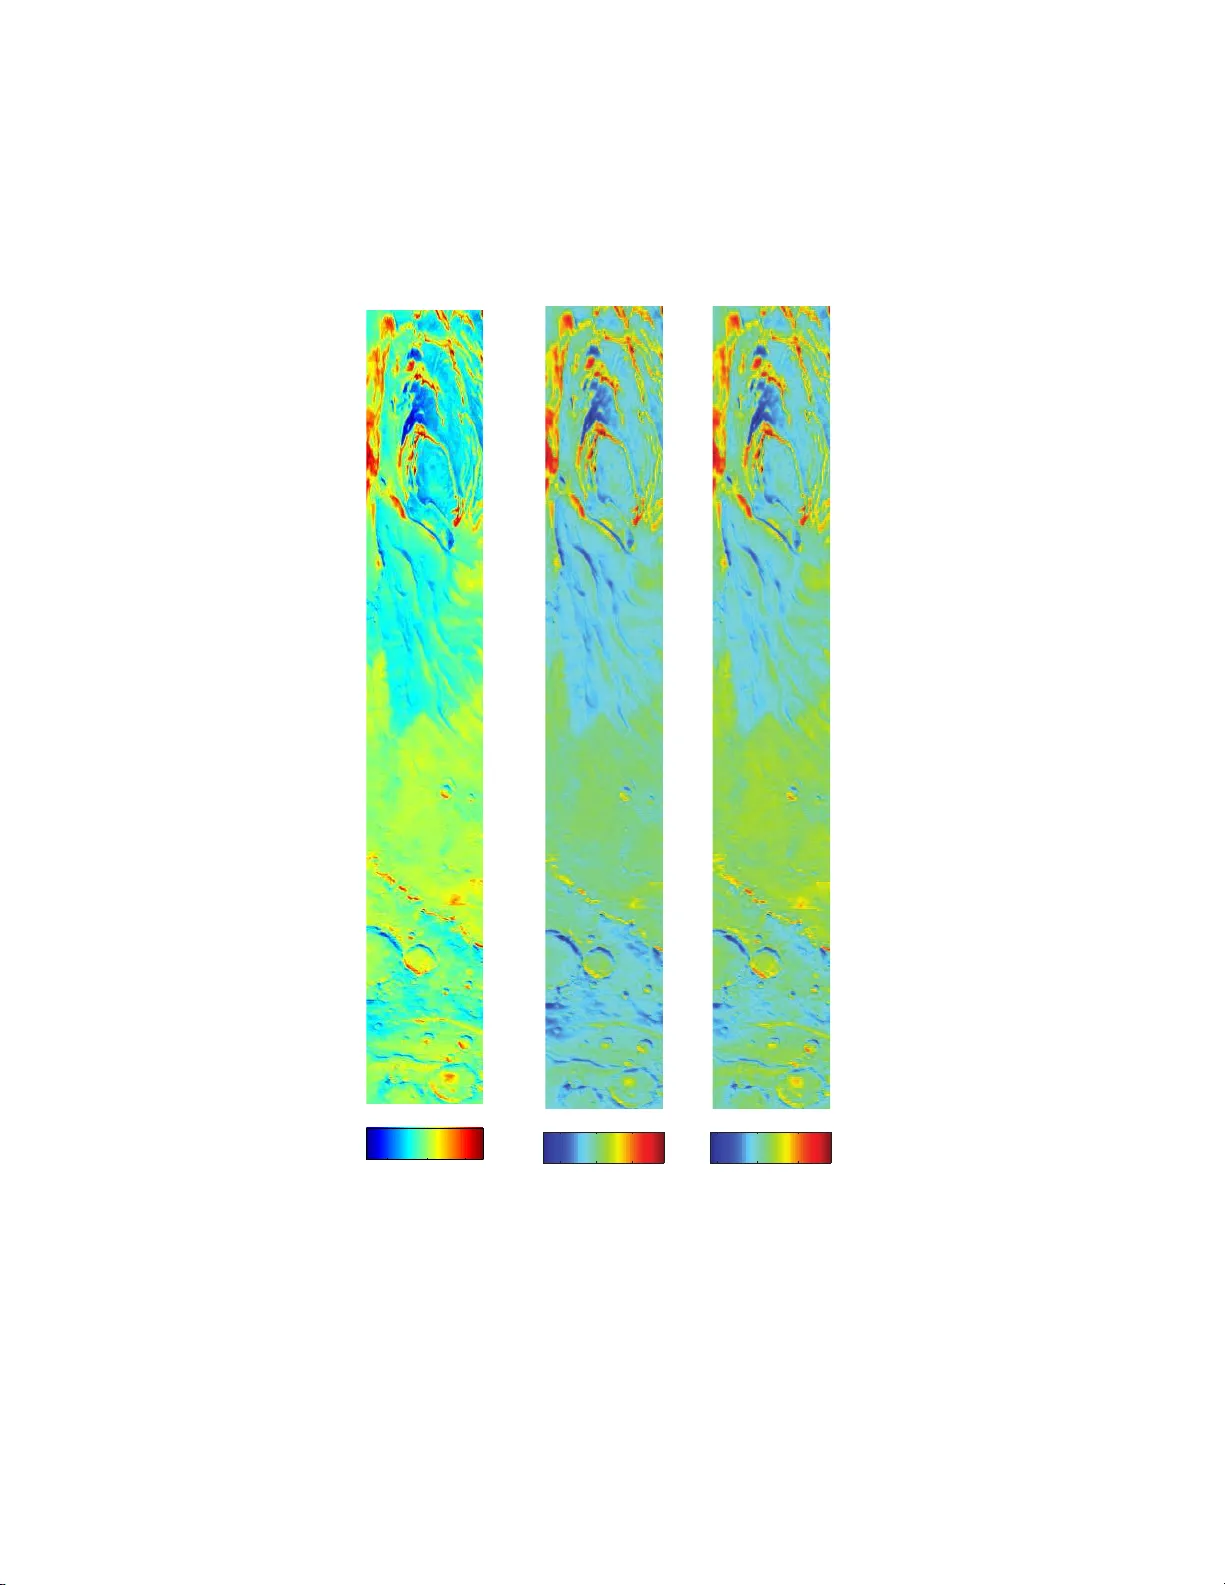
On the unmixing of MEx/OMEGA h yp ersp ectral data Konstan tinos E. The melis a,b , F r ´ ed ´ eric Sc hmidt c,d , Olga Sykioti b , Athanasios A. Rontogiannis b , Konstan tinos D. Koutroumb a s b , Ioannis A. Da glis b a Dep artment of Inf ormatics and T ele c ommun ic ations, University of A thens, Ilissia, 157 84 A thens, Gr e e c e b Institute for Sp ac e Appli c ations and R emote Sensing, Nationa l O bservatory of Athens, 152 36, P. Penteli, Gr e e c e c Univ. Paris-Sud, L ab or atoir e ID ES, UMR 8148, Orsay, F-91405, F r anc e d CNRS, Orsay, F-91405, F r anc e Abstract This article presen ts a comparative study of three different t yp es of estima- tors used for sup ervised linear unmixing of tw o MEx/OMEGA h yp ersp ectral cub es. The algorithms tak e into accoun t t he constrain ts of the abundance fractions, in order to get phys ically interpretable results. Abundance maps sho w that the Bay esian maximum a p osteriori probability (MAP) estimator prop osed in Themelis and Ron tog ia nnis (2008) outp erforms the other tw o sc hemes, offering a compromise b et w een complexit y and estimation p erfor- mance. Th us, t he MAP estimator is a candidate algorithm t o p erform ice and minerals detection on large h yp ersp ectral datasets. Keywor ds : Hyp ersp ectral imagery , sup ervised unmixing, OMEGA data , Mars Express Email addr esses: th emelis @spac e.noa.gr (Konstantinos E. Themelis), freder ic.sc hmidt@u-psud.fr (F r´ ed´ eric Sc hmidt), syki oti@sp ace.n oa.gr (Olga Sykioti), tr onto@ space. noa.gr (A tha na sios A. Ro n to g iannis), kout roum@ space. noa.gr (Konstantinos D. Ko utroumbas), daglis@ space. noa.gr (Ioannis A. Dag lis) Pr eprint submitt e d to Planetary and Sp ac e Scienc e Novemb er 3, 2018 1. In t ro duction The surface of Mars is curren tly b eing imaged with a com binat io n of high sp ectral and spatial resolution. This give s the a bilit y to detect and map c hemical comp onen ts on the Martian surfa ce and atmosphere more ac- curately than b efore. Spectral unmixing (SU) is one of the tec hniques cur- ren tly used for this purp ose, Kesha v a a nd Mustard (2002); Moussaoui et a l. (2008); Sc hmidt et al. (201 0). SU is the pro cedure by whic h the measured sp ectrum of a mixed pixel is decomp osed into a n umber o f constituen t sp ec- tra, called endmem b ers, and the corresp onding fractions, or a bundances, that indicate the prop ortion of the presence of eac h endmem b er in the pixel, Kesha v a and Mustard (2002). Linear SU, whic h a dopts the h yp othesis that the sp ectrum of a mixed pixel is a linear combination of its endmem b ers’ sp ectra, is more commonly used in practice. Based on a ph ysical in terpre- tation, tw o hard constrain ts are imp osed on the abundance fractions of the materials in a pixel; they should b e non-negative and sum to one. Sev eral SU tec hniques for the unmixing of OMEGA (Observ ato ire p our la Min ´ eralogie, l’ Eau, les Glaces et l’ Activit´ e hypersp ectral images), Bibring et al. (2004), hav e b een recen tly prop osed in the bibliography . These tec hniques can b e categorized in to unsup ervised, where a special pro cedure is first ex- ecuted to get the endmem b ers’ sp ectral signatures fro m the image, and su- p ervised, where a priori kno wledge of the image endmem b ers is av a ilable. A recen t example o f an unsup ervised tec hnique is the Ba yes ian source sepa- ration metho d, dev elop ed in Schmidt et al. (2010). This tec hnique is based on a Gibbs sampling sc heme to p erform Bay esian inference. Due to its high computationally complexity , a sp ecial implemen tation strategy is dev elop ed 2 for its application to a complete OMEGA image da t a set, Sc hmidt et al. (2010). Band ratio is the most commonly used sup ervised tec hnique to detect minerals (Bibring et al. (200 4); Bibring et al. (2004); Langevin et a l. (2005)). Ho w eve r some multiple endmem b er linear sp ectral unmixing a lgorithms ha v e b een prop osed suc h as MELSUM, Com b e et al. (2008). MELSUM uses a reference library con taining v arious spectral signatures of minerals (used as endmem b ers), a nd is based on the classical sp ectral mixture analysis (SMA) algorithm. In Ka nner et al. (20 07), a mo dified Gaussian mo del ( MG M) has b een exploited to estimate the fractional abundances o f a comp ositionally div erse suite o f pyro xene sp ectra in the martian surface. A w av elet based metho d has also b een applied f or the unmixing of h yp ersp ectral mart ian data in Gendrin et al. (2006); Sc hmidt et al. (2007). In this pap er, w e f o cus on the problem of sup ervised SU. Our main ob- jectiv e is to estimate the abundances of the endmem b ers that are presen t in t w o OMEGA images, sub ject to the non- nega t ivit y and sum-to-one con- strain ts. In the follo wing, three differen t sup ervised unmixing algorithms a re considered, namely the ENVI-SVD metho d, Boardman (198 9), a quadratic programming (QP) tec hnique, Coleman a nd Li (1996), and a recen tly pro- p osed Ba y esian maxim um a p osteriori probabilit y soft-constraint (MAPs) estimator, Themelis and R on togia nnis (20 0 8). These algor it hms are applied on tw o differen t h yp ersp ectral OMEGA data sets, and they are ev aluated through their corresp onding abundance maps. The endmem b er reference sp ectra used for sup ervised unmixing are either extracted from the image itself, or selected from a sp ectral library o f pure minerals. The experimen- tal results show that the MAPs estimator results in abundance v alues that 3 satisfy the constrain ts of t he pro blem and provides a compromise b et w een the p erformance of the QP tec hnique a nd the complexit y of the ENVI-SVD metho d. An earlier v ersion of this pap er w as presen ted at the 2010 Europ ean Planetary Science Cong r ess, Themelis et al. (2010). 2. Linear sp ectral unmixing techniques Before w e presen t the unmixing tec hniques considered in this pap er, a short description is presen ted here on the linear mixing mo del (LMM), Kesha v a and Mustard (200 2), whic h is assumed in all three of them. In a h yp ersp ectral image, eac h pixel is represen t ed b y a L - dimensional v ector y , where L is the num b er o f the av ailable sp ectral bands. The elemen ts of y corresp ond to the reflectance measured at the resp ectiv e sp ectral bands. The LMM assum es that the receiv ed pixel’s sp ectrum is generated b y a linear com bination of endmem b ers’ sp ectra. Supp ose that the sp ectral signatures of p mat erials that may exist in the imag e are av a ila ble. Then, y can b e expresse d b y the following linear r egression mo del: y = Φx + n , (1) where Φ = φ 1 φ 2 . . . φ p ∈ R L × p + , is the mixing matrix con ta ining the end- mem b ers’ sp ectra ( L -dimensional ve ctors φ i , i = 1 , 2 , . . . , p ), x is a p × 1 v ector with the corresp onding abundance fractions, and n is a L × 1 additive noise ve ctor. Adopting the linear mo del in (1), three differen t unmixing algorithms are applied to the OMEGA da ta sets: i) a singular v alue decomp osition metho d (ENVI-SVD), Boardman ( 1 989), a v aila ble in the ENVI image pro- cessing soft w are ii) a QP tec hnique, Coleman and Li (1996), a v ailable in the 4 Matlab en vironment, a nd iii) a r ecen tly pro p osed Bay esian MAPs estimator, Themelis and Rontogiannis (2008). These algorithms are briefly describ ed in t he following subsections. 2.1. ENVI-SVD ENVI-SVD is a constrained least squares a ppro ac h t o the unmixing prob- lem. Using the singular v alue decomp osition (SVD) algo rithm, the pseudo- in v erse of the mixing matrix Φ is computed. Then, the abundance fractions are easily estimated b y multiplying the pseudo-in v erse matrix with eac h im- age pixel’s sp ectral vec to r. The adv antage of this metho d is its low compu- tational complexit y , since the pseudo-in vers e matrix is computed only once as a prepro cessing step, and is then applied to all imag e pixel v ectors. As far as the sum-to-one constrain t is concerned, it is imp osed to the problem using an extra (w eighted ) equation to the linear system of equations (1) . How ev er, ENVI-SVD do es not take in to accoun t the non-negativity of the abundances, whic h can result in negativ e abundance v a lues that hav e no phy sical meaning. 2.2. Quadr atic pr o gr amming te chnique This quadratic prog r amming tec hnique is a reflectiv e Newton metho d, whic h minimizes the quadratic function of the least squares erro r of the unimixing problem, sub ject to the sum-to-one and non- negativit y constrain ts imp osed on the abundances. The QP t ec hnique is ba sed on an iterative op- timization sc heme, whic h has to b e rep eated separately for each image pixel v ector. Keeping in mind tha t a h yp ersp ectral image ma y b e comp osed of thousands of pixels, solving a separate optimization problem for eac h pixel 5 adds up to the computational complexit y of the metho d. An implemen ta- tion of the quadratic programming tec hnique is av ailable in the o pt imizatio n to olb ox of Matlab. 2.3. MAPs estimator The MAPs estimator prop osed in Themelis and Rontogiannis ( 2 008) is a Bay esian estimator sp ecifically designed to address the inv erse problem of sup ervised h yp ersp ectral unmixing. In a Ba yes ian framew or k, appro pri- ate prior distributions are assigned to the unkno wn parameters of the esti- mation pro blem, whic h usually reflect the parameters’ natural c hara cteris- tics. The Bay esian approa c h of Benav oli et a l. (2007) is a dopted in whic h a Gaussian distribution is used as a prior for the abundance v ector x and the MAP estimator is then utilized. By exploiting the symmetry of the prob- lem’s con v ex constraints, the para meters of the Gaussian p osterior distribu- tion (i.e., the mean and the cov ariance matrix) can b e expressed in closed forms, Themelis and Rontogiannis (2008). Due to the statistical nat ur e of the Ba y esian estimator, the constrain ts are not explicitly imp osed to the esti- mated parameters. T o alleviate this, t he final step of the algo rithm is a pro- jection of the MAP estimation p oin t on the polytop e of constrain ts, providing its nearest estimate that satisfies the constraints, Themelis and R o n togiannis (2008). This algorithm has substantially low er complexit y than the QP tech - nique, since it relies on the computation of simple closed-form expressions. 3. Discussion The previously described algorithms are applied to t w o differen t OMEGA data cub es: (a) a scene of Mars’ South P olar Cap, a nd (b) a Syrtis Ma jor 6 observ ation. The OMEGA instrumen t is a sp ectrometer on b oard ESA’s Mars Express satellite, whic h provides hypersp ectral images of the Mars sur- face, with a spatial resolution fro m 300m to 4km, 96 w av elength channels in the visible band a nd 256 w a vele ngt h c hannels in the near infrared band, Bibring et al. (2004). OMEGA uses three differen t detectors, with sp ectral resolutions ab out 7 . 5nm in the 0 . 3 5 − 1 . 05 µ m w av elength range (visible and near inf rared c hannel o r VNIR), 14nm b etw een 0 . 94 and 2 . 70 µ m (short wa ve infrared c hannel or SWIR) and an av erage o f 21nm from 2 . 65 to 5 . 2 µ m (long w a ve infrared channel or L WIR), respectiv ely . The tw o hypersp ectral data sets, the reference sp ectra used for each ima g e and the SU results obtained from the application of the three metho ds ar e analytically describ ed in the follo wing sections. 3.1. South Polar Cap image cub e This data set consists of a single h yp ersp ectral data cub e obtained by lo oking tow ards the South P olar Cap of Mars in the lo cal summer (Jan. 2004). The da t a cub e is made up of t w o c hannels: 128 sp ectral planes from 0 . 93 t o 2 . 73 µ m with a resolution of 14nm and 128 sp ectral planes f r o m 2 . 55 to 5 . 11 µ m with a resolution of 21nm. Noisy bands were excluded, and 156 out of the 25 0 initial bands we re finally utilized in the regio n from 0 . 93 to 2 . 98 µ m to av o id the thermal emission sp ectral range. The linear mo del mixing matrix consists o f the follo wing three r eference sp ectra: (a ) CO 2 ice (syn thetic data with grain size = 100 mm), (b) H 2 O ice (syn thetic data with grain size = 10 µ m), and (c) dust, whic h w ere all detected a priori using the W av a nglet metho d of Sc hmidt et al. (2007). These endmem b ers are dis- cussed in the first OMEGA publication, Bibring et a l. (20 0 4), and a re a lso 7 v erified by Sch midt et al. (2010), using the Bay esian p ositiv e source separa- tion metho d of Moussaoui et al. (2008). The resp ectiv e sp ectral signatures of the endmem b ers are sho wn in Fig. 1. The abundance maps for eac h endmem b er resulting aft er the application of the three estimators are display ed in Fig s. 2 - 4. As show n in these figures, the ENVI-SVD abundances do not satisfy the non-negativity constrain t, e.g., regarding the CO 2 endmem b er, the minimum computed abundance v alue is − 9 . 9 × 10 − 2 . Notice also that the abundance v a lues calculated by QP and MAPs are in full agreemen t, t hey share the same scale and a r e quite differen t f rom those obtained b y ENVI-SVD. This sho ws that the MAPs estimates pro vide reliable information ab out the a bundances. It also adds up to the fact that the MAPs estimator ha s almost similar p erformance with the QP a lgorithm in simulation scenarios with syn thetic data, a s sho wn in Themelis and Rontogiannis (2008). 3.2. Syrtis Major image cub e This dat a set consists o f a sin g le h yp ersp ectral data cub e of the Syrtis Ma- jor region, whic h con tains w ell-iden tified areas with ve ry strong signatures o f mafic minerals, Mustard et al. (20 05). The data cub e consists of 1 0 9 spectral bands out of the 128 original wa v elengths of the SWIR detector. The spatial dimensions of the cub e ar e 366 × 1 28 pixels. The O MEGA observ ations hav e b een calibrated for kno wn instrumen t a rtifacts and for atmospheric CO 2 . The cube ha s b een radiometrically corrected using the standard correction pip eline (SO F T06) and the atmospheric gas transmission has b een empir- ically corrected using the v olcano scan metho d, Langevin et a l. (2005). It is w ell kno wn that OMEGA can iden tify p yroxene and olivine; it discrimi- 8 nates b etw een the high-calcium pyro xenes (HCPs, e.g., clinop yroxe nes) and lo w-calcium py roxene s (LCPs, e.g., orthopyro xenes), Bibring et al. (2005). In the scene under inv estigation, we utilized three endmem b ers whic h hav e previously b een iden tified to b e presen t in the image, Mustard et al. (2 0 05), namely , (a) Hypersthene, (b) Diopside (c) F ay alite. These are all lab ora- tory reference sp ectra, whic h hav e also b een used in Sc hmidt et al. (2011) for sup ervised unmixing. It is interes ting t o note that the last tw o endmem- b ers ha ve b een retriev ed using CRISM m ultisp ectral o bserv ations. Their resp ectiv e sp ectral signatures are displa y ed in Fig. 5. Three more arti- fact endmem b er sp ectra are utilized, sp ecifically t wo neutral sp ectral com- p onen ts (flat lines at 10 − 4 and 1), and a slop e line, a s in Sc hmidt et al. (2011); Le Mouelic et al. (2009). The abundance maps obtained from the application of the three metho ds to the Syrtis Ma jor h yp ersp ectral scene are sho wn in Fig s. 6 - 8. Eac h Figure illustrates the corresp onding abundance map of a single endmem b er, a s it is estimated by all three metho ds. As a reference, the abundance maps of all three endmem b ers using the band ratio metho d are also sho wn in Fig . 9. The band ratio and bands depth estimation metho ds are commonly used to detect minerals on O MEGA data Bibring et al. (2005). This metho d is v alid only if a t least tw o wa vele ngth channels can b e iden tified a s affected by only one particular mineral. F ollow ing the metho do logy of Schmidt et al. (2011), w e used four band ratio s: Index(Olivine) = b2 . 39 / b1 . 06 (2) 9 Index(op x) = 1 − b1 . 84 / ((1 . 84 − 1 . 25) ∗ b1 . 25 + (2 . 47 − 1 . 84) ∗ b2 . 47) ∗ (2 . 47 − 1 . 25) (3) Index(cp x) = 1 − b1 . 85 / ((2 . 3 2 − 1 . 8 5) ∗ b2 . 3 2 + (2 . 56 − 2 . 32) ∗ b2 . 56) ∗ (2 . 56 − 1 . 85)) (4) where the w a ve length ba nd “b1 . 84” stands for the band at 1 . 8 4 microns, Orthop yroxe nes (Hyp erstene) a re not ed as “op x” and Clinop yro xenes (Diop- side) are noted as “cp x”. The differences b et we en the three metho ds a re again pro minen t. Bo th the MAPs and the QP metho ds pro vide consisten t results, as far as the endmem b ers F ay alite and Hyp ersthene is concerned. In addition, for b oth F a y alit e and Hyp ersthene, ENVI-SVD returns negativ e abundance v alues and its resulting maps substan tially deviate from the other t w o metho ds. As fa r a s Dio pside is concerned, the MAPs estimator seems to pro duce a sligh tly differen t abundance map in comparison to the other tw o metho ds. How ev er, it can b e easily v erified by comparing Figs. 6 - 8 a nd 9 that the abundance maps of the MAPs estimator a re in b etter agreemen t with those obtained using the band ratio metho d, compared to the other t w o metho ds. Th us, it can b e argued that MAPs provide s more reliable results than ENVI-SVD and QP . 4. Conclusions In this pap er, w e hav e presen ted a comparison of three differen t sup er- vised sp ectral unmixing metho ds (Bay esian MAPs estimator, ENVI-SVD, QP), on the basis o f t wo differen t OMEGA hypersp ectral data sets. As op- p osed to itera t ive algorithms or Mark ov Chain Monte Carlo metho ds, e.g. 10 Sc hmidt et al. (2010), commonly used for the constrained inv erse problem of abundance estimation, t he computational complexit y of t he MAPs estimator is m uc h lo we r . Sp ecifically , fo r the Syrtis Ma jor dataset, the running time of the MAPs alg orithm w as 4 . 7 secs in a roughly optimized Matlab imple- men tation, while the QP needed 26.4 secs ( b oth algor it hms w ere run o n a 2 . 4-Ghz In tel Core 2 CPU). In addition, as v erified b y exp erimen tal results, the p erformance of the tw o metho ds is approximately equal. Therefore, the MAPs estimator seems to offer the b est compromise b et we en estimation p er- formance and complexit y a mong the three algorithms, and it is thu s a serious candidate for sp ectral unmixing of h yp ersp ectral data in Planetary Sciences. 5. Ackno wledgmen t The authors would lik e to thank ESA a nd the OME G A team for pro viding us the hy p ersp ectral data used in this pap er. References Bena v oli, A., Chisci, L ., F arina, A., April 2007. Estimation of constrained parameters with guarantee d MSE impro v emen t. Signal Pro cessing, IEEE T ransactions on 55 (4), 1 264–1274 . Bibring, J.-P ., Langevin, Y., Gendrin, A., Gondet, B., P oulet, F ., Berthe, M., Soufflot, A., Ar vidson, R., Mangold, N., Mustard, J., Drossart, P ., T eam, T. O., Mar. 2005. Mars Surface Div ersit y as Rev ealed by the OMEGA/Mars Express Observ ations. Science 307 ( 5715), 1576–158 1. Bibring, J. P ., La ngevin, Y., Poule t, F., Gendrin, A., Gondet, B., Berthe, M., Soufflot, A., D rossart, P ., Com b es, M., Bellucci, G., Moroz, V., Mango ld, 11 N., Sc hmitt, B., Apr. 200 4. Perennial water ice iden tified in the south p o lar cap o f Mars. Nature 428, 627–630 . Bibring, J. P ., Soufflot , A., Berthe’, M., Langevin, Y., Gondet, B., Dr o ssart, P ., Bouye ’, M., Com b es, M., Puget, P ., Bellucci, G., et al., 2 0 04. OMEGA: Observ atoire p our la Mine’ralogie, l’Eau, les Glaces et l’Activit. V ol. SP- 1240. ESA, pp. 37–5 0. Boardman, J., July 1 989. In ve rsion of imaging sp ectrometry data using sin- gular v alue decomp osition. In: Pro c. of Geoscience and Remote Sensing Symp osium, IGARSS’89 . V ol. 4. pp. 2069–2 072. Coleman, T. F ., Li, Y., April 1 996. A reflectiv e newton metho d fo r minimiz- ing a quadratic function sub ject to b ounds on some of the v aria bles. SIAM Journal on Optimization 6, 104 0–1058. Com b e, J., Lemouelic, S., Sotin, C., Gendrin, A., Mustard, J., Ledeit, L., Launeau, P ., Bibring, J., Gondet, B., Langevin, Y., 2008 . Analy- sis of O MEGA/Mars Express da ta hypersp ectral da ta using a Multiple- Endmem b er Linear Sp ectral Unmixing Mo del (MELSUM): Methodo lo gy and first results. Planetary a nd Space Science 56 (7), 95 1–975. Gendrin, A., Langevin, Y., Bibring, J. P ., F orni, O., 2006. A new metho d to in ve stigat e hypersp ectral ima g e cub es: An application of the w av elet transform. J. Geoph ys. Res. 111. Kanner, L. C., Mustard, J. F., Gendrin, A., Apr. 2007. Assessing the limits of the Modified Gaussian Mo del for remote sp ectroscopic studies of py roxenes on Mars. Icarus 187, 442–4 5 6. 12 Kesha v a, N., Mustard, J., Jan ua r y 2002. Sp ectral unmixing. Signal Pro cess- ing Magazine, IEEE 19 (1), 44–57. Langevin, Y., P oulet, F ranc, o., Bibring, J.-P ., G ondet, B., 2005. Sulfates in the north p olar r egio n o f mars detected b y omega/ma r s express. Science 307 ( 5 715), 1 584–6. Le Mouelic, S., Com b e, J.-P ., Sarago, V., Mangold, N., Masse, M., Bib- ring, J.-P ., G o ndet, B., Langevin, Y., Sotin, C., aug. 200 9. An iterativ e least squares approach to decorrelate minerals and ices contributions in h yp ersp ectral images: Application to cuprite (earth) and mars. In: Hy- p ersp ectral Image a nd Signal Pro cessing: Ev olution in Remote Sensing, 2009. WHISPERS ’0 9. First W o rkshop on. pp. 1 –4. Moussaoui, S., Hauksd´ ottir, H., Sc hmidt, F., Jutten, C., Chanus sot, J., Brie, D., D out ´ e, S., Benediktsson, J. A., June 2008 . On the decomp osition of mars h yp ersp ectral data b y ica and ba ye sian p ositiv e source separation. Neuro computing 71, 2194– 2 208. Mustard, J. F., P oulet, F., Gendrin, A., Bibring , J. P ., Langevin, Y., Gondet, B., Mangold, N., Bellucci, G., Altieri, F., 2005. Olivine and Pyrox ene Div ersit y in the Crust of Mars. Science 307 (5715), 15 9 4–1597. Sc hmidt, F ., Bourguig no n, S., Mou ¨ elic, S. L., Dobigeon, N., Theys, C., T r ´ eguier, E., June 201 1. Accuracy and p erfo rmance of linear unmixing tec hniques for detec ting minerals on Omega/ Mars Ex press. In: Pro c. IEEE GRSS W orkshop on Hyp ersp ectral Image and SIgnal Pro cessing: Ev olu- tion in Remote Sensing (WHISPERS). Lisb on, P o rtugal. 13 Sc hmidt, F., D oute, S., Sc hmitt, B., Ma y 2007. W av a ng let: An efficien t su- p ervised classifier for h yp ersp ectral images. Geoscience and Remote Sens- ing, IEEE T ransactions on 45 (5), 1374 –1385. Sc hmidt, F., Sc hmidt, A., T r ´ eandguier, E., Guiheneuf, M., Moussaoui, S., Dobigeon, N., No v em b er 2010. Implemen tatio n stra t egies for hypersp ec- tral unmixing using bay esian source separation. Geoscience and Remote Sensing, IEEE T ransactions on 48 (11), 4003– 4013. Themelis, K., Ron togiannis, A., Sykioti, O., Koutroum bas, K., Dag lis, I., Sc hmidt, F., Sep. 2 010. O n the unmixing o f MEx/OMEGA h yp ersp ectral data. In: Europ ean Planetar y Science Congress 2010 . p. 730. Themelis, K. E., Rontogiannis, A. A., August 20 08. A soft constrained MAP estimator fo r sup ervised hy p ersp ectral signal unmixing. In: Pro c. of Euro- p ean Signal Pro cessing Conference, EUSIPCO’08. 14 1 1.2 1.4 1.6 1.8 2 2.2 2.4 2.6 2.8 3 0 0.1 0.2 0.3 0.4 0.5 0.6 0.7 0.8 0.9 1 Wavelength Reflectance Dust CO 2 ice H 2 O Figure 1: Reference sp ectra of the South P olar Cap OMEGA image. The a v ailable endmem b ers are: (a ) OMEGA typical dust materials with atmo- sphere absorption. (b) syn thetic CO2 ice with grain size of 100 mm, (c) syn thetic H2O ice with gra in size of 100 microns. 15 ENVI−SVD 0.4 0.6 0.8 (a) QP 0.5 0.6 0.70.8 0.9 (b) MAPs 0.5 0.6 0.7 0.8 0.9 (c) Figure 2: Abundance map of the dus t endmem b er, estimated using (a ) ENVI- SVD, (b) QP , a nd (c) MAPs. 16 ENVI−SVD 0 0.2 0.4 (a) QP 0.2 0.4 (b) MAPs 0.2 0.4 (c) Figure 3: Abundance map of the CO 2 endmem b er, estimated using (a ) ENVI- SVD, (b) QP , a nd (c) MAPs. 17 ENVI−SVD 0.1 0.2 0.3 (a) QP 0.1 0.2 0.3 (b) MAPs 0.1 0.2 0.3 (c) Figure 4: Abundance map of the H 2 O endmem b er, estimated using (a ) ENVI- SVD, (b) QP , a nd (c) MAPs. 18 0.8 1 1.2 1.4 1.6 1.8 2 2.2 2.4 2.6 0 0.05 0.1 0.15 0.2 0.25 0.3 0.35 0.4 0.45 Wavelength Reflectance hyperst2.spc Hypersthene PYX02.h >250u Silicate (Ino); Diopside CPX CRISM Olivine Fayalite CRISM Figure 5: Reference sp ectra of t he Syrtis Ma jor OMEGA image. 19 ENVI−SVD 0 0.05 0.1 (a) QP 0 0.05 0.1 (b) MAPs 0.08 0.1 0.12 0.14 0.16 0.18 (c) Figure 6: Abundance map of Hyp ersthene, estimated using (a) ENVI-SVD, (b) QP , and (c) MAPs algorithms. 20 ENVI−SVD 0.02 0.04 0.06 0.08 0.1 (a) QP 0.02 0.04 0.06 0.08 0.1 (b) MAPs 0.1 0.15 0.2 (c) Figure 7: Abundance map of Diopside, estimated using (a ) ENVI-SVD, (b) QP , and (c) MAPs algorit hms. 21 ENVI−SVD −0.1 −0.05 0 0.05 0.1 0.15 (a) QP 0 0.05 0.1 0.15 (b) MAPs 0.05 0.1 0.15 0.2 0.25 (c) Figure 8: Abundance map of F ay alite, estimated using (a) ENVI-SVD, (b) QP , and (c) MAPs algorit hms. 22 OPX 0 0.02 0.04 0.06 0.08 0.1 (a) CPX 0 0.05 0.1 (b) OL 0 0.05 0.1 0.15 (c) Figure 9: Abundance maps o f the endmem b ers (a) Hyp ersthene, (b) D iop- side, and (c) F a y alite in the Syrtis Ma jor scene. The abundances are esti- mated using the band ratio metho d. 23
Original Paper
Loading high-quality paper...
Comments & Academic Discussion
Loading comments...
Leave a Comment