Collective Attention and the Dynamics of Group Deals
We present a study of the group purchasing behavior of daily deals in Groupon and LivingSocial and introduce a predictive dynamic model of collective attention for group buying behavior. In our model, the aggregate number of purchases at a given time…
Authors: Mao Ye, Chunyan Wang, Christina Aperjis
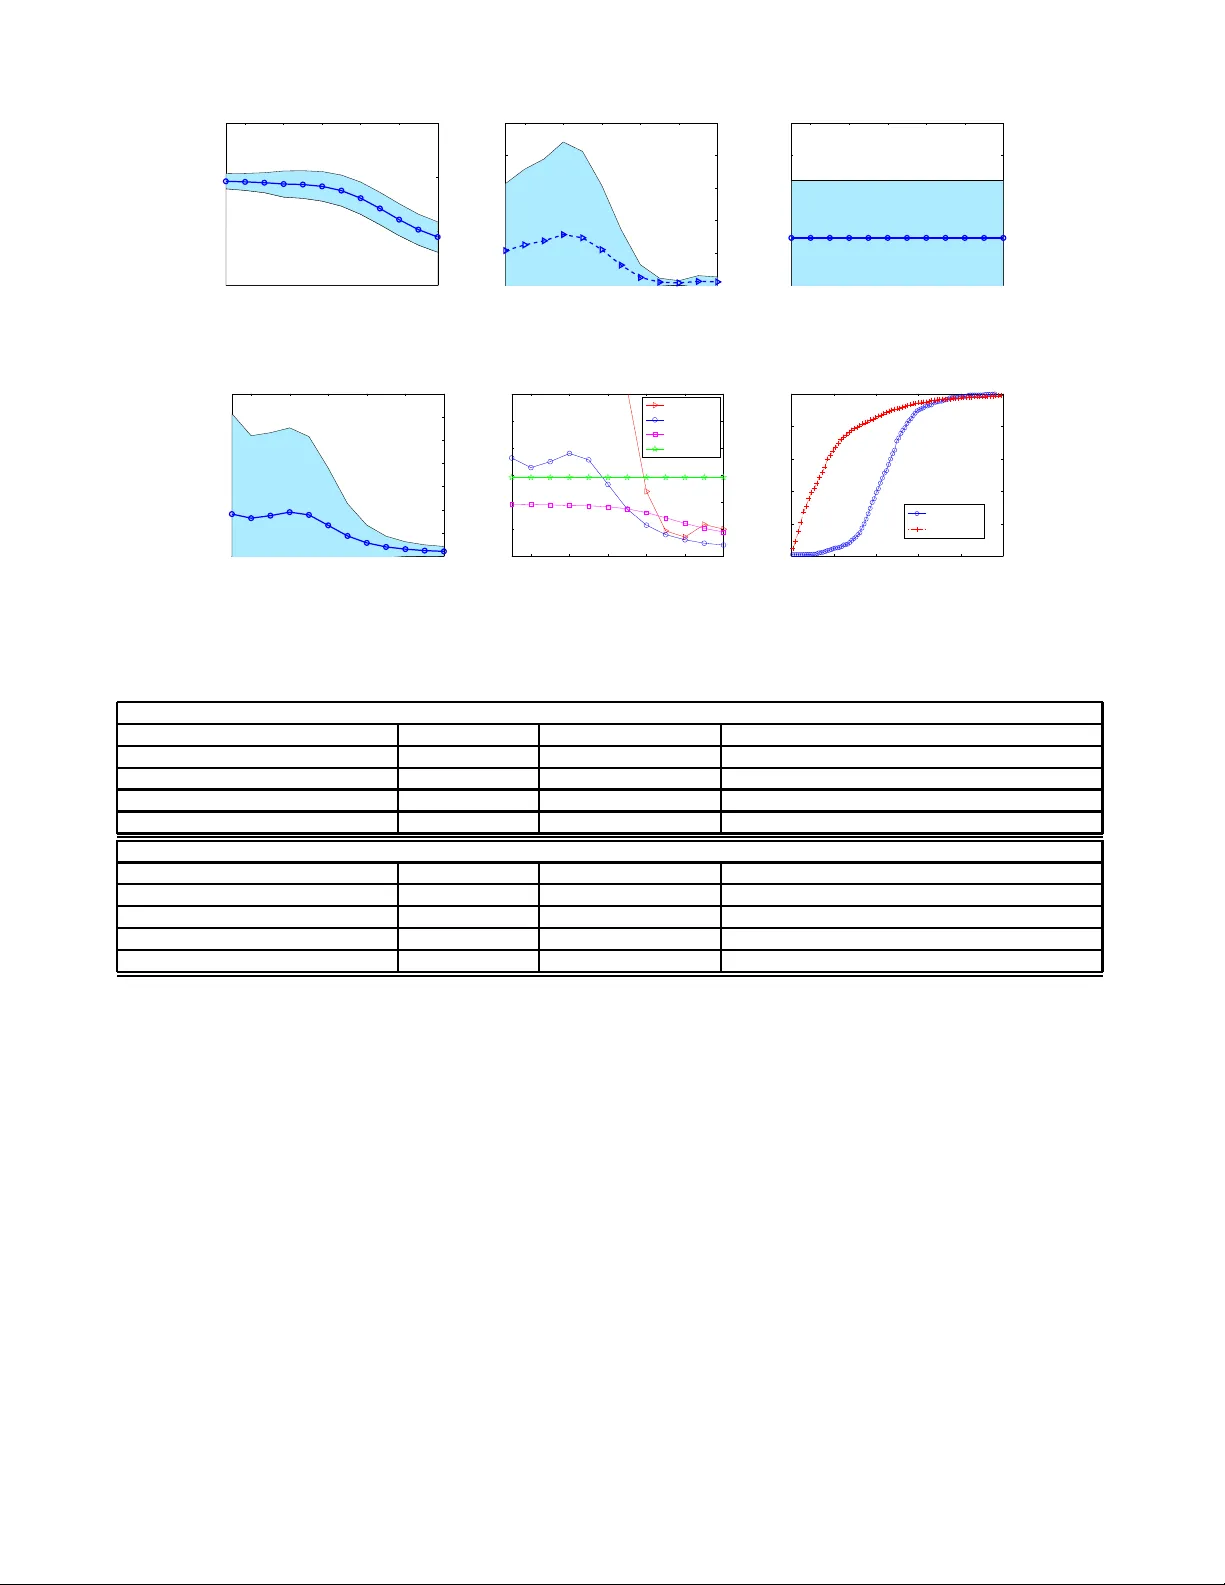
Collective Attention and the Dynamics of Gr oup Deals Mao Y e ∗ Social Computing Group HP Labs Calif or nia, USA mxy177@cse.psu.edu Chun yan W ang Dept. of Applied Ph ysics Stanf ord University Calif or nia, USA c hun y an@stanford.edu Christina Aperjis Social Computing Group HP Labs Calif or nia, USA c hristina.ap erjis @hp.com, Bernardo A. Huber man Social Computing Group HP Labs Calif or nia, USA bernardo.huberman@hp.com Thomas Sand holm Social Computing Group HP Labs Calif or nia, USA thomas.e.sandholm@hp.com ABSTRA CT W e present a study of the group purchasing b ehavio r of daily deals in Groupon and LivingSocial and introdu ce a predic- tive dynamic mo del of collective attention for group buy ing b ehavio r. In our mo del, the aggregate num b er of purchases at a giv en time comprises tw o types of p rocesses: random disco very and so cial propagation. These p ro cesses are ve ry clearly separated b y an in fl ection p oint. Using large data sets from b oth Group on and LivingSo cial we sho w how the mod el is able to predict the s uccess of gro up deals as a func- tion of time. W e fi nd that Group on deals are easier to pre- dict accurately earl ier in the deal lifecycle than LivingSocial deals d ue to the final number of deal p urchase s saturating quick er. One p ossible explanation for this is that th e incen- tive to socially propagate a deal is based on an indiv idual threshold in Liv ingSocial whereas it in Group on is based on a collectiv e threshold, which is reached ve ry early . F ur- thermore, the p ersonal b en efit of propagating a d eal is also greater in LivingSocial. Categories and Subject Descriptors J.4 [ Computer A pplications ]: Social and Beha vior Sci- ences; G. 3 [ Mathemati cs of Computing ]: Probabilit y and Statistics General T erms Economics, Theory , Algorithms ∗ Mao Y e is also a Ph D stud ent in t he D epartment of Com- puter Science and Engineering, the P ennsylv ania State Uni- versi ty , Pennsylv ania, USA Permission to make digital or hard copies of all or part of this work for personal or c lassroom use i s grante d without fee provided that copies are not made or distribut ed for profit or commercial adv antage and that copies bear this notice and the full cita tion on the first page. T o cop y otherwise, to republi sh, to post on serv ers or to redistrib ute to lists, re quires prior speci fic permission and/or a fee. Copyri ght 2011 A CM 978-1-4503-0757 -4/11/07 . ..$10.00. Keyw ords group deals, collectiv e attention, purchase dy namics 1. INTR ODUCTION Attracting the attention of p otential customers in tod a y’s information ric h so cial media is a challenge. As a result mar- keters h a ve b een forced to target customers in more sophis- ticated wa ys. Location-b ased (regional) and hyper- location- based ( within eye-sigh t) targeting has turned out to b e very effective in terms of imp roving conv ersion rates from v iews to purchases [10]. How ever, since p eople are unwil ling to share their ex act lo cations out of priv acy concerns they need to b e giv en some incentiv e to reveal th eir p osition. The most suc- cessful incentiv e employ ed to d ate is d aily deals. 1 In spite of the success of this strategy it is n ot fully understoo d what makes it successful and what kind of social b ehavior th e daily deals sites so effectively tap into and exploit. How ever, it is clear th at deadlines and so cial p rop agation pla y imp or- tant roles in addition to lo cation-based targeting. The main question we are add ressing in this work is ho w to describ e the purchasing pattern more precisely in order to pred ict the future pop u larit y of a deal. W e analyzed data from Group on and LivingSo cial, the current marke t leaders of daily deals in the US. Group on promotes deals for different geographic mark ets, or cities, called divisions. In eac h division, there is typically one fea- tured daily deal. A deal is a coup on for some product or service at a substantial discount off the regular price. Deals ma y b e a v ailable for one or more days. Coupons are only redeemable if a certain minimum number of customers pur- chas es the deal, and t his num b er constitutes what Group on calls a tipping p oint . F urthermore, sellers may set a max- im um threshold size to limit the n umber of coup ons t h at can be purchased. LivingSo cial is simila r to Group on, ex- cept that there is no tipping p oint. The incentiv e that drives users to buy deals is th e follow ing commitment made by Liv- ingSocial: “Buy fi rst, then share a sp ecial link with friends, if t hree friends buy , yours is free!” . 2 A closer ex amination of the mechanisms driving user b e- havior in group deals could provide useful guidance for lo- cal marketing campaigns. In this pap er w e study the ev o- 1 http://w ww.bynd.com/201 1/05/04/social-loco-research/ 2 http://w ww.livingsocial.com lution of collectiv e attention measured as deal purchases. W e base our analysis on data collected from Group on ov er tw o months and from LivingSo cial ov er one month. Our as- sumption is th at successful deals arise from tw o behavioral processes: random disco very; resulting from the serendipi- tous disco very of a deal on the w eb p ortal, or in the mobile app, or via an email sub scription; and social p ropagation; whic h results from t he p ropagation of d eals ov er so cial net - w orks. These p rocesses are separated by an inflection p oint, whic h in Group on is the tipping p oint, after which t here are enough pu rc hases to guaran tee d eal transactions. Before th e inflection p oint is reached the customer base is small so the random disco very pro cess dominates. Conv ersely , after the inflection p oint, a critical m ass of customers have discov ered the d eal to mak e so cial propagation dominate the pu rc hasing b ehavio r. The contributions of this pap er fall into tw o categories: • Structure of purc hasing dynam ics. W e presen t a stochastic mod el that analytically explains the ob- serve d purchasing b ehavior. • Prediction mo del for purc hases. W e show h o w the mo del is able to predict th e success of group deals as a function of time. The pap er is structured as follo ws. In Section 2, we discuss related work. In Section 3, we discuss th e data sets an d the collection strategies used in our stud y . Section 4 describes our sto chastic mod el and verif y it empirically . Then in Sec- tion 5 w e use our mo del to predict purchase v olume and b enchmark it agai nst some baselines. Section 6 concludes with p ossible applications of our w ork and future directions. 2. RELA TED WORK The related work comes from tw o broad areas, so cial pur- chas ing b ehavior, and collective attention. 2.1 Social Purc hasing Behavior According to [7, 9], a buyer’s so cial netw ork strongly in- fluences h er pu rchasing b eh a vior. I n [9], Guo et. al. ana- lyze data from the e- commerce site T aobao 3 to und erstand how individuals’ commercial transactions are em b edded in their so cial gra phs. In the stud y , they sho w that implicit information passing exists in the T aobao netw ork, and that comm unication b etw een buyers drives p urchase s. Ho w ever, according to the study presented in [15] social factors ma y imp ose a d ifferen t lev el of impact on the user p u rchas e be- havior for different e-commerce pro ducts. Several stud ies ha ve b een conducted to und erstand v arious aspects of Group on. In [1], Arahbshai examined the b usiness mod el of Group on, and concluded that its adv antages is the economic p otential to leverage simple technolog ies (e.g., w eb p ortal and email sub scription) to add ress deeply embedded inefficiencies in life. In [6], Utpal conducted a survey-based study on Groupon, in order to understand how businesses fare when runnin g group promotions. Employ ee satisfaction, rather than features of the promotion or its eff ect, was found to b e the factor th at correlates most strongly with t h e profit gained from a promotion. Effectiveness in reaching new cus- tomers and the p ercentage of Groupon users who bou ght 3 T aobao is a Chinese Consumer Market place, and also the w orld’s largest e- commerce w ebsite, http://w ww.taobao.com. more th an the deal’s v alue du ring the visit were important factors for th e small merchan ts when considering whether to run another promotion. In [8], Grab chak et al. study the problem of selecting Group on style chunk ed rewa rd Ads. T o address the p roblem, they d evise several adaptive greedy al- gorithms in a stochastic K napsac k framew ork. The pap er most related to our work is [4], where data on the p urchas e history of Group on deals were an alyzed . One key outcome of [4] is the preliminary ev idence t hat Group on is behaving strategically to optimize deal offerings, giving customers “soft” incentiv es (e.g., deal scheduling and dura- tion, deal featuring, and limited inv entory) to make a pu r- chas e. O ur work differs from these stud ies b y focusing on mod eling th e d eal purc hasing d ynamics o ver time and b y highligh ting th e imp ortance of the tipping p oint and its im- plication to social propagation. 2.2 Collective Atten tion In [13, 12, 14], Lerman et. a l, p ropose to use a stochastic mod el to describe the so cial dynamics of web users , with Digg as a case study . The stochastic model focuses on de- scribing th e aggreg ated (by avera ge quantities) b eh a vior of the system, includ ing ave rage rate at which users contribute new stories and vote on existing stories. With the devised stochastic mo del, p opu larit y of a D igg story can b e predicted shortly after it was submitted (or with 10 to 20 votes). St u d- ies in [11, 3 , 5] hav e found that early diffusion of information within a comm unity could b e a go od predictor of h ow far it will spread. Recent studies of collectiv e attention on so cial media sites such as Twitter, Digg an d Y ouT ub e [17, 16, 2] h a ve clarified the in terplay b etw een p opu larit y and nov elt y of user gener- ated conten t. The allo cation of attention across items was found to be u niversa lly log-normal, as a result of a multi- plicativ e process that can b e explained b y an information propagation mec hanism inheren t in all these si tes. While the sp ecific time scales o ver whic h n o velt y decays d iffer b e- tw een different systems dep ending on their typical typ e of conten t, the fun ctional form of th e decay is consisten t and thus future p opularit y is predictable. 3. D A T ASETS W e collected data from Group on’s socially promoted and local daily deal websites in the US. W e also collected data from LivingSo cial to verify that our mo dels could b e app lied more generally across group deal sites. Group on provides a con venien t API 4 , which allo ws u s to obtain more detailed information ab out the deals. By the end of April 2011, Group on’s business co vered about 120 cities in th e US 5 . W e monitored all Groupon deals offered in 60 different randomly selected cities during the p eriod b etw een A pril 4th and June 16th, 2011. In total we collected the enti re pu rchase traces of 4349 deals. In LivingSocial, there is no API a v ailable for us to pe- riodically obtain information about deals, so w e dev elop ed a cra wler to v isit the w ebpages of deals p eriod ically . After cra wling for one month, w e collected traces from o ver 900 deals. Next, to give a flav or of the typ e of d ata b eing used we examine the features of Groupon deals in m ore detail. A 4 http://w ww.groupon.com/pages/api 5 Statistics obtained from Group on API. Description coefficient standard error t-v alue p-v alue Intercept − 4 . 094 × 10 12 5 . 9776 × 10 12 -0.6849 0.4935 Tipping Poin t 0.7316 0.029 25.2276 6 . 5792 × 10 − 125 (***) F eatured position 0.7004 0.0463 15.1189 2 . 0166 × 10 − 49 (***) Duration 0.0062 4 . 8862 × 10 − 4 12.6412 1 . 6054 × 10 − 35 (***) is limited or n ot − 2 . 6105 × 10 − 4 2 . 0969 × 10 − 5 -12.4494 1 . 5597 × 10 − 34 (***) Retail Price - 0.0082 0.0458 -0.1797 0.8574 Discount -0.0011 1 . 6681 × 10 − 4 -6.3744 2 . 1908 × 10 − 10 (***) Sunday 0.0061 0.0022 2.7358 0.0063 (***) Nightli fe 0.3208 0.1515 2.1180 0.0343 (*) Health&Fitness 0.6429 0 . 0849 7.5722 5 . 1827 × 10 − 14 (***) T ra vel -0.1789 0 . 0782 -2.28 74 0.0223 (*) Automotive -0.3289 0.1366 -2.40 74 0.0161 (*) Professio nal Services 0.2552 0.1390 1.8363 0. 0664 atlan ta -2.0460 0.9373 -2.1829 0.0291 (*) albuquerque -1.8548 0.9365 -1.9806 0.0478 (*) austin -2.4329 0.9516 -2.55 67 0.0106 (*) abb otsford -2.1012 0.9392 -2.23 71 0.0254 (*) barrie -2.2454 0.9496 -2.36 46 0.0181 (*) ... ... ... ... ... T able 1: Mul ti v ariate li near regression of n umber of purchases. N = 3876, R -square = 0. 5952, adjusted R -square = 0.5857. Note that, due to space l imitation, we only show the resul t w ith p-v alue smaller than 5% for the launc hing day , category and division study . similar examination for LivingSo cial is outside the scop e of this work. How ever, w e will later see that the mo dels in- ferred from these observ ations apply to LivingSo cial as well . 3.1 Group on Deal Characteristics At the time of our study the Group on website presented the fol low ing relev ant deal information: description, dis- count, time of launch, tipping p oint (purchases required for a deal to actually b e sold), and the maximum num b er of sales of the deal. Add itionally , u sers could monitor the cur- rent number of pu rc hases 6 and whether the deal has tipp ed or sold out. W e monitored the n umber of purchases and the p osition of eac h deal in 20-minute time interv als. A sur- prisingly large p ortion (10%) of all deals exhib ited d ramatic non-monotonically increasing b ehavior, e.g. a decrease of 10 purchases b etw een subsequent interv als. This ma y indicate that something was wrong with th e deal, e.g. false marke t- ing due t o an inflated list price, and customers who initially purchased the d eal requested a refund (an option Group on supp orts and mark ets). Du e to the unknown user beh avior b ehind these deal actions we exclud e these deals from our study . Hence, 3876 deals were left to analyze. In our dataset, 270 deals ( out of 3876) had not reached their tippin g p oint when they expired. In th e follo wing, these deals are called faile d deals; and deals that are turned on successfully are called tipp e d deals. 3.1.1 Attrib utes of Dea ls Here w e presen t some statistics about attributes of the deals in our Group on d ataset, in clud ing retail price, dis- count, deals needed to tip (tipping p oint), time n eed ed to tip (tipping time), lifetime of a deal and final num b er of purchases. 6 The current number of purchases has since our study b een remo ved and replaced with an obfuscated threshold to make it harder to make p redictions. Group on deals hav e different retail prices and discounts. The mean v alue of retail price is $44 and the mo de v alue is $10. W e observe that most of the discounts range from 50% to 60%, and the mode v alue is 50%. Based on these statis- tics, we see that the pro duct and services deals provided on the Groupon w ebsite are n ot exp ensive most of the time, and the d iscoun ts are usually very big. In Group on, deals may h a ve different tipp ing p oints and successful deals ma y also ha ve different tipp ing times even when they h ave the same tip p ing p oints. The av erage num- b er of t ip ping p oin ts or units n eeded to tip is 22 (mo de v alue is around 10) and the exp ected tipping time is about 10.5 hours ( m o de v alue is around 6.67 hours). Most of th e time, deals in Group on were tipp ed within one day . Note t h at th e lifetime of a d eal in Group on is usually set to 1 da y , 2 da ys, 3 days or 4 days. The av erage number of purchases of a deal is 373. A deal ma y b e sp ecified with a limited a v ailable quantit y . So t h ese numbers are mixtures of different factors, suc h as the quality of a deal itself , the quantit y av ailable etc. 3.1.2 F actors I mpac ting Pur chases As we are ultimately interested in mo delling p urchase dy- namics of deals, we first need to understand what factors im- pact p urchas es. Hence, w e regress th e attributes discussed in the prev ious section against th e final num b er of p urchase s of a deal. If the Group on commission is k no wn 7 , t his num b er also gives a goo d estimate of the merchant’s reven ue from a deal. The mod el we use is as follo ws. Let N L denote the final num b er of purchases, θ the num b er of p urchase s needed to tip (tipping p oint), f wheth er the deal is listed in featured p osition (1) or not (0) at the current time, L the time till the N L -th purchase, p the retail price, d the discount, an d finally l whether the deal inv entory is limited (1) or n ot (0). 7 rep ortedly 50% in [1 ] The parameters w , c and g are vecto rs encod ed as in [4] to represent the launc h da y , category , and cit y . The follo wing equation is also t ake n from [4]. log N L = β 0 + β 1 log θ + β 2 f + β 3 L + β 4 l + β 5 p + β 6 d + β 7 w + β 8 c + β 9 g (1) where β 0 ∼ β 9 are the co efficients of the linear mo del. W e fitted the mo del using m ultiv ariate linear regression. The parameter estimates, t heir standard errors, t - v alues and p-v alues are listed in T able 1 . Due to space limitations, only attributes with significance level (p - v alue) smaller than 5% are show n in th e table. Among those attributes, we find th at tipping p oint an d featured p osition are the tw o most signif- ican t factors that can help predict the number of p urchase s. Surprisingly , tip p ing p oint seems to ha ve better predicting p o wer than featured p osition (i.e., the t-v alue is much larger for the t ip p ing p oin t factor than for the featured p osition factor). In the next section, we sho w how the tipp ing t ime can b e generalized as an inflection p oint in t he purchase dynamics of group deals. 4. PURCHASE D YNAMICS In this section, we prop ose a model of the purchase dy- namics of group deals. A group deal is generally discov ered by th e user in one of the follo wing four w ays: (1) by visiting a web-page, (2) b y runnin g a smart-phone application, (3) by getting notifications via email and (4) by comm unicating with friends. Here, we refe r to the first three a s random disco very and th e fourth is referred to as social propagation. Based on th is notion, our mo del describ es the purc hase dynamics as f ollo ws. Let N t denote the n umber of times that the deal h as b een p urchase d at time t . W e then hav e N t +∆ t − N t = α t · Y t + β t · f ( t, N t ) , (2) where α t and β t are wei ght factors, Y t is a non-negative random v ariable denoting the n umber of purc hases caused by rand om discov ery in t h e interv al ( t, t + ∆ t ], and f ( t, N t ) represents the num b er of pu rchas es caused by so cial propa- gation in the same interv al as a function of t and N t . 0 5 10 15 20 0 100 200 300 400 Time (hour) # of purchase (a) Group on 0 5 10 15 20 25 0 50 100 150 200 250 300 Time (hour) # of purchase (b) LivingSo cial Figure 1: Purc hase gro wth of deals W e av erage the number of p urchases of deals for each time step in b oth Group on and LivingSo cial. As sho wn in Fig- ure (1), deals in Liv in gS o cial grow faster than Groupon in the first few hours. A p ossible reason is du e to th e different incentiv e that LivingSo cial is using t o promote deals. Liv- ingSocial users who w ant to get free deals may disseminate deal information more eagerly . F urthermore, there is an inflection p oint in the purchase dynamics for b oth Groupon and LivingSo cial deals (after 0 5 10 15 20 0 100 200 300 400 Time (Hour) # of purchases (normalized) starting from 4:00am starting from 5:00am starting from 6:00am inflection point (a) Group on 0 5 10 15 20 0 50 100 150 200 Time (Hour) # of purchases (normalized) starting from 4:00am starting from 5:00am (b) LivingSo cial Figure 2: Normalized Purchase growth of deals around 7 and 4 hours in Figure 1(a) and (b), resp ectively), after which t h e num b er of purchases grows faster; whereas the number of pu rchas es grows relativ ely slow ly and steadily b efore the inflection point. Note that after the inflection p oin t, the num b er of purchases grow s dramatically for ab out 11.6 and 14. 8 hours in Group on and LivingSocial, respec- tively , after which the purchase rate drops. One ma y argue th at this inflection p oint could b e caused by time-of-day seasonalit y given t h at all d eals are lo cal for a region b elonging to a single t ime zone. F or example, most p eople do not buy d eals at night, but early in the morn- ing when th ey w ake up. Hence, we n ormalize th e n umber of pu rc hases by removing the seasonal impact to examine whether the inflection point is caused by the time the deal is launched, as shown in Figure 2. In Group on, 95% of the d eals are launched b efore 7:00am an d 50% of these are launched b etw een 4:00am and 6:00a m. Hence, w e cluster deals in three groups, t hose that laun ch around 4:00a m, 5:00am, and 6:00am resp ectively . As sho wn in Figure 2(a), normalized purchase gro wth of deals clearly has t w o-stage gro wth, whic h is d ivided by a inflection point. Before the inflection p oint, it shows non- linear growth; while after the inflection p oint, it ob eys linear growth. In Liv in gSoical, deals are launched during 4:00a m ∼ 6:00am, lik e Group on. Interestingly , in Figure 2(b) , w e fi nd th e inflection p oint in the purchase gro wth of LivingSo cial deals disapp ears af- ter the normalization. In addition, deals launched from th e same time (e.g. , from 4:00 am) exhibit different purchase dynamics b ehavior in Group on and Liv ingSocial, e.g., in Figure 2, the purchase dynamics of Group on deals still ex- hibit an inflection p oint, while there is none in LivingSo cial deals. These observ ations suggest th at: (1) the consistent launch t imes ma y cause t he tw o-stage purchase gro wth in LivingSo cial; b u t (2) th e inflection point cannot solely be attributed to the time the deal is laun c hed in Group on , but the tipping-p oint mechanism m ay also p la y a role here. Based on the ab ov e observ ations w e write our eq uation as: N t +∆ t − N t = ( Y t b efore th e inflection p oint r ( t ) X t N t after t h e infl ection p oin t (3) Thus, we are implicitly assuming th at b efore the inflection p oin t α t = 1 and β t = 0, whereas after th e inflection p oin t α t = 0 and β t = 1 in (2). This assumption is motiv ated by the fact that rand om discov ery dominates b efore the in- flection p oint and so cial propagation d ominates afterwards — even though the tw o pro cesses may coexist. In partic- ular, b efore the inflection p oint th e customer base is small so the random discov ery pro cess dominates. In addition, in Group on, b efore the deal has tipp ed, p eople will hesitate to make a purc hase, as it is still u ncertain b oth whether the deal was considered go o d by others and whether it will b e offered, which reduces the effects of so cial p ropagation. A f- ter the infl ection p oint b oth of these uncertainties are gone. According to (3), after the inflection point, the increase in the num b er of purchases ( N t +∆ t − N t ) is prop ortional to the num b er of p eople that has purchased the deal u p to time t . Intuitively , a fraction of the p eople th at already purchased th e d eal will notify some of their friends ab out it, and a fraction of these friends will purchase the deal. These fractions are represented by the p ositive rand om v ariable X t . W e assume that { X t } are indep endent and identically distributed random v ariables. Since X t is ass umed t o be p ositiv e, N t can only increase o ver time. This gro wth in time is even tually curtailed by a d eca y in nov elt y , which is parameterized by the facto r r ( t ). As w e discuss later, r ( t ) is decreasing in t . This n otation of so cial propagation is b orro wed from and motiv ated in m ore d epth in [17]. 4.1 Pur chase Dynami cs Bef or e Inflection W e denote by τ i the interarriv al times of purchas es. In particular, τ i is th e t ime b etw een th e i − 1 and the i -th purchases. Supp ose that each τ i is ind ep en dently dra wn from some d istribution F . W e denote a deal’s inflection p oin t by θ , that is, the num b er of purchases required b efore social propagation dominates. Let L b e the total time th at the deal is open for purchases (as set by the seller). Then , N L is the fi nal number of p urchase s when the deal ends. Let F n denote the n -fold convo lution of F . Then, F n is the distribut ion of the sum of n consecutive in terarriv al times. Thus, the distribution of the time span to ge t the same inflection p oint θ for deals is giv en by F θ , the θ -fold conv olution. 0 5 10 15 20 0 10 20 50 100 150 200 250 t (hours) Cumulative Expected Purchase 10−tipping point 20−tipping point Figure 3: Purc hase gro wth for deals with ti ppi ng (inflection) p oi n ts of 10 and 20, resp ectively , in Groupon Figure 3 shows how the num b er of Group on d eal pu r- chas es increases o ver time when the tipp ing p oin t is equal to 10 (the most frequent v alue) and 20 p urchases . The plot is b ased on 492 (resp. 477) deals whose tipping point was equal to 10 (resp. 20) in our dataset. W e observ e the same pattern for deals with other tipping p oints, e.g., 5 and 30. W e find an approximately linear gro wth of purchases at the b eginning of the lifetime of a deal. F or b oth tipp ing p oints, the p urchase rate is relativ ely small and steady before the tipping time. After tipping or around tipp ing, the num b er of purchase s gro ws dramatically for about 11.6 hours, af- ter which the pu rc hase rate d rops. The tipping p oint time, thus, typically coincides with the inflection p oint time in the purchase dynamics. Note that the final number of purchases of a deal with a tipping p oint of 10 purchases is usually smaller th an the correspondin g num b er for a deal with a tipp ing p oint of 20, even though w e do n ot observe a significant difference b efore the tipping t imes. O ne p ossible reason is th at deals tippin g after 10 purchases ha ve smaller purchase p opulations th an those that tip after 20 p u rc hases, dep en d ing on t h e sp ecific categories of p ro du ct s and services. F urthermore, the p o- tential p urchase p opulation ma y also act as the ref erence for Group on and lo cal merc hants when they set the tipp ing p oin t for a deal. W e now look at th e probability th at a d eal fails, i.e. does not reach the inflection p oint. W e say that a d eal is turned on as long as its number of p urchase s reaches the in fl ection p oin t θ b efore t he deal expires, i.e. its lifetime L ends. So the probabilit y of a deal failing is equal to Pr( N L < θ ). Pr( N L < θ ) = θ − 1 X n =1 Pr( N L = n ) (4) Since the τ i v ariables are iid interarriv al times of pur- chas es, it follo ws t h at this is a renewal pro cess. W e use S n = n P i =1 τ i to denote the t ime sp ent until th e nth p urchase. It is easy to see th at N t = sup { n : S n ≤ t } , and thus, Pr( N t = n ) = Pr( N t ≥ n ) − Pr ( N t ≥ n + 1) = Pr( S n ≤ t ) − Pr( S n +1 ≤ t ) = F n ( t ) − F n +1 ( t ) (5) Applying Eq uation (5) t o Equation (4), we ha ve: Pr( N L < θ ) = θ − 1 X n =1 ( F n ( L ) − F n +1 ( L )) = F ( L ) − F θ ( L ) (6) Note that Equation (6) can pred ict the failure ratio (i.e., the probabilit y not to b e turned on) of a d eal. Con versel y , using this eq uation, given the failure ratio, we can estimate the parameters of F , such as the mean v alue. This analytical mo del can b e easily extended to predict the probability that a d eal will b e t u rned on when w e know the num b er of pu rchas es up t o a given p oint in time. F or example, if at time t 1 , a deal has already got n 1 purchases, then the p robabilit y that the deal will b e turned on can be estimated as Pr( N L < θ | N t 1 = n 1 ) = F ( L − t 1 ) − F θ − n 1 ( L − t 1 ) (7) W e now consider what distribution the interarriv al times follo w in Group on. T o exclud e the impact of tipping p oin t differences, we first consider only deals with a tipping p oint of 10 pu rchases (th e tipping p oin t distribution mode) from all the d ata w e gathered. As sho wn in Figure 4, intera rriv al times follo w an exp onential d istribution. Thus, b efore tip- ping, the arriv al rate of purchases follo ws a Poisso n pro cess. ! " # $ " % & " ! ! ! Count (log-scale) Interarrival time (minutes) Figure 4: Distribution of waiting time for a pur- c hase. This result is base d on all deals with a tipping poi n t of 10 purc hases, in Groupon This observ ation confi rms our assumption ab out random disco very , since if a user randomly chec ks the websites or a smartphone app the probability of a p urchase taking place in the next infinitely-small time in terv al is the same, and hence the interv als b etw een p urchase s follow an exp onential distribution. The Exp onential fi t in Figure 4 has R 2 v alue 0.9784. W e also c heck the intera rriv al t imes of purchases in LivingSocial du ring the first 4 h ours, and fin d that in- terarriv al times in LivingSo cial also follo w an exponential distribution. 0 500 1000 1500 0 0.02 0.04 0.06 0.08 Tipping Time (Min) Probability Figure 5: Predicted tipping time distribution vs. empirical tipping time distribution. T he result is based on al l deals with tipping p oint eq ual to 10, in Groupon An important conclusion from our mo del is that the d is- tribution of tipping time in Group on is exp ected to follo w an n-fold conv olution of distributions of F ( t ) . No w, giv en that F ( t ) is follow ing an exp onential distribution, then deals with a tipp in g p oint of 10 purchases should follo w a Gamma d is- tribution with a shape factor eq ual to 10. W e compare the predicted distribution of tipping time with that of real v alues gathered online, the histogram and PDF (curved line) of th e empirical and mo delled distributions respectively are shown in Figure 5. Note that there are some deals in Groupon that are very app ealing, and thus w ere tipp ed immediately after they we re launched. Nevertheless, the predicted tip- ping time distribut ion of Group on deals is similar to th e empirical one. 4.2 Pur chase Dynamics A fter Inflect ion W e now fo cus on the dy n amics after the infl ection p oint, and for expositional cla rity consider the time of inflection as time 0. Thus, N 0 denotes the num b er of purchase s of a deal at the infl ection p oin t time. Then, according to Equa- tion (3), the number of purchases at time T (that is, T time units after the inflection p oint) is given by N T = T Y t =1 (1 + r ( t ) X t ) N 0 (8) Note th at the realizatio n of X t will in general b e different in differen t time p eriod s; ho wev er all rand om v ariables X t follo w t he same distribution. Wh en X t is small (whic h is the case for small time steps), we ha ve the follo wing approximate solution for N T : N T ≈ T Y t =1 e r ( t ) X t N 0 = e P T t =1 r ( t ) X t N 0 . (9) T aking the logarithm on b oth sides, we get log N T − log N 0 ≈ T X t =1 r ( t ) X t (10) 0 5 10 15 −4 −3 −2 −1 0 t (hours) Decay factor r(t) (log−scale) After Tipping (a) Group on 0 5 10 15 20 −3 −2.5 −2 −1.5 −1 −0.5 0 Decay factor r(t) (log−scale) t (hours) (b) LivingSo cial Figure 6: Pro cess of nov elty decay The decay factor r ( t ) is estimated according t o Eq uation (3) and Equation (10) as follow s: r ( t ) = E (log N t ) − E (log N t − 1 ) E (log N 1 ) − E (log N 0 ) (11) where we n ormalize r (1) to 1. This calculation is again b or- ro wed from and ev aluated in more d etail in [17]. In Figure 6, w e p lot the nove lty deca y r ( t ) f or the first 16 and 20 hours after the infl ection p oint in Group on and LivingSo cial, resp ectively , as estimated from our dataset. Note that tipping time is usually around 8 hours, so w e fo cus on the time du ration of 16 hours after tipping in Group on. Recall th at in this section N 0 denotes the tip p ing p oint, and time t = 0 is the tip p ing time. W e observ e that r ( t ) decreases ov er t ime. Moreov er, Figure 6, su ggests that th e nov elt y decay is exp onential. In particular, r ( t ) ≈ exp( at + b ) , (12) 0 5 10 15 2.5 3 3.5 4 4.5 5 t (hours) Cumulative Expected Purchase (log−scale) After Tipping empirical our model (a) Group on 0 5 10 15 20 1 2 3 4 5 Time (hour) cumulative expected number of purchase After 4 hours in LivingSocial empricial our model (b) LivingSo cial Figure 7: Empirical v erification of our mo del where in Group on a = − 0 . 21 and b = − 2, and the R 2 v alue for this fit is 0.883 9; and in Livin gSocial a = − 0 . 11 and b = − 0 . 28 and R 2 v alue for th is fit is 0.9190. Next, w e are interested in ev aluating how we ll our mo del helps explain t h e pu rc hase gro wth after a deal has tu rned on. With b oth a , b estimated, w e can u se our results to ex plain the growth of purchases. In Figure 7, w e demonstrate the p otentia l predictive p ow er of our mod el by empirically veri- fying the growth of purchases of deals after they hav e tipp ed. F or th e mo del fitting in Figure 7, th e R 2 v alue is 0.9404 and 0.9903 in Groupon and Livin gS o cial, resp ective ly . 5. PURCHASE PREDICTION In this section, we discuss how to use our mo dels to pred ict the num b er of purchases of deals at a given t ime. Purc hase prediction is imp ortan t for b oth group d eal websites and lo- cal merchan ts. Accurate forecasts may help group deal web- sites design more optimized deal scheduling and promotion strategies and aid local merchan ts in allocating resources more efficien tly . W e no w discuss methods whic h mak e predictions based on h hours of p revious observ ations. 5.1 Pre dictors 5.1.1 Baselines The first simple baseline algorithm (denoted as baseline1 ) is to treat the current num b er of purchases as the future num b er of purchases , and hence it gu arantees less than 100% relativ e error, giv en th at the number is increasing and alw ays p ositiv e. Another baseline algorithm (den oted as baseline2 ) is to assume a linear relationship b etw een the current num b er of purchases and the future num b er of purchases. Supp ose w e know the num ber of purchases N t 1 at time t 1 , and aim to predict th e num b er of purchas es N t 2 at time t 2 , where t 1 < t 2 . Then we assume that N t 2 = αN t 1 + β (13) where α and β is mo del p arameters that can b e learned from training data. 5.1.2 Social Pr opagation Model As seen in Figure 7, the growth in sales after tipping in Group on is describ ed w ell by a multiplicati ve pro cess. What follo ws from the mo del is that to obtain th e p opularity for the next time step w e multiply the current popu larit y b y a small , rand om amount. More specifically , let t 1 and t 2 denote tw o different t ime steps and t 1 < t 2 . F ollo wing [16], w e hav e log N t 2 ≈ log( N t 1 ) + t 2 X t = t 1 r ( t ) X t (14) according to Equation (9) This process, called “gro wth with random multiplicati ve noise” , describes the d ynamics of users’ attention to we b conten ts [17 ]. While the incremen ts at eac h time step are random, their exp ected val ue ov er m any time steps adds up ultimately to P t = t 1 r ( t ) X t in the log-linear model, where P t = t 1 r ( t ) X t accounts for the linear relationship b etw een the log-transformed p opularities at different times t 1 and t 2 . Here, we introduce the pro cess used to mo del and predict the futu re num b er of p urchas es of a deal. W e first p erform a logarithmic transfo rmation on the num b er of purc hases, similar to [16, 4]. T o h elp determine whether the n umber of pu rc hases early on is a predictor of later num b er of p u r- chas es, see Figure 8, which sho ws the num b er of p urchases at the reference time t 1 = 8 hou rs vs. the num b er of purchases at the end of a day (i.e., t 2 = 24 hours) in b oth Group on and LivingSo cial. W e logarithmically rescaled the horizon tal and vertica l ax es in the figure to show the number of purchases for d ifferent d eals, whic h span four orders of magnitude. 10 0 10 2 10 4 10 0 10 5 # of purchase after 8 hours # of purchase after one day (a) Group on 10 0 10 2 10 4 10 0 10 1 10 2 10 3 10 4 # of purchases after 8 hours # of purchases after one day (b) LivingSo cial Figure 8: Num b er of purc hases after 8 hours v s. n umber of purc hases after one da y (log-scale). The bol d li ne is the li ne ar fit to the data Figure (8) shows that t h ere is a strong correlation b e- tw een th e earlier observ ations of th e num b er of purchases of a deal and the later observ ations. So we can determine the linear regression coefficients b etw een t 1 and t 2 on a giv en training d ataset, and then use the estimated co efficien ts to extrap olate on the test dataset. Note that there is a limitation to this approach. As we discussed b efore, in Group on a renewal p ro cess, rather than a m ultiplicative one, gov erns the dynamics b efore tipping. So this approac h may not p erform well for the very early observ ations. Nevertheless , it is applicable to b oth Group on and LivingSo cial since the multiplicativ e pro cess is th e main process du ring th e life cycle of a deal for b oth services. 5.2 Evaluation In this sub section, we conduct an experimental study to ev aluate th e prop osed prediction algorithms. A s d iscussed b efore, the important task is to b e able to pred ict how suc- cessful a deal will b e. Since there are many deals with a lifetime of one day we eva luate the p erformance of different algorithms by ho w accurately th ey can predict the num b er of pu rchas es of a deal after one day . Here, we use relative error, i.e., | real purchases - predicted purchases | real p urchases , as the p er- 2 4 6 8 10 12 0 0.5 1 1.5 # of hours to observe relative error (a) Baseline-1 2 4 6 8 10 12 0 5 10 15 20 25 # of hours to observe relative error (b) Baseline-2 2 4 6 8 10 12 0 1 2 3 4 5 # of hours to observe relative error (c) Multi-Linear Regression (MLR) Model 2 4 6 8 10 12 0 1 2 3 4 5 6 7 # of hours to observe relative error (d) So cial Propagation (S P) Mod el 2 4 6 8 10 12 0 0.5 1 1.5 2 2.5 3 # of hours to observe mean relative error baseline2 SP baseline1 MLR (e) Comparison 0 0.2 0.4 0.6 0.8 1 0 0.2 0.4 0.6 0.8 1 relative error cumulative probability baseline1 SP (f ) Relative error distribution Figure 9: Performance comparison of prediction of the num b er of purc hase s after one day in Group on. In (a)-(e), li nes denote the av erage relative e rror, and shaded regions co ver the areas of one -standard error. [Deal Title: The Magnetic Field - A sh eville] $12 for Two Tick ets to a Theater P erformance (Up to $28 V alue) Algorithms Real pu rc hases Predicted purchases Relative error baseline-1 12-hour observ ation 251 93 0.63 baseline-2 12-hour observ ation 251 482 0.92 MLR 251 51 0.80 SP with 12-hour observ ation 251 355 0.42 [Deal Title: Lime Leaf Thai Cuisine - H endersonvill e] $10 for $20 W orth of Thai F usion Cuisine Algorithms Real pu rc hases Predicted purchases Relative error baseline-1 12-hour observ ation 384 169 0.56 baseline-2 12-hour observ ation 384 714 0.86 MLR 384 1,452 2.783 SP with 12-hour observ ation 384 463 0.21 T able 2: Example prediction results for Groupon deals. formance metric to measure accuracy . 5.2.1 Experimen ts with Groupon Deals First, we condu ct exp eriments on the Group on dataset by randomly splitting it into halves, where one half is used for training and another half is for testing. In Figure 9, w e find baseline1 sho ws the b est p erfor- mance among all the testing algorithms with less than 7- hours of observa tions. After 7-hour observ ation, our pro- p osed social prop agation mod el (d enoted as SP ) shows the b est p erformance. Note that a deal whic h attracts more than hundred purchas es within the first hour after launc h- ing (6 deals in total in the exp eriment) is treated differently by applying baseline1 , as these deals are extremely p opular and don’t follow th e general multiplicativ e pro cess. The jus- tification for app ly ing baseline1 is that, these d eals are so app ealing that local merchan ts usually place quantity limits. As we observed b efore, deals in Group on are usually tipp ed after about 7 hours. Before tipping, the purchase dy nam- ics is go verned by random disco very instead of the m ulti- plicativ e pro cess, thus th e social p ropagation model fails to ac hieve go o d p erformance. How ev er, we fin d th at there is an inflection p oint whic h o ccurs at ab out 7 hours. A fter 7 hours of observ ations, the so cial propagation mo del ex h ibits relativ ely goo d performance, and it performs m uch better with more hours of observ ation. In Figure 9 (f ), relative error distributions of baseline 1 and SP with 12-hour ob - serv ation are ex amined. W e find that the relativ e error is less than 50% for ov er 90% of deals when using SP , and there are ab out 70% of d eals achieving less than 20% relative error when app lying SP . In the exp erimen t, we incorp orated all the attributes of the deals into the multi-linear regression (denoted as MLR ) mod el, includin g the tipping point. Tipping p oints can b e considered as the observ ation of th e number of p u rchas es at around 6-8 hours. T herefore, as shown in Figure 9(f ) , th e 2 4 6 8 10 12 0 0.5 1 1.5 # of hours to observe relative error (a) Baseline-1 2 4 6 8 10 12 0 2 4 6 8 10 12 14 # of hours to observe relative error (b) Baseline-2 2 4 6 8 10 12 0 1 2 3 4 5 6 7 # of hours to observe relative error (c) S ocial Propagation Model 2 4 6 8 10 12 0 0.5 1 1.5 2 2.5 # of hours to observe average relative error SP baseline2 baseline1 (d) Comparison 0 0.2 0.4 0.6 0.8 1 0 0.5 1 1.5 relative error cumulative probability baseline1 SP (e) R elativ e error distribution Figure 10: Performance comparison of prediction of the num b er of purc hases after one day in Livi ngSo cial. In (a)-(d), line s denote the average relative e rror, and shaded regions co ver the areas of one-standard e rror. multi-li near regression mod el ac hieves a comparable p erfor- mance with our mod el within an observ ation p erio d of 6 hours. T o exemplify the prediction accuracy , w e show the results from a few Groupon deals in T able 2. As a refin ement for Group on deals, we p erform baseline1 if the deal h as not tipp ed; otherwise, we app ly the social propagation ( SP ) model. 5.2.2 Experimen ts with Liv ingSocial Deals W e cond ucted simila r exp eriments on the LivingSocial dataset. As sho wn in Figure 10, ou r social propagation mod el ( SP ) alwa y s outp erforms baseline2 and b eats base- line1 with more than 2-hours of observ ations. Beca use of the limi tations of the crawl ing technique, w e do not hav e information ab out which d eal is the featured one in a given cit y; and there is no tipping p oint in LivingSo cial, which preven ts the multi-linear regression mo del from generating goo d predictions. How ev er, the social p ropagation m o del sho ws very go od p erformance in LivingSo cial. In particular, w e examine the d istribu t ion of relative errors for predictions based on SP and baseline1 with 12-hours of observ ations in LivingSo cial. As sho wn in Figure 10(e), w e find that there are about 65 % of deals with less than 50% relativ e error; and SP alw a ys outperforms baseline1 . Similarly , w e sho w prediction results from some Living- Social deals in T able 3. As sho wn in T able 3, th e social propagation model exhibits better prediction performance than b oth b aselines, in terms of relative error. Finally , our design for purchase prediction of Group on deals is that we p erform baseline1 if with less than 3-hour observ ation; otherwise, we apply the social propagation ( SP ) mod el. Note that du e to different mechanisms in Group on and LivingSoical, inflection p oints are p laced at very dif- feren t times (i.e., 6- 8 hours in Group on, and 2-4 hours in LivingSo cial). Therefore, SP can b e applied earlier in Living- Social th an in Group on. How ever, as shown in Figure 9(e) and Figure 10( e), the relative error measured on t h e test set decreases rapidly for Group on, while for Liv in gS o cial th e prediction conv erges more slo wly t o t he actual v alue. After 17 hours, the exp ected relativ e error ob t ained when esti- mating one-day p urchases of a deal by using SP is ab out 20%, while t h e same relative error is attained 13 hours after a Group on deal is launched. This is due to th e fact that nov elt y decay is faster in Group on than in Liv ingSocial, i.e. it takes 7 h ours in Group on to reach the saturating p oint; while it tak es ab out 14 hours in LivingSocial to reac h the saturating p oint in Figure 7. So it is easier to p redict the one-day p urchase s of Group on deals with few er hours of ob- serv ations ( after tippin g). O ne possible explanation of this is that the tipping p oint incentive mechanism for propagat- ing deals in Groupon disapp ears after th e tipp ing p oint has b een reac hed. In LivingSo cial, on the other hand, the incen- tive t o propagate a deal is alwa ys present for at least some users and furthermore the individual gain of p ropagating is greater. 6. CONCLUSIONS In this pap er, we p resen ted a stud y of the group purchas- ing b ehavior of daily deals in Group on and LivingSo cial and introduced a predictive dynamic model of collective atten- tion for group buying b ehavior. Using large data sets from b oth Group on an d LivingSocial w e show ed how the mo del w as able to predict the p opularity of group deals as a func- tion of time. Ou r main finding is that th e d ifferen t incentiv e mec hanisms in Groupon and LivingSo cial lead to different propagation b ehavior, whic h in t urn leads to differences in predictabilit y . H o wev er, the basic sto chas tic processes as w ell as th e distributional parameters of growth and deca y are strikingly simil ar. Given that Groupon no longer pro- [Deal Title: Coastal Contacts ] $60 to Sp end on Prescription Eyeg lasses (Now $19) Model Real purchases Predicted purchases Relative error baseline1 with 12-hour observ ation 129 32 0.75 baseline2 with 12-hour observ ation 129 245 0.90 SP with 12-hour observ ation 1 29 110 0.14 [Deal Title: Daw gs!] $10 (Pa y $5) or $20 (Pa y $10) t o Sp end on F o od and D rink Model Real purchases Predicted purchases Relative error baseline1 with 12-hour observ ation 75 28 0.63 baseline2 with 12-hour observ ation 75 147 0.96 SP with 12-hour observ ation 7 5 110 0.47 T able 3: Example prediction res ults for Liv i ngSocial de als. vides detailed statistics of p u rchas es o ver time, the mo dels presented here can not easily b e applied by any observer. How ever, b oth deal site owners and merc hants should b e able to b enefit from analyzing t he early stream of pu rchas es using the mo dels presented here. Our work also gives some insigh ts in to how different incentiv e mechanisms can affect the longevity of propagation momen tum. These insights could b e exp loited in lo cal marketing campaigns where v iral and social dissemination of offers is desirable. 7. REFERENCES [1] A. Arabshahi. Un d ressing group on: An analysis of the group on bu siness mo del, December 2010. Avai lable at http://w ww.ahmadalia.com. [2] S. Asur, B. A. Hub erman, G. Szab´ o, and C. W ang. T rends in so cial media : P ersistence and deca y . CoRR , abs/1102. 1402, 2011. [3] E. Bakshy , B. Karrer, and L. A. Adamic. So cial influence and the d iffusion of user-created content. I n ACM Confer enc e on Ele ctr oni c Commer c e , pages 325–334 , 2009. [4] J. W. Byers, M. Mitzenmacher, M. Potami as, and G. Zerv as. A month in the life of group on. CoRR , abs/1105. 0903, 2011. [5] R. Colbaugh and K. Glass. Early w arning analysis for social d iffu sion even ts. In ISI , pages 37–42, 2010. [6] U. M. Dholakia. How effective are groupon promotions for b usinesses? ( septem b er 28, 2010), September 28, 2010. Av ailable at SSRN : http://ss rn.com/abstract=1696327. [7] P . DiMaggio and H. Louch. So cially em b edded consumer transactions: F or what kinds of purchases do p eople most often use n et works? Americ an So ci olo gi c al R eview , 63:619–637, 1998. [8] M. Grab chak, N. L. Bhamidipati, R. Bhatt, and D. Garg. A daptive p olicies for selecting group on style ch unked reward ads in a sto c hastic k napsack framew ork. In WWW , pages 167–176, 2011. [9] S. Guo, M. W ang, and J. Lesko vec. The role of social netw orks in online shoppin g: Information p assing, price of trust, and consumer choice. In ACM Confer enc e on El e ctr onic Commer c e (EC) , 2011. [10] JiWire. JiWire Mobile Au dience I n sigh ts Rep ort Q 1 2011, 2011. http://www.ji wire.com/insigh ts . [11] K . Lerman and A. Galsty an. Analysis of so cial vo ting patterns on digg. I n A CM SIGCOMM Workshop on Online So cial Networks , 2008. [12] K . Lerman and R. Ghosh. Information contagio n: an empirical stud y of spread of n ews on digg and twi tter social n etw orks. In Pr o c e e dings of 4th I nternational Confer enc e on W eblo gs and So cial Me dia (ICWSM) , Ma y 2010. [13] K . Lerman and T. Hogg. Using a mo del of social dynamics to predict p opularit y of n ews. In Pr o c e e dings of 19th International World Wi de Web Conf er enc e (WWW) , 2010. [14] K . Lerman and T. Hogg. Using sto c hastic m o dels to describe and p redict so cial dyn amics of w eb u sers. to app e ar in A CM T r ansactions on Intel li gent Systems and T e chnolo gy , 2011. [15] J. Lesko vec, L. A. Adamic, and B. A. Hub erman. The dynamics of v iral marketing. ACM T r ansactions on the Web , 1(1), 2007. [16] G. S zab´ o and B. A. Hub erman. Predicting the p opularit y of online conten t. Comm un. ACM , 53(8):80–8 8, 2010. [17] F. W u and B. A. Hub erman. Nov elt y and collectiv e attentio n. PNAS , 104(45), 2007.
Original Paper
Loading high-quality paper...
Comments & Academic Discussion
Loading comments...
Leave a Comment