Quality assessment for short oligonucleotide microarray data
Quality of microarray gene expression data has emerged as a new research topic. As in other areas, microarray quality is assessed by comparing suitable numerical summaries across microarrays, so that outliers and trends can be visualized, and poor qu…
Authors: ** - **Julia Brettschneider** (Warwick University, Department of Statistics, UK) – *교신 저자* - **François Collin** (University of California
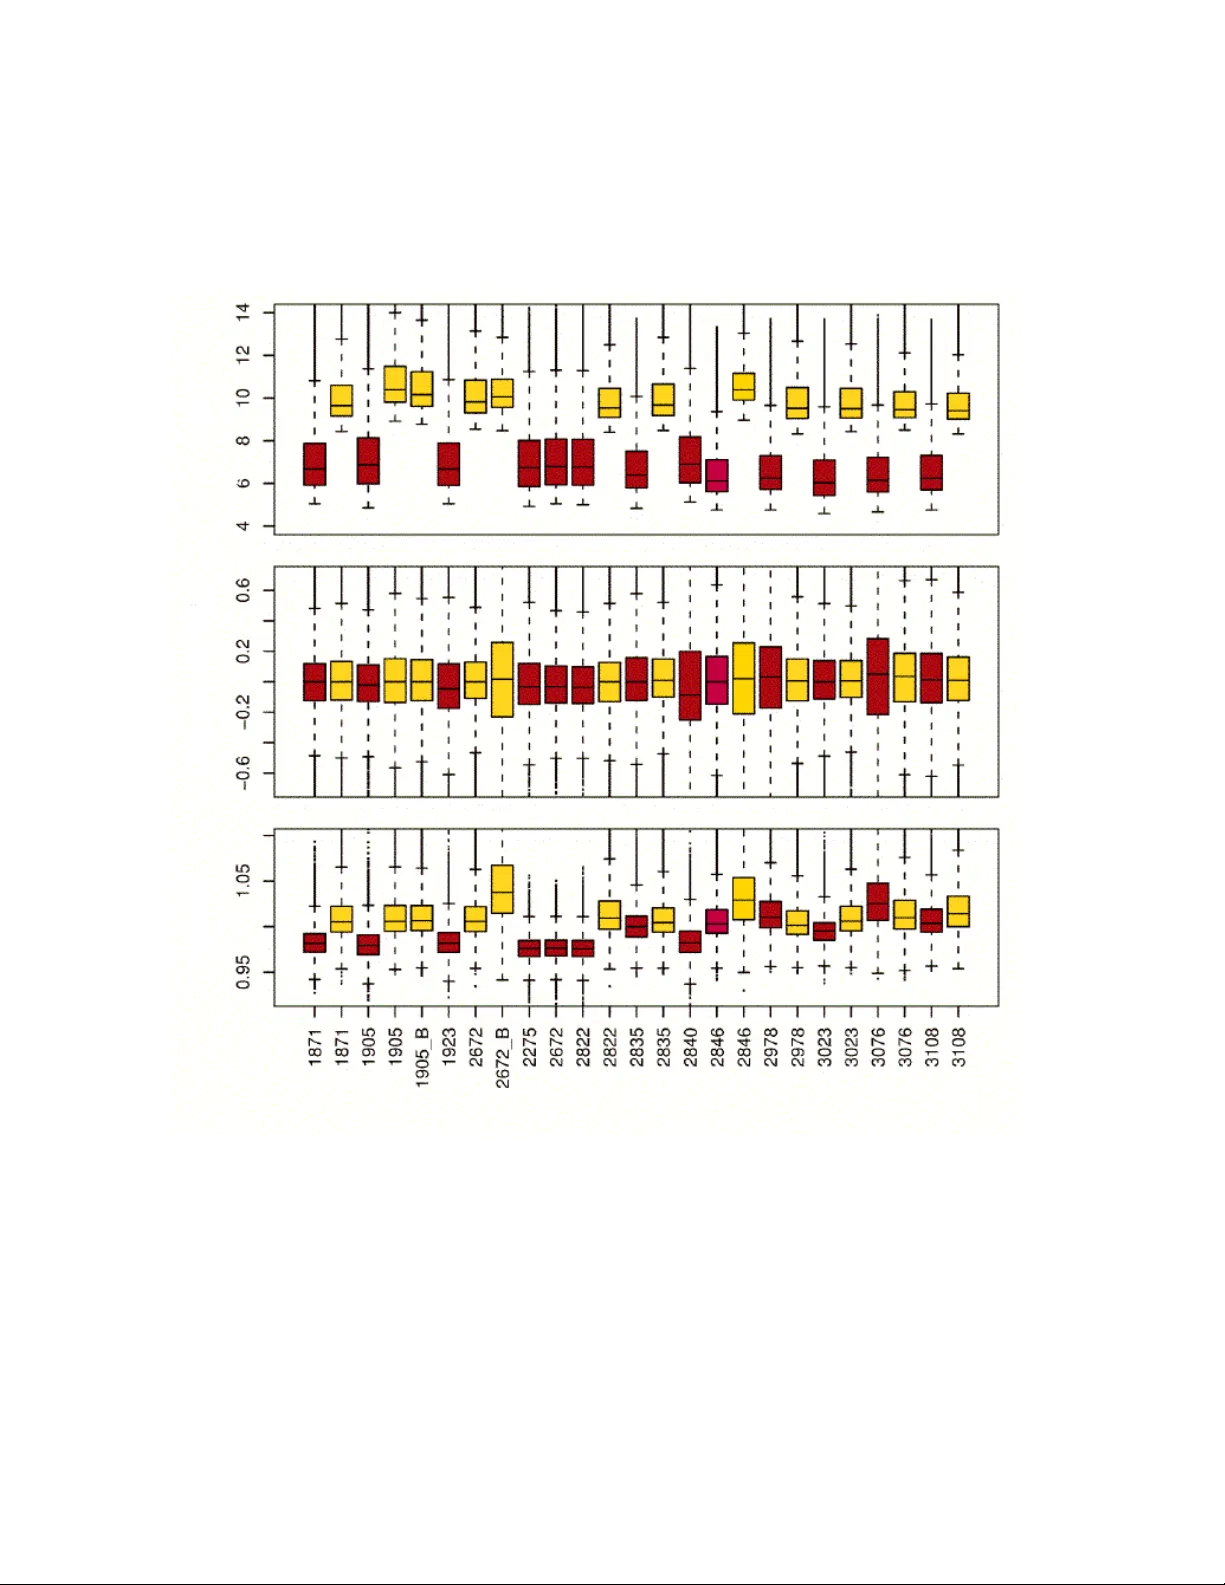
T o b e publishe d in T e chnometrics (with Discussion) Julia Brettsc hneider a c ∗ , F ran¸ cois Collin b , Benjamin M. Bolstad b , T erence P . Sp eed b d Qualit y assessmen t for short oligon ucleotide microarra y data Qualit y of microarra y gene expression data has emerged as a new research topic. As in other areas, microarray quality is assessed by comparing suitable n umerical summaries across microarra ys, so that outliers and trends can b e visualized, and p oor qualit y arra ys or v ariable qualit y sets of arrays can be iden tified. Since each single arra y comprises tens or hundreds of thousands of measuremen ts, the c hallenge is to find numerical summaries which can be used to mak e accurate qualit y calls. T o this end, sev eral new qualit y measures are in troduced based on probe level and prob eset level information, all obtained as a b y-pro duct of the lo w-level analysis algorithms RMA/fitPLM for Affymetrix GeneChips. Qualit y landscap es spatially lo calize c hip or hybridization problems. Numerical chip qualit y measures are deriv ed from the distributions of Normalize d Unsc ale d Standard Err ors and of Relative L o g Expr essions. Qualit y of chip batches is assessed b y R esidual Sc ale F actors. These quality assessment measures are demonstrated on a v ariety of datasets (spike-in exp erimen ts, small lab exp erimen ts, m ulti-site studies). They are compared with Affymetrix’s individual chip quality report. KEYW ORDS: qualit y con trol, microarra ys, Affymetrix chips, relativ e log expression, normalized unscaled standard errors, residual scale factors. 1. INTRODUCTION With the introduction of microarrays biologist hav e b een witnessing entire labs shrinking to matc hbox size. This pap er invites quality researchers to join scien tists on their fantastic journey in to the w orld of microscopic high-throughput measuremen t technologies. Building a biological organism as laid out b y the genetic code is a multi-step process with ro om for v ariation at each step. The first steps, as describ ed by the Do gma of mole cular biolo gy, are genes (and DNA sequence in general), their transcripts and proteins. Substan tial factors contributing to their v ariation in b oth structure and abundance include cell t yp e, developmen tal stage, genetic background and en vironmental conditions. Connecting molecular observ ations to the state of an organism is a cen tral in terest in molecular biology . This includes the study of the gene and protein functions and interactions, and their alteration in response to c hanges in en vironmen tal and developmen tal conditions. T raditional metho ds in molecular biology generally w ork on a ”one gene (or protein) in one experiment” basis. With the in v en tion of micr o arr ays huge n umbers of suc h macromolecules can now b e monitored in one exp erimen t. The most common kinds are gene expr ession micr o arr ays, whic h measure the mRNA transcript abundance for tens of thousands of genes sim ultaneously . a Universit y of W arwick, Department of Statistics, Cov en try , UK; b Universit y of California at Berkeley , Department of Statistics, Berkeley , California, USA; c Queen’s Universit y , Cancer Research Institute Division of Cancer Care & Epidemiology and Department of Communit y Heath & Epidemiology , Kingston, Ontario, Canada; d W alter and Eliza Hall Institute Bioinformatics Division, Melb ourne, Australia. ∗ Corresponding author: julia.brettschneider@w arwic k.ac.uk 2 F or biologists, this high-throughput approach has opened up entirely new a v enues of research. Rather than exp erimen tally confirming the hypothesized role of a certain candidate gene in a certain cellular pro cess, they can use genome-wide comparisons to screen for all genes which might b e inv olv ed in that pro cess. One of the first examples of such an exploratory approach is the expression profiling study of mitotic yeast cells b y Cho et al. (1998) which determined a set of a few hundred genes inv olv ed in the cell cycle and triggered a cascade of articles re-analyzing the data or replicating the exp erimen t. Microarra ys ha v e b ecome a central to ol in cancer research initiated by the disco very and re-definition of tumor subt ypes based on molecular signatures (see e.g. Perou et al. (2000), Alizadeh et al. (2000), Ramaswam y and Golub (2002), Y eoh et al. (2002)). In Section 2 w e will explain different kinds of microarra y tec hnologies in more detail and describ e their curren t applications in life sciences research. A DNA microarray consists of a glass surface with a large n umber of distinct fragments of DNA called probes attached to it at fixed p ositions. A fluorescen tly lab elled sample containing a mixture of unknown quan tities of DNA molecules called the target is applied to the microarra y . Under the right chemical conditions, single-stranded fragmen ts of target DNA will base pair with the prob es whic h are their complements, with great specificity . This reaction is called hybridization, and is the reason DNA microarrays w ork. The fixed prob es are either fragments of DNA called complemen tary DNA (cDNA) obtained from messenger RNA (mRNA), or short fragments known to be complementary to part of a gene, sp otted onto the glass surface, or synthesized in situ. The p oin t of the exp erimen t is to quan tify the abundance in the target of DNA complementary to each particular prob e, and the h ybridization reaction follow ed by scanning allows this to b e done on a v ery large scale. The ra w data pro duced in a microarra y experiment consists of scanned images, where the image intensit y in the region of a probe is prop ortional to the amount of labelled target DNA that base pairs with that prob e. In this wa y w e can measure the abundance of thousands of DNA fragments in a target sample. Microarrays based on cDNA or long oligon ucleotide prob es t ypically use just one or a few prob es p er gene. The same prob e sequence sp otted in different lo cations, or prob e sequences complementary to differen t parts of the same gene can be used to giv e within array replication. Short oligonucleotide microarrays t ypically use a larger num b er p er gene, e.g. 11 for the HU133 Affymetrix arra y p er gene. Such a set of 11 is called prob eset for that gene, and the prob es in a probe set are arranged randomly o v er the array . In the biological literature, microarra ys are also referred to as (gene) chips or slides. When the first microarray platforms were in tro duced in the early 90s, the most intriguing fact ab out them w as the sheer n umber of genes that could b e assa y ed simultaneously . Assays that used to b e done one gene at a time, could suddenly b e produced for thousands of genes at once. A decade later, high-densit y microarrays would even fit en tire genomes of higher organisms. After the initial euphoria, the research communit y b ecame aw are that findings based solely on microarra y measurements w ere not alw ays as repro ducible as they w ould hav e lik ed and that studies with inconclusive results were quite common. With this high-throughput measuremen t technology b ecoming established in man y branches of life sciences researc h, scientists in b oth academic and corp orate environmen ts raised their exp ectations concerning the v alidit y of the measurements. Data quality issues are now frequently addressed at meetings of the Microarray Gene Expression Database group (MGED). The Micr o arr ay Quality Contr ol pr oje ct, a comm unit y-wide effort, under the auspices of the U.S. F o od and Drug Administration (FD A), is aiming at establishing op er ational metrics to ob jectiv ely assess the p erformance of seven microarra y platform and develop minimal qualit y standards. Their assessment is based on the p erformance of a set of standardized external 3 RNA controls. The first formal results of this pro ject hav e been published in a series of articles in the Septem b er 2006 issue of Natur e Biote chnolo gy. Assessing the quality of micr o arr ay data has emerged as a new researc h topic for statisticians. In this pap er, w e conceptualize microarray data quality issues from a p ersp ectiv e which includes the technology itself as well as their practical use by the research communit y . W e characterize the nature of microarra y data from a qualit y assessmen t persp ectiv e, and w e explain the differen t lev els of microarra y data quality assessmen t. Then we focus on short oligonucleotide microarra ys to dev elop a set of specific statistical data quality assessment methods including b oth n umerical measures and spatial diagnostics. Assumptions and hopes ab out the quality of the measurements hav e become a ma jor issue in microarra y purc hasing. Despite their substan tially higher costs, Affymetrix short oligon ucleotide microarra ys hav e b ecome a widespread alternative to cDNA chips. Informally , they are considered the industrial standard among all microarra y platforms. More recently , Agilent’s non-con tact prin ted high-density cDNA microarra ys and Illumina’s b ead arrays ha ve fueled the competition for high qualit y c hips. Scientist feel the need for systematic quality assessmen t metho ds allo wing them to compare different lab oratories, differen t chip generation, or differen t platforms. They even lack go od metho ds for selecting chips of go od enough qualit y to b e included in statistical data analysis b ey ond prepro cessing. W e ha v e observ ed several questionable practices in the recent past: • Skipping h ybridization QA/QC all together • Discarding en tire batches of chips follo wing the detection of a few po or qualit y chips • Basing hybridization QA/QC on raw data rather than data that has already b een had large- scale tec hnical biases remov ed • Delaying any QA/QC until all hybridizations are completed, thereby losing the opp ortunit y to remo ve sp ecific causes of po or qualit y at an early stage • F ocussing on v alidation by another measuremen t tec hnolgy (e.g, quan titativ e PCR) in Pub- lication requiremen ts rather than addressing the qualit y of the microarray data in the first place • Merging of data of v ariable quality into one database with the inherent risk of sw amping it with po or qualit y data (as this pro duced at a faster rate due to few replicates, less qualit y c hecks, less re-doing of failed hybridizations etc.) The communit y of microarra y users has not y et agreed on a framew ork to measure accurary or precision in microarra y exp erimen ts. Without univ ersally accepted metho ds for qualit y assessmen t, and guidelines for acceptance, statisticians’ judgemen ts ab out data quality ma y b e p erceiv ed as arbitrary b y exp erimen talists. Users’ exp ectations as to the level of gene expression data qualit y v ary substantially . They can dep end on time frame and financial constrain ts, as well as on the purp ose of their data collection. Shewhart (1939), p. 120/21, explained the standp oin t of the ap- plied scien tist: ”He knows that if he wer e to act up on the me agr e evidenc e sometimes available to the pur e scien- tist, he would make the same mistakes as the pur e scientist makes in estimates of ac cur acy and pr e cisions. He also knows that thr ough his mistakes some one may lose a lot of money or suffer physic al injury or b oth. [...] He do es not c onsider his job simply that of doing the b est he c an with 4 the available data; it is his job to get enough data b efor e making this estimate.” F ollowing this philosoph y , microarra y data used for medical diagnostics should meet high quality standards. In contrast, microarray data collected for a study of the etiology of a complex genetic disease in a heterogeneous p opulation, one ma y decide to tolerate low er standards at the lev el of individual microarrays and inv est the resources in a larger sample size. Scientists need informative qualit y assessment to ols to allo w them to c ho ose the most appropriate tec hnology and optimal exp erimen tal design for their precision needs, within their time and budget constraints. The explicit goals of quality assessment for m icroarra ys are manifold. Whic h goals can b e en visioned dep ends on the resources and time horizon and on the kind of user – single small user, big user, core faculity , multi-cen ter study , or ”researcher in to qualit y”. The findings can b e used to simply exclude chips from further study or recommend to ha v e samples repro cessed. They can b e im b edded in a larger data quality managemen t and impro vemen t plan. Typical qualit y phenomena to lo ok for include: • Outlier ch ips • T rends or patterns o v er time • Effects of particular h ybridization conditions and sample characteristics • Changes in quality b et w een batc hes of chips, cohorts of samples, lab sites etc. • Systematic quality differences b et w een subgroups of a study Some asp ects of quality assessmen t and control for cDNA hav e b een discussed in the literature. Among these, Beissbarth et al. (2000) and Finkelstein et al. (2002) emphasize the need for qualit y con trol and replication. W ang et al. (2001) define a quality score for eac h sp ot based on intensit y c haracteristics and spatial information, while Hautaniemi et al. (2003) approach this with Ba ysian net works. Smyth et al. (2003) and Ritchie et al. (2006) suggest explicit statistical qualit y measures based on individual sp ot observ ations using the image analysis softw are Spot from Y ang et al. (2001). Mo del et al. (2002) apply multiv ariate statistical pro cess con trol to detect single outlier c hips. The prepro cessing and data management softw are pack age arrayMagic of Buness et al. (2005) includes quality diagnostics. The b ook b y Zhang et al. (2004) is a comprehensive collec- tion of quality assessment and control issues concerning the v arious stages of cDNA microarray exp erimen ts including sample preparation, all from an experimentalist’s p erspective. Novik o v and Barillot (2005) suggest sp ot qualit y scores based on the v ariance of the ratio estimates of replicates (on the same chip or on differen t chips). Spatial biases ha v e also b een addressed. In examining the relationship betw een signal in tensit y and prin t-order, Sm yth (2002) rev eals a plate-effect. The normalization methodology by Y ang et al. (2002) incorporates spatial information suc h as prin t-tip group or plate, to remo v e spatial biases created b y the tec hnological processes. Kluger et al. (2003) and Qian et al. (2003) found pairwise correlations betw een genes due to their relative p ositioning of the spots on the slide and suggest a localized mean normalization method to adjust for this. T om et al. (2005) prop osed a metho d of identifying p oor quality sp ots, and of addressing this by assign- ing qualit y weigh ts. Reimers and W einstein (2005) developed an approac h for the visualization and quan titation of regional bias applicable to b oth cDNA and Affymetrix microarrays. F or Affymetrix arrays, the commercial softw are GCOS (2004) includes a Quality r ep ort with a dozen scores for each microarray (see Subsection 3.2). None of them makes use of the gene expression summaries directly , and there are no universally recognized guidelines as to which 5 range should b e considered go od quality for eac h of the GCOS quality scores. Users of short oligon ucleotide chips hav e found that the qualit y picture delivered by the GCOS qualit y report is incomplete or not sensitive enough, and that it is rarely helpful in assigning causes to p oor quality . The literature on quality assessment and control for short oligon ucleotide arra ys is still sparse, though the imp ortance of the topic has b een stressed in numerous places, and some authors hav e addressed hav e lo ok ed at sp ecific issues. An algorithm for prob eset qualit y assessmen t has b een suggested b y Bolstad (2003). Naef et al. (2003) transfer the w eigh t of a measuremen t to a subset of prob es with optimal linear response at a giv en concen tration. Gautier et al. (2004b) inv estigate the effect of up dating the mapping of probes to genes on the estimated expression v alues. Smith and Hallett (2004) define four types of degenerate prob e behaviour based on free energy computations and pattern recognition. Finkelstein (2005) ev aluated the Affymetrix qualit y reports of ov er 5,000 c hips collected by St. Jude Children’s Researc h Hospital ov er a perio d of three y ears, and link ed some quality trends to exp erimen tal conditions. Hu et al. (2005) extend traditional effect size mo dels to com bine data from different microarra y exp erimen ts, incorp orating a qualit y measure for eac h gene in each study . The detection of specific qualit y issues suc h as the extraction, handling and amount of RNA, has b een studied by sev eral authors (e.g. Arc her et al. (2006), Dumur et al. (2004), Sc ho or et al. (2003), Thach et al. (2003)). Before deriving new metho ds for assessing microarray data qualit y , w e will relate the issue to established researc h in to data qualit y from other academic disciplines, emphasizing the particular c haracteristics of microarra y data (Section 3.1). A conceptual approac h to the statistical assessmen t of microarray data quality is suggested in Subsection 3.2, and is follow ed by a summary of the existing qualit y measures for Affymetrix chips. The theoretical basis of this pap er is Section 4, where we in tro duce new numerical and spa- tial qualit y assessment metho ds for short oligonucleotide arrays. Two imp ortan t asp ects of our approac h are: • The qualit y measures are based on al l the data from the array . • The qualit y measures are computed after hybridization and data prepro cessing. More sp ecifically , we mak e use of prob e level and prob eset lev el quantities obtained as by-products of the Robust Multichip Analysis (RMA/fitPLM) prepro cessing algorithm presented in Irizarry et al. (2003), Bolstad et al. (2004) and Gautier et al. (2004a). Our Quality L andsc ap es serve as tools for visual qualit y inspection of the arra ys after h ybridiza- tion. These are tw o dimensional pseudo-images of the c hips based on probe lev el quantities, namely the weigh ts and residuals computed b y RMA/fitPLM. These Qualit y Landscapes allow us to im- mediately relate quality to an actual lo cation on the chip, a crucial step in detecting sp ecial causes for p oor chip qualit y . Our numerical qualit y assessment is based on t wo distributions computed at the probeset lev el, the Normalize d Unsc ale d Standar d Err or (NUSE) and the R elative L o g Ex- pr ession (RLE). Giv en a fairly general biological assumption is fulfilled, these distributions can b e in terpreted for c hip qualit y assessmen t. W e further suggest w ays of con v enien tly visualizing and summarizing these distributions for larger chip sets and of relating this quality assessmen t with other factors in the exp erimen t, to permit the detection of sp ecial causes for p oor qualit y to reveal biases. Qualit y of gene expression data can b e assessed on a num b er of levels, including that of prob eset, chip and batc h of c hips. Another aspect of quality assessment concerns batc hes of c hips. W e introduce the R esidual Sc ale F actor (RSF), a measure of chip batch qualit y . This allows us 6 to compare qualit y across batches of chips within an exp erimen t, or across exp erimen ts. All our measures can be computed for all av ailable t ypes of short oligonuceotide chips giv en the raw data (CEL file) for eac h chip and the matching CDF file. Soft w are pac k ages are described in Bolstad et al. (2005) and a v ailable at www.bioconductor.org . In Section 6 we extensively illustrate and ev aluate our quality assessment metho ds on the exp erimen tal microarra y datasets describ ed in Section 5. T o reflect the fact that qualit y assessment is a necessary and fruitful step in studies of any kind, we use a v ariety of datasets, in volving tissues ranging from fruit fly em bryos to h uman brains, and from academic, clinical, and corp orate labs. W e show how quality trends and patterns can b e asso ciated with sample characteristics and/or exp erimen tal conditions, and we compare our measures with the Affymetrix GCOS quality rep ort. 2. BA CK GROUND: MICROARRA Y TECHNOLOGY AND APPLICA TIONS IN BIOMEDICAL RESEARCH After the hun t for new genes has dominated genetics in the 80s and 90s of the last century , there has b e a remark able shift in molecular biology research goals tow ards a comprehensiv e un- derstanding of the function of macromolecules on different lev els in a biological organism. Ho w and to what extend do genes control the construction and main tenance of the organism? What is the role of intermediate gene products such as RNA tr anscripts ? How do the macromolecules in teract with others? The latter may refer to horizontal interaction, such as genes with genes, or proteins with proteins. It ma y also refer to vertic al in teraction, such as b et w een genes and proteins. Genomics and pr ote omics – in professional slang summarized as ’omics scienc es – ha v e started to put an emphasis on functions. As the same time, these research areas hav e b ecome more quantitativ e, and they hav e broadened the p erspective in the sense of observing huge num- b ers of macromolecules sim ultaneously . These trends ha v e b een driv en by recent biotechnological in ven tions, the most prominent ones b eing micr o arr ays. With these high-thr oughput molecular measuremen t instruments, the relativ e concen tration of huge n um bers of macromolecules can b e obtained sim ultaneously in one exp erimen t. This section will give an ov erview of the biological bac kground and the applications of microarrays in biomedical researc h. F or an extended intro- duction to ’omics scienc es and to microarra y-based research we refer to the excellen t collections of articles in the three Nature Genetics Supplemen ts The Chipping F or e c ast I, II, III (1999, 2002, 2005) and to the recen t review pap er by Hoheisel (2006). 2.1 Gene exp ression and construction of biological organisms Though the p opular b elief ab out genes is still very deterministic – once they are put into place, they function in a preprogrammed straigh t forward wa y – for biologists the effect of a gene is v ariable. Most cells in an organism contain essentially the same set of genes. How ever, cells will lo ok and act differently dep ending on which organ they b elong to, the state of the organ (e.g. healthy vs. diseased), the dev elopmental stage of the cell, or the phase of the cell cycle. This is predominantly the result of differences in the abundance, distribution, and state of the cells’ proteins. According to the c entr al do gma of mole cular biolo gy the pro duction of proteins is con trolled b y DNA (for simplicit y , the exceptions to this rule are omitted here). Proteins are p olymers built up from 20 different kinds of amino acids. Genes are tr anscrib e d into DNA- lik e macromolecules called messenger RNA (mRNA) , whic h go es from the c hromosomes to the 7 rib osomes. There, tr anslation takes place, conv erting mRNA into the amino acid chains which fold in to proteins. The term gene expr ession is defined as the relative concentration of mRNA and protein pro duced b y that gene. Dep ending on the c on text, how ev er, it is often used to refer to only one of the t wo. The gene expr ession pr ofile of a type of cell usually refers to the relative abundance of each of the mRNA species in the total cellular mRNA population. F rom a practical p oin t of view, in particular b y man y areas of medical researc h, protein abundance is seen as generally more in teresting than mRNA abundance. The measurement of protein abundances, ho w ever, is still muc h more difficult to measure on a large scale than mRNA abundance. 2.2 Microa rray gene expression measurement and applications There is one prop ert y whic h is peculiar to nucleic acids: their complementary structure. DNA is reliably replicated by separating the tw o strands, and complementing each of the single strands to giv e a copy of the original DNA. The same mechanism can b e used to detect a particular DNA or RNA sequence in a mixed sample. The first to ol to measure gene expression in a sample of cells of a was introduced in 1975. A Southern blot – named for its inv en tor – is a multi-stage lab oratory pro cedure which pro duces a pattern of bands representing the activit y of a small set of pre-selected genes. During the 1980s sp otted arrays on n ylon holding bacterial colonies carrying differen t genomic inserts w ere in tro duced. In the early 1990s, the latter w ould be exchanged for preiden tified cDNAs. The in tro duction of gene expr ession micr o arr ays on glass slides in the mid 1990s brough t a substantial increase in feature densit y . With the new tec hnology , gene expression measuremen ts could b e taken in parallel for thousands of genes. Mo dern microarray platforms ev en assess the expression levels of tens of thousands of genes simultaneously . A gene expression microarray is a small piece of glass onto whic h a priori known DNA frag- men ts called pr ob es are attached at fixed p ositions. In a chemical pro cess called hybridization, the microarray is brough t into contact with material from a sample of cells. Each prob e binds to its complemen tary coun terpart, an mRNA molecule (or a complementary DNA copy) from the sample, which we refer to as the tar get . The h ybridization reaction pro duct is made visible using fluorescen t dy es or other (e.g. radioactive) markers, whic h are applied to the sample prior to hy- bridization. The readout of the microarra y exp erimen t is a scanned image of the lab elled DNA. Microarra ys are specially designed to in terrogate the genomes of particular organisms, and so there are y east, fruit fly , w orm and h uman arra ys, to name just a few. There are three ma jor platforms for microarra y-based gene expression measuremen t: sp otte d two-c olor cDNA arr ays, long oligonucle otide arr ays and short oligonucle otide arr ays. In the plat- form sp ecific parts of this paper we will fo cus on the latter. On a short oligonucleotide microarray , eac h gene is represented on the array b y a pr ob e set that uniquely identifies the gene. The in- dividual probes in the set are chosen to hav e relativ ely uniform h ybridization c haracteristics. In the Affymetrix HU133 arrays, for example, each prob e set consists of 11 to 20 prob e sequence pairs. Eac h pairs consists of a p erfe ct match (PM) prob e, a 25 bases long oligonucleotide that matc hes a part of the gene’s sequence, and a corresponding mismatch (MM) probe, that has the same sequence as the PM except for the center base being flipp ed to its complemen tary letter. The MM prob es are in tended to giv e an estimate of the random hybridization and cross hybridization signals, see Lockhart et al. (1996) and Lipsh utz et al. (1999) for more details. Other Affymetrix gene expression arra ys ma y differ from the HU133 in the num ber of prob es per probe set. Exon 8 arra ys do not hav e MM prob es. Most of the arrays pro duced b y Nimblegen are comp osed from 60mer probes, but some are using 25mer prob es. The n um b er of prob es p er probeset is adapted to the total n umber of prob esets on the array to mak e optimal use of the space. 2.3 Applications of gene exp ression microarra ys in biomedical research Besides b eing more efficient than the classical gene-b y-gene approach, microarra ys op en up en tirely new av en ues for research. They offer a comprehensive and cohesive approac h to measuring the activity of the genome. In particular, this fosters the study of in teractions. A typical goal of a microarra y based research pro ject is the search for genes that behav e differently b et w een differen t cell p opulations. Some of the most common examples for comparisons are diseased vs. health y cells, injured vs. healthy tissue, young vs. old organism, treated vs. un treated cells. More explicitly , life sciences researc hers try to find answers to questions suc h as the follo wing. Which genes are affected b y environmen tal c hanges or in resp onse to a drug? How do the gene expression levels differ across v arious mutan ts? What is the gene expression signature of a particular disease? Whic h genes are in volv ed in eac h stage of a cellular pro cess? Whic h genes play a role in the developmen t of an organism? Or, more generally , whic h genes v ary their activity with time? 2.4 Other kinds of microa rrays and their applications The principle of microarray measurement technology has b een used to assess molecules other than mRNA. A num ber of platforms are currently at v arious stages of developmen t (see review b y Hoheisel (2006)). SNP chips detect single nucleotide p olymorphisms. They are an example for a well developed microarray-based genotyping platform. CGH arrays are based on comparative genome hybridization. This metho d p ermits the analysis of c hanges in gene copy num ber for h uge num bers of prob es simultaneously . A recent mo dification, representational oligonucleotide microarra y analysis (ROMA), offers substantially b etter resolution. Both SNP chips and CGH arra ys are genome-based metho ds, whic h, in con trast to the gene expression-based methods, can exploit the stabilit y of DNA. The most common application of these tec hnologies is the lo calization of disease genes based on asso ciation with phenot ypic traits. An tib ody protein chips are used to determine the lev el of proteins in a sample b y binding them to an tib ody prob es immobilized on the microarra y . This tec hnology is still considered semi-quantitativ e, as the differen t sp ecificities and sensitivities of the antibo dies can lead to an inhomogeneit y betw een measurements that, so far, can not be corrected for. The applications of protein c hips are similar to the ones of gene expression microarra ys, except that the measurements are taken one step further downstream. More recen t platforms address multiple levels at the same time. ChIP-on-chip, also known as genome-wide lo cation analysis, is a technique for isolation and identification of the DNA sequences occupied by sp ecific DNA binding proteins in cells. 2.5 Statistical challenges The still gro wing list of statistical c hallenges stimulated by microarray data is a tour d’horizon in applied statistics; see e.g. Speed (2003), McLac hlan et al. (2004) and Wit and McClure (2004) for broad introductions. F rom a statistical p oin t of view a microarra y experiment has three main c hallenges: (i) measurement pro cess as multi-step bio c hemical and technological pro cedure (ar- ra y manufacturing, tissue acquisition, sample preparation, h ybridization, scanning) with eac h step 9 con tributing to the v ariation in the data; (ii) huge num bers measuremen ts of differen t (correlated) molecular sp ecies b eing tak e in parallel; (iii) unav ailabilit y of ’gold-standards’ cov ering a repre- sen tative part of these sp ecies. Statistical metho dology has primarily b een developed for gene expression microarrays, but most of the conceptual work applies directly to many kinds of mi- croarra ys and many of the actual metho ds can b e transferred to other microarray platforms fitting the c haracteristics listed ab o ve. The first steps of the data analysis, often referred to as pr epr o c essing or low level analysis , are the most platform-dep enden t tasks. F or t w o-color cDNA arrays this includes image analysis (see e.g. Y ang et al. (2001)) and normalization (see e.g. Y ang et al. (2002)). F or short oligon ucleotide c hip data this includes normalization (see e.g. Bolstad et al. (2003)) and the estimation of gene expression v alues (see e.g. Li and W ong (2001) and Irizarry et al. (2003) as w ell as subsequent pap ers b y these groups). Questions around the design of micorarra y exp erimen ts are mostly relev an t for t wo-color platforms (see e.g. Ch. 2 in Sp eed (2003), Kerr (2003) and further references there). Analysis b ey ond the prepro cessing steps is often referred to as downstr e am analysis. The main goal is to identify genes whic h act differently in different types of samples. Exploratory metho ds such as classification and cluster analysis ha ve quickly gained popularity for microarra y data analysis. F or reviews on such metho ds from a statistical p oin t of view see e.g. Ch. 2 and Ch. 3 in Speed (2003) and Ch. 3-7 in McLachlan et al. (2004). On the other side of the sp ectrum, h yp othesis-driv en inferen tial statistical metho ds are now well established and used. This approach t ypically takes a single-gene p erspective in the sense that it searches for individual genes that are expressed differentially across changing conditions; see e.g. Dudoit et al. (2002). The main challenge is the imprecision of the gene-sp ecific v ariance estimate, a problem that has b een tackled by strategies incorp orating a gene-unspecific comp onen t into the estimate; see e.g. Efron et al. (2001), L¨ onnstedt and Speed (2002), Cui et al. (2005) and references therein, and T ai and Sp eed (2006) for the case of microarra y time course data. T esting thousands of potentially highly correlated genes at the same time with only a few replicates raises a substantial multiple testing problem that has b een systematically addressed b y v arious authors incorp orating Beny amini’s and Ho c h b erg’s false disc overy r ate (FDR) ; see e.g. Storey (2003) and the review Dudoit et al. (2003). The joint analysis of pre-defined groups of genes based on a priori kno wledge has b ecome an established alternative to the genome-wide exploratory approac hes and the gene-by-gene analysis; see e.g. Subramanian et al. (2005) and Bild et al. (2006). While metho dology for microarra y data analysis has become a fast gro wing researc h area, the epistemological foundation of this research area shows gaps. Among other iss u es, Meh ta et al. (2004) addresses the problem of sim ultaneous v alidation of research results and research metho ds. Allison et al. (2006) offer a review of the main approac hes to microarra y data analysis dev elop ed so far and attempt to unify them. Man y softw are pack ages for microarray data analysis hav e b een made publicly av ailable by academic researc hers. In particular, there is the BioConductor pro ject, a comm unit y-wide effort to maintain a collection of R-pack ages for genomics applications at www.bioconductor.org . Many of the main pack ages are describ ed in Gentleman et al. (2005). 10 3. MICRO ARRA YS AND DA T A QUALITY 3.1 Cha racteristics of high-throughput molecular data Data qualit y is a well established aspect of man y quan titative researc h fields. The most striking difference betw een assessing the qualit y of a measuremen t as opp osed to assessing the quality of a man ufactured item is the additional lay er of uncertain ty . Concerns around the accuracy of mea- suremen ts ha v e a long tradition in ph ysics and astronomy; the entire third chapter of the classical b ook Shewhart (1939) is devoted to this field. Biometrics, psychometrics, and econometrics de- v elop ed around similar needs, and man y academic fields hav e grown a strong quantitativ e branch. All of them facing data qualit y questions. Clinical trials is a field that is increasingly aw are of the quality of large data collections (see Gassman et al. (1995) and other pap ers in this sp ecial issue). With its recent massive mo v e in to the quantitativ e field, functional genomics gav e birth to what some statisticians call genometrics. W e now touch on the ma jor points that characterize gene expression microarra y data from the p oin t of view of QA/QC. These p oin ts apply to other high-dimensional molecular measuremen ts as well. Unkno wn kind of data: Being a new tec hnology in the still unkno wn terrain of functional genomics, microarrays pro duce datasets with few known statistical prop erties, including shape of the distribution, magnitude and v ariance of the gene expression v alues, and the kind of correlation b et ween the expression lev els of different genes. This limits access to existing statistical metho ds. Sim ultaneous measuremen ts: Each microarra y pro duces measuremen ts for thousands of genes sim ultaneously . If w e measured just one gene at a time, some version of Shewhart control c harts could no doubt monitor quality . If w e measured a small n umber of genes, multiv ariate extensions of c on trol c harts migh t b e adequate. In a w a y , the use of control genes is one attempt b y biologists to scale do wn the task to a size that can b e managed by these classical approaches. Con trol genes, how ever, cannot b e regarded as typical represen tatives of the set of all the genes on the arrays. Gene expression measures are correlated because of both the biological interaction of genes, and dep endencies caused by the common measurement process. Biologically meaningful correlations b et ween genes can potentially ”con taminate” h ybridization qualit y assessment. Multidisciplinary teams: Microarray exp erimen ts are t ypically planned, conducted and ev aluated b y a team which may include scientists, statisticians, tec hnicians and physicians. In the in terdisciplinarity of the data production and handling, they are similar to large datasets in other researc h areas. F or survey data, Grov es (1987) names the risk asso ciated with such a “m´ elange of workers” . Among other things, he mentions: radically differen t purposes, lack of communication, disagreemen ts on the priorities among the comp onen ts of qualit y and concentration on the “error of c hoice” in their resp ectiv e discipline. The encouragemen t of a close co operation b et w een scien tists and statisticians in the care for measuremen t quality go es all the wa y back to Shewhart (1939), p.70/71: “Wher e do es the statisti- cian ’s work b e gin? [...] b efor e one turns over any sample of data to the statistician for the purp ose of setting toler anc es he should first ask the scientist (or engine er) to c o op er ate with the statistician in examining the available evidenc e of statistic al sontr ol. The statistician ’s work solely as a statis- tician b e gins after the scientist has satisfie d himself thr ough the applic ation of c ontr ol criteria that the sample has arisen under statistic al ly c ontr ol le d c onditions.” Systematic errors: As pointed out b y Loebl (1990), and, in the context of clinical trials, by Marinez et al. (1984), systematic errors in large datasets are muc h more relev an t than random 11 errors. Microarrays are typically used in studies in v olving different experimental or observ ational groups. Quality differences b et w een the groups are a p oten tial source of confounding. Heterogenous qualit y in data collections: Often microarray data from differen t sources are merged into one data collection. This includes differen t batches of chips within the same exp erimen t, data from different lab oratories participating in a single collaborative study , or data from different research teams sharing their measuremen ts with the wider comm unit y . Dep ending on the circumstances, the combination of data typically tak es place on one of the following levels: ra w data, prepro cessed data, gene expression summaries, lists of selected genes. Typically , no qualit y measures are attac hed to the data. Ev en if data are exchanged at the level of CEL files, heterogeneit y can cause problems. Some lab oratories filter out chips or repro cess the samples that were h ybridized to chips that did not pass screening tests, others do not. These are decision pro cesses that ideally should take place according to the same criteria. The nature of this problem is well known in data bank qualit y or data war ehousing (see e.g. W ang et al. (1995), W ang (2001), Redman (1992)). Re-using of shared data: Gene expression data are usually generated and used to answer a particular set of biological questions. Data are no w often being placed on the web to enable the general communit y to verify the analysis and try alternativ e approaches to the original biological question. Data ma y also find a secondary use in answ ering mo dified questions. The shifted focus p oten tially requires a new round of QA/QC, as precision needs might ha ve c hanged and artifacts and biases that did not in terfere with the original goals of the exp erimen t may do so no w. Across-platform comparison: Shewhart (1939), p. 112, already v alues the consistency b e- t ween different measurement metho ds higher than consistency in rep etition. F or microarrays, consistency betw een the measurements of tw o or more platforms (tw o-color cDNA, long oligon u- cleotide, short oligonucleotide (Affymetrix), commercial cDNA (Agilen t), and real-time PCR) on RNA from the same sample has been addressed in a num ber of publications. Some of the earlier studies show little or no agreement (e.g. Kuo et al. (2002), Rogo jina et al. (2003), Jarvinen et al. (2004), Zhu et al. (2005)), while others report mixed results (e.g. Y uen et al. (2002), Barczak et al. (2003), W oo et al. (2004)). More recent studies impro ved the agreemen t b et w een platforms by con trolling for other factors. Shipp y et al. (2004) and Y auk et al. (2004) restrict comparisons to subsets of genes ab o ve the noise level. Mec ham et al. (2004) use sequence-based matching of prob es instead of gene identifier-based matching. Irizarry et al. (2005), W ang et al. (2005) and Thompson et al. (2005) use superior preprocessing metho ds and systematically distinguish the lab effect from the platform effect; see Draghici et al. (2006) and Thompson et al. (2005) for detailed reviews and further references. F or Affymetrix arra ys, W o o et al. (2004), Dobbin et al. (2005) and Stev ens and Do erge (2005) found inter-laboratory differences to b e managable. How ev er, merging data from different generations of Affymetrix arrays is not as straightforw ard as one might exp ect (e.g. Nimgaonk ar et al. (2003), Morris et al. (2004), Mitchell et al. (2004), Hw ang et al. (2004), Kong et al. (2005)). 3.2 Assessment of microa rray data quality Qualit y assessment for microarray data can be studied on at least seven lev els: (1) the raw chip (pre-h ybridization) (2) the sample 12 (3) the exp erimen tal design (4) the mult i-step measurement pro cess (5) the ra w data (p ost-h ybridization) (6) the statistically prepro cessed microarray data (7) the microarray data as entries in a databank The last t wo items are the main fo cus of this pap er. The quality of the data after statistical pro cessing (whic h includes background adjustment, normalization and probeset summarization) is greatly affected, but not en tirely determined by the quality of the preceeding fiv e aspects. The raw microarra y data (5) are the result of a multi-step procedure. In the case of the ex- pression microarrays this includes con verting mRNA in the sample to cDNA, labelling the target mRNA via an in vitro transcription step, fragmen ting and then h ybridizing the resulting cRNA to the c hip, washing and staining, and finally scanning the resulting array . T emp erature dur- ing storage and h ybridization, the amoun t of sample and mixing during hubridization all hav e a substan tial impact on the qualit y of the outcome. Seen as a multi-step pro cess (4) the quality managemen t for microarray exp erimen ts has a lot in common with chemical engineering, where n umerous in terwo ven qualit y indicators hav e to be integrated (see e.g. Mason and Y oung (2002)). The designer of the experiment (3) aims to minimize the impact of additional exp erimen tal con- ditions (e.g. hybridization date) and to maximize accuracy and precision for the quan tities having the hightest priority , giv en the primary ob jectives of the study . Sample qualit y (2) is a topic in its o wn righ t, strongly tied to the organism and the institutional setting of the study . The question ho w sample qualit y is related to the microarray data has b een in v estigated in Jones et al. (2006) based on a v ariety of RNA quality measures and c hip qualit y measures including b oth Affymetrix scores and and ours. The chip b efore hybridization (1) is a manufactured item. The classical theory of qualit y control for industrial mass pro duction founded b y Shewhart (1939) pro vides the appropriate framew ork for the assessment of the chip qualit y before hybridization. The Affymetrix soft ware GCOS presents some chip-wide qualit y measures in the Expression Rep ort (R TP file). They can also b e computed b y the BioConductor R pack age simpleaffy describ ed in Wilson and Miller (2005). The do cumen t ”QC and Affymetrix data” contained in this pac k age discusses ho w these metrics can b e applied. The quan tities listed b elo w are the most commonly used ones from the Affymetrix rep ort (descriptions and guidelines from GCOS (2004) and Affymetrix (2001)). While some ranges for the v alues are suggested, the manuals mainly emphasize the importance of c onsistency of the measures within a set of jointly analyzed chips using similar samples and exp erimen tal conditions. The users are also encouraged to lo ok at the scores in conjuction with others scores. • Av erage Bac kground: Average of the low est 2% cell intensities on the c hip. Affymetrix do es not issue official guidelines, but men tions that v alues t ypically range from 20 to 100 for arra ys scanned with the GeneChip Scanner 3000. A high background indicates the presence of nonsp ecific binding of salts and cell debris to the array . • Ra w Q (Noise): Measure of the pixel-to-pixel v ariation of prob e cells on the c hip. The main factors contributing to Noise v alues are electrical noise of the scanner and sample qualit y . Older recommendations give a range of 1.5 to 3. Newer sources, ho wev er, do not issue official 13 guidelines because of the strong scanner dep endence. They recommend that data acquired from the same scanner b e chec k ed for comparabilit y of Noise v alues. • P ercen t Present: The p ercen tage of prob esets called Pr esent by the Affymetrix detection algorithm. This v alue dep ends on multiple factors including cell/tissue type, biological or en vironmental stim uli, prob e array type, and ov erall quality of RNA. Replicate samples should ha v e similar P ercent Presen t v alues. Extremely low Percen t Presen t v alues indicate p oor sample quality . A general rule of th umb is human and mouse chips t ypically hav e 30-40 P ercent Present, and y east and E. coli ha v e 70-90 P ercent Present. • Scale F actor: Multiplicative factor applied to the signal v alues to make the 2% trimmed mean of signal v alues for selected probe sets equal to a constan t. F or the HU133 c hips, the default constan t is 500. No general recommendation for an acceptable range is given, as the Scale F actors dep end on the constant chosen for the scaling normalization (dep ending on user and c hip type). • GAPDH 3’ to 5’ ratio (GAPDH 3’/5’): Ratio of the in tensity of the 3’ prob e set to the 5’ probe set for the gene GAPDH. It is exp ected to be an indicator of RNA qualit y . The v alue should not exceed 3 (for the 1-cycle assay). 4. METHODS: A MICROARRA Y QUALITY ASSESSMENT TOOLKIT P erfect Matc h (PM): The distribution of the (raw) PM v alues. While we do not think of this as a full quality assessment measure, it can indicate particular phenomena suc h as brightness or dimness of the image, or saturation. Using this tool in com bination with other qualit y measures, can help in detecting and excluding tec hnological reasons for p oor quality . A con v enient w ay to lo ok at the PM distributions for a num ber of chips is to use b o xplots. Alternatively , the data can b e summarized on the chip lev el by t w o single v alues: the median of the PM of all prob es on the chip, abbreviated Me d(PM), and the in terquartile range of the PM of all prob es on the chip, denoted b y IQR(PM). Our other assessment to ols use prob e lev el and prob eset level quantities obtained as a by- pro duct of the Robust Multichip Analysis (RMA) algorithm developed in Irizarry et al. (2003), Bolstad et al. (2004) and Gautier et al. (2004a). W e no w recall the basics ab out RMA and refer the reader to abov e pap ers for details. Consider a fixed probeset. Let y ij denote the intensit y of prob e j from this probeset on chip i, usually already bac kground corrected and normalized. RMA is based on the mo del log 2 y ij = µ i + α j + ε ij , (1) with α j a pr ob e affinity effe ct , µ i represen ting the log scale expression level for chip i, and ε ij an i.i.d. centered error with standard deviation σ . F or identifiabilit y of the mo del, we impose a zero-sum constraint on the α 0 j s. The num ber of prob es in the prob eset dep ends on the kind of chip (e.g. 11 for the HU133 c hip). F or a fixed prob eset, RMA robustly fits the mo del using iterativ ely w eighted least squares and delivers a probeset expression index ˆ µ i , for eac h chip. The analysis produces residuals r ij and weigh ts w ij attac hed to probe j on chip i. The weigh ts are used in the IRLS algorithm to achiev e robustness. Prob e intensities which are discordant with the rest of the prob es in the set are deemed less reliable and down w eigh ted. The collectiv e b eha viour of all the w eights (or all the residuals) on a c hip is our starting p oin t in developing 14 p ost-h ybridization c hip quality measures. W e b egin with a ”geographic” approac h – images of the c hips that highlight p oten tial p o orly p erforming prob es – and then contin ue with the discussion of n umerical quality assessment methods. Qualit y landscap es: An image of a hybridized chip can be constructed by shading the p osi- tions in a rectangular grid according to the magnitude of the p erfect match in the corresponding p osition on the actual chip. In the same wa y , the positions can be colored according to prob e-lev el quan tities other than the simple intensities. A typical color code is to use shades of red for p ositiv e residuals and shades of blue for negative ones, with dark er shades corresp onding to higher absolute v alues. Shades of green are used for the w eigh ts, with darker shades indicating low er w eigh ts. As the weigh ts are in a sense the reciprocals of the absolute residuals, the o v erall information gained from these tw o t yp es of quality landscap es is the same. In some particular cases, the sign of the residuals can help to detect patterns that otherwise would hav e been o v erlooked (see both fruit fly datasets in Sections 6 for examples). If no colors are a v ailable, gra y level images are used. This has no further implications for the w eight landscapes. F or the residual landscapes, note that red and blue shades are translated in to similar gray lev els, so the sign of the residuals is lost. P ositive and negativ e residuals can plotted on t wo separate images to av oid this problem. Normalized Unscaled Standard Error (NUSE): Fix a probeset. Let ˆ σ b e the estimated residual standard deviation in mo del (1) and W i = P j w ij the total pr ob e weight (of the fixed prob eset) in c hip i. The expression v alue estimate for the fixed prob eset on chip i, and its standard error are giv en by ˆ µ i = X j y ij · w ij W i and S E ( ˆ µ i ) = ˆ σ √ W i . (2) The residual standard deviations v ary across the prob esets within a chip. They provide an assessmen t of ov erall go odness of fit of the mo del to prob eset data for all chips used to fit the mo del, but provide no information on the relative precision of estimated expressions across chips. The latter, ho wev er, is our main in terest when we lo ok in to the qualit y of a c hips compared to other c hips in the same exp erimen t. Replacing the ˆ σ b y 1 gives what we call the Unsc ale d Standar d Err or (USE) of the expression estimate. Another source of heterogeneity is the num ber of “effective” prob es – in the sense of being giv en substan tial w eigh t b y the RMA fitting procedure. That this n umber v aries across probeset is ob vious when differen t num bers of prob es p er prob eset are used on the same chip. Another reason is dysfunctional prob es, that is, prob es with high v ariabiliy , lo w affinit y , or a tendency to crossh ybridize. T o comp ensate for this kind of heterogeneit y , w e divide the USE b y its median ov er all chips and call this Normalize d Unsc ale d Standar d Err or (NUSE). N U S E ( ˆ µ i ) = U S E ( ˆ µ i ) Median ι { U S E ( ˆ µ ι ) } = 1 √ W i Median ι 1 √ W ι . (3) An alternative in terpretation for the NUSE of a fixed prob eset b ecomes apparent after some arith- metic manipulations. F or any o dd num ber of p ositiv e observ ations a ι ( ι = 1 , ..., I ) , we hav e Median ι { 1 /a ι } = 1 / Median ι a ι , since the function x 7→ 1 /x ( x > 0) is monotone. F or an even n umber I , this iden tit y is it still approximativ ely true. (The reason for the slight inaccuracy is that, for an even num b er, the median is the a verage b et ween the tw o data p oin ts in the center p ositions.) Now we can rewrite N U S E ( ˆ µ i ) ≈ 1 √ W i 1 Median ι { √ W ι } = Median ι { √ W ι } √ W i = √ W i Median ι { √ W ι } − 1 . (4) 15 The total probe weigh t can also b e thought of as an effe ctive numb er of observations con tributing to the probeset summary for this chip. Its square root serves as the divisor in the standard error of the expression summaries (2), similarly to the role of √ n in the classical case of the av erage of n independent observ ations. This analogy supp oses, for heuristic purp oses, that the probes are indep enden t; in fact this is not true due to normalization, prob e ov erlap and other reasons. The median of the total prob e weigh t o ver all chips serv es as normalization constant. In the form (4), w e can think of the NUSE as the recipro cal of the normalized square ro ot of total prob e weigh t. The NUSE v alues fluctuate around 1. Chip quality statemen ts can b e made based on the distribution of all the NUSE v alues of one chip. As with the PM distributions, we can con venien tly lo ok at NUSE distributions as boxplots, or w e can summarize the information on the chip level by t wo single v alues: The median of the NUSE ov er all prob esets in a particular c hip, Me d(NUSE), and the in terquartile range of the NUSE o ver all prob esets in the c hip, IQR(NUSE). Relativ e Log Expression (RLE): W e first need a reference c hip. This is t ypically the me dian chip whic h is constructed prob eset by prob eset as the median expression v alue ov er all chips in the exp erimen t. (A computationally constructed reference c hips such as this one is sometimes called ”virtual c hip”.) T o compute the RLE for a fixed probeset, take the difference of its log expression on the chip to its log expression on the reference chip. Note that the RLE is not tied to RMA, but can b e computed from any expression v alue summary . The RLE measures how muc h the measuremen t of the expression of a particular prob eset in a c hip deviates from measurements of the same prob eset in other chips of the experiment. Again, we can conv enien tly lo ok at the distributions as b o xplots, or w e can summarize the information on the chip lev el by t w o single v alues: The median of the RLE ov er all prob esets in a particular chip , Me d(RLE), and the in terquartile range of the RLE ov er all prob esets in the chip, IQR(RLE). The latter is a measure of deviation of the c hip from the median chip. A priori this includes b oth biological and technical v ariability . In exp erimen ts where it can be assumed that the ma jority of genes are not biologically effected, (5) IQR(RLE) is a measure of tec hnical v ariability in that c hip. Even if biological v ariabilit y is presen t for most genes, IQR(RLE) is still a sensitiv e detector of sources of tec hnical v ariabilit y that are larger than biological v ariabilit y . Med(RLE) is a measure of bias. In man y experiments there are reasons to b eliev e that n um b er of up regulated genes ≈ num ber of down regulated genes. (6) In that case, an y deviation of Med(RLE) from 0 is an indicator of a bias caused by the technology . The interpretation of the RLE depends on the assumptions ((5) and (6)) on the biological v ariabilit y in the dataset, but it pro vides a measure that is constructed indep endently of the quality landscap es and the NUSE. F or quality assessment, we summarize and visualize the NUSE, RLE, and PM distributions. W e found series of b o xplots to b e very a conv enien t wa y to glance ov er sets up to 100 chips. Outlier chips as well as trends ov er time or pattern related to time can easily b e sp otted. F or the detection of systematic quality differences related to circumstances of the exp erimen t, or to prop erties of the sample it is helpful to color the b o xes accordingly . Typical coloring w ould b e according to groups of the exp erimen t, sample cohort, lab site, hybridization date, time of the day , a prop ert y of the sample (e.g. time in freezer). T o quickly review the quality of larger sets of c hips, shorter summaries such as the abov e mentioned median or the in terquartile range of PM, NUSE 16 and RLE. These single-v alue summaries at the chip level are also useful for comparing our qualit y measures to other chip quality scores in scatter plots, or for plotting our quality measures against con tinuous parameters related to the exp erimen t or the sample. Again, additional use of colors can dra w attention to any systematic qualit y c hanges due to tec hnical conditions. While the RLE is a form of absolute measure of quality , the NUSE is not. The NUSE has no units. It is designed to detect differences b etwe en chips within a b atch. Ho w ever, the magnitudes of these differences ha v e no interpretation b ey ond the batch of c hips analyzed together. W e no w describ e a w a y to attach a qualit y assessment to a set of chips as a whole. It is based on a common residual factor for a batch of join tly analyzed chips, RMA estimates a common residual scale factor. It enables us to compare quality b et w een different exp erimen ts, or b et w een subgroups of c hips in one exp erimen t. It has no meaning for single c hips. Residual scale factor (RSF): This is a qualit y measure for batches of chips. It do es not apply to individual c hips, but assesses the qualit y of batches of chips. The batc hes can b e a series of exp erimen ts or subgroups of one exp erimen t (defined, e.g. by cohort, exp erimen tal conditions, sample properties, or diagnostic groups). T o compute the RSF, assume the data are background corrected. As the background correction w orks on a chip b y chip basis it does not matter if the computations were done sim ultaneously for all batches of ch ips or individually . F or the normal- ization, how ever, we need to find one target distribution to which w e normalize all the c hips in all the batc hes. This is imp ortan t, since the target distribution determines the scale of intensit y measures b eing analyzed. W e then fit the RMA model to each batc h separately . The algorithm deliv ers, for eac h batc h, a v ector of the estimated R esidual Sc ales for all the probesets. W e can now b o xplot them to compare qualit y b et ween batc hes of c hips. The median of each is called R esidual Sc ale F actor (RSF). A v ector of residual scales is a heterogeneous set. T o remo v e the heterogene- it y , w e can divide it, prob eset b y probeset, by the median ov er the estimated scales from all the batc hes. This leads to alternative definitions of the quantities ab o ve, whic h we call Normalize d R esidual Sc ales and Normalize d R esidual Sc ale F actor (NRSF). The normalization leads to more discrimination b et ween the batc hes, but has the dra wbac k of having no units. Soft ware for the computation and visualization of the quality measures and the interpretation of the statistical plots is discussed in Bolstad et al. (2005). The co de is publicly av ailable from www.bioconductor.org in the R pack age affyPLM . Note that the implemen tation of the NUSE in affyPLM differs slightly from the ab o v e formula. It is based on the ”true” standard error as it is comes from M-estimation theory instead of the total w eights expression in 3. How ev er, the difference is small enough not to matter for an y of the applications the NUSE has in chip quality assessmen t. 5. D A T ASETS Affymetrix HU95 spik e-in exp erimen ts: Here 14 h uman cRNA fragments corresp ond- ing to transcripts known to b e absent from RNA extracted from pancreas tissue were spiked in to aliquots of the hybridization mix at different concentrations, which we call chip-patterns. The patterns of concentrations from the spik e-in cRNA fragmen ts across the chips form a Latin Square. The chip-patterns are denoted by A, B,...,S and T, with A,...,L o ccurring just once, and M and Q b eing rep eated 4 times each. Chip patterns N, O and P are the same as that of M, while patterns R, S, and T are the same as Q. Each chip-pattern was hybridized to 3 chips selected from 3 different lots referred to as the L1521, the L1532, and the L2353 series. See 17 www.affymetrix.com/support/technical/sample.data/datasets.affx for further details and data download. F or this pap er, we are using the data from the 24 chips generated by chip patterns M, N, O, P , Q, R, S, T with 3 replicates each. St. Jude Children’s Research Hospital leukemia data collection: The study b y Y eoh et al. (2002) was conducted to determine whether gene expression profiling could enhance risk assignmen t for p ediatric acute lymphoblastic leukemia (ALL). The risk of relapse pla ys a central role in tailoring therap y intensit y . A total of 389 samples were analyzed for the study , from whic h high quality gene expression data w ere obtained on 360 samples. Distinct expression profiles iden tified eac h of the prognostically important leukemia subtypes, including T-ALL, E2A-PBX1, BCR-ABL, TEL-AML1, MLL rearrangement, and hyperdiploid > 50 chromosomes. In addition, another ALL subgroup was identified based on its unique expression profile. Ross et al. (2003) re-analized 132 cases of p ediatric ALL from the original 327 diagnostic b one marrow aspirates using the higher densit y U133A and B arrays. The selection of cases w as based on having sufficien t n umbers of eac h subtype to build accurate class predictions, rather than reflecting the actual frequency of these groups in the p ediatric population. The follow-up study iden tified additional mark er genes for subtype discrimination, and improv ed the diagnostic accuracy . The data of these studies are publicly a v ailable as supplementary data. F ruit fly m utan t pilot study: Gene expression of nine fruit fly mutan ts w ere screened using Affymetrix DrosGenome1 arra ys. The m utan ts are c haracterized b y v arious forms of dysfunction- alit y in their synapses. RNA w as extracted from fly em bry os, p o oled and lab elled. Three to four replicates p er m utan t were done. Hybridization to ok place on six different da ys. In most cases, tec hnical replicates were hybridized on the same day . The data were collected by Tiago Magalh˜ aes in the Go odman Lab at the Universit y of California, Berkeley , to gain exp erience with the new microarra y technology . F ruit fly time series: A large population of wild type (Canton-S) fruit flies was split into t welv e cages and allow ed to la y eggs which w ere transferred into an incubator and aged for 30 min- utes. F rom that time on wards, at the end of each hour for the next 12 hours, em bryos from one plate w ere w ashed on the plate, dec horionated and frozen in liquid nitrogen. Three independent repli- cates were done for eac h time p oin t. As eac h embry o sample con tained a distribution of different ages, we examined the distribution of morphological stage-sp ecific markers in each sample to cor- relate the time-course windows with the nonlinear scale of em bry onic stages. RNA w as extracted, p ooled, lab eled and h ybridized to Affymetrix DrosGenome1 arra ys. Hybridization to ok place on t wo differen t days. This dataset was collected by P av el T oman˘ c´ ak in the Rubin Lab at the Univer- sit y of California, Berk eley , as a part of their comprehensive study on spatial and temporal patterns of gene expression in fruit fly dev elopment T oman˘ c´ ak et al. (2002). The ra w microarray data (.CEL files) are publically av ailable at the pro ject’s website www.fruitfly.org/cgi-bin/ex/insitu.pl . Pritzk er data collection: The Pritzk er neuropsyc hiatric researc h consortium uses brains obtained at autopsy from the Orange Country Coroner’s Office through the Brain Donor Program at the Univ ersit y of California, Irvine, Department of Psyc hiatry . RNA samples are tak en from the left sides of the brains. Lab eling of total RNA, chip hybridization, and scanning of oligonucleotide microarra ys are carried out at indep enden t sites (Universit y of California, Irvine; Universit y of California, Da vis; Univ ersity of Michigan, Ann Arb or). Hybridizations are done on HU95 and later generations of Affymetrix c hips. In this paper, w e are looking at the qualit y of data used in t wo studies by the Pritzker consortium. The Gender study by V a wter et al. (2004) is motiv ated by gender difference in prev alence for some neuropsychiatric disorders. The raw dataset has HU95 chip 18 data on 13 sub jects in three regions (anterior cingulate cortex, dorsolateral prefron tal cortex, and cortex of the cerebellar hemisphere). The Mo o d disor der study described in Bunney et al. (2003) is based on a growing collection of gene expression measurements in, ultimately , 25 regions. Each sample w as prepared and then split so that it could b e h ybridized to the chips in both Mic higan and either Irvine or Da vis. 6. RESUL TS W e start b y illustrating our quality assessment metho ds on the w ell kno wn Affymetrix spike- in exp erimen ts. The quality of these c hips is w ell ab o ve what can b e exp ected from an a verage lab exp eriment. W e then pro ceed with data collected in scientific studies from v ariety of tissue t yp es and exp erimen tal designs. Different aspects of quality analysis metho ds will b e highlighted throughout this section. Our quality analysis results will b e compared with the Affymetrix quality rep ort for several sections of the large publicly av ailable St. Jude Children’s Research Hospital gene expression data collection. (A) Outlier in the Affymetrix spik e-in experiments: 24 HU 95A chips from the Affymetrix spik e-in dataset. All but the spike-in prob esets are exp ected to b e non-differentially expressed across the arrays. As there are only 14 spike-ins out of ab out tw en t y thousand prob esets, they are, from the qualit y assessmen t point of view, essen tially 24 identical hybridizations. A glance at the w eigh t (or residual) landscap es giv es a picture of homogenous h ybridizations with almos t no lo cal defects on any chip but #20 (Fig. A1). The NUSE indicates that c hip #20 is an outlier. Its median is w ell abov e 1.10, while all others are smaller than 1.05, and its IQR is three and more times bigger than it is for an y other chip (Fig. A2). The series of b o xplots of the RLE distributions confirms these findings. The median is well below 0 , and the IQR is tw o and more times bigger than it is for any other chip. Chip #20 has b oth a technologically caused bias and a higher noise lev el. The Affymetrix qualit y rep ort (Fig. A3), how ev er, do es not clearly classify #20 as an outlier. Its GAPDH 3’/5’ of about 2.8 is the largest within this c hip set, but the v alue 2.8 is considered to b e acceptable. According to all other Affymetrix quality measures – Percen t Present, Noise, Bac kground Av erage, Scale F actor – chip #20 is within a group of lo wer qualit y c hips, but does not stand out. (B) Outlier in St. Jude’s data not detected by the Affymetrix quality rep ort: The collection of MLL HU133B chips consists of 20 c hips one of which turns out to be an outlier. The NUSE boxplots (Fig. B1, bottom line) show a median ov er 1.2 for c hip #15 while all others are b elo w 1.025. The IQR is muc h larger for chip #15 than it is for any other chip. The RLE b o xplots (Fig. B1, top line) as w ell distinguish chip #15 as an ob vious outlier. The median is about − 0 . 2 for the outlier chip, while it is v ery close to 0 for all other c hips. The IQR is ab out twice as big as the largest of the IQR of the other chips. Fig. B1 displays the w eight landscapes of chip#15 along with those of t w o of the typical chips. A region on the left side of c hip #15, co v ering almost a third of the total area, is strongly down weigh ted, and the chip has elev ated weigh ts ov erall. Affymetrix quality rep ort (Fig. B3) paints a very different picture – Chip #15 is an outlier on the Med(NUSE) scale, but does not stand out on any of common Affymetrix quality assessment measures: Percen t Present, Noise, Scale F actor, and GAPDH 3’/5’. (C) Ov erall comparison of our measures and the Affymetrix quality rep ort for a large n um ber of St. Jude’s c hips: Fig. D1 pairs the Med(NUSE) with the four most common GCOS scores on a set of 129 HU133A c hips from the St. Jude dataset. There is noticable linear 19 asso ciation betw een Med(NUSE) and Percen t Presen t, as w ell as betw een Med(NUSE) and Scale F actor. GAPDH 3’/5’ do es not show a linear association with any the other scores. (D) Disagreement b et w een our quality measures and the Affymetrix quality rep ort for Hyperdip > 50 subgroup in St. Jude’s data: The Affymetrix qualit y report detects prob- lems with many chips in this dataset. F or chip A, Raw Q (Noise) is out of the recommended range for the ma jority of the chips: #12, #14, C1, C13, C15, C16, C18, C21, C22, C23, C8 and R4. Bac kground detects chip #12 as an outlier. Scale F actor do es not show any clear outliers. Percen t Presen t is within the t ypical range for all c hips. GAPDH 3’/5’ is below 3 for all c hips. F or chip B, Ra w Q (Noise) is out of the recommended range for the #12, #8, #18 and R4. Bac kground detects c hip #12 and #8 as outliers. Scale F actor do es not sho w any clear outliers. Percen t Present never exceeds 23% in this chip set, and it is b elo w the t ypical minim um of 20% for chips #8, C15, C16, C18, C21 and C4. GAPDH 3’/5’ is satisfactory for all chips. Our measures suggest that, with one exception, the c hips are of go od qualit y (Fig. D1). The heterogeneit y of the p erfect matc h distributions do es not persist after the preprocessing. F or c hip A, #12 has the largest IQR(RLE) and is a clear outlier among the NUSE distributions. Two other chips ha ve elev ated IQR(RLE), but do not stand out according to NUSE. F or c hip B, the RLE distributions are very similar with #12 again ha ving the largest IQR(RLE). The NUSE distributions are consisten tly showing go od quality with the exception of c hip #12. (E) V arying qualit y b et ween diagnostic subgroups in the St. Jude’s data: Each b o x- plot in Fig. E1 sketc hes the Residual Scale F actors (RSF) of the c hips of all diagnostic subgroups. They sho w substan tial qualit y differences. The E2A PBX1 subgroup has a m uch higher Med(RSF) than the other subgroups. The T ALL subgroup has a sligh tly elev ated Med(RSF) and a higher IQR(RSF) than the other subgroups. (F) Hybridization date effects on qualit y of fruit fly chips: The fruit fly m utant with dysfunctional synapses is an experiment of the earlier stages of working with Affymetrix chips in this lab. It shows a wide range of quality . In the b o xplot series of RLE and NUSE (Fig. F1) a dep endency of the h ybridization date is striking. The chips of the t w o m utan ts hybridized on the da y colored yello w sho w substantially low er quality than an y of the other c hips. Fig. F2 shows a w eight landscape revealing smooth mountains and v alleys. While the pattern is particularly strong in the chip chosen for this picture, it is quite typical for the c hips in this dataset. W e are not sure ab out the specific technical reason for this, but assume it is related to insufficien t mixing during the h ybridization. (G) T emp oral trends or biological v ariation in fruit fly time series: The series consists of 12 developmen tal stages of fruit fly embry os hybridized in 3 tec hnical replicates each. While the log 2 (PM) distributions are v ery similar in all chips, w e can sp ot tw o kinds of systematic patterns in the RLE and NUSE b o xplots (Fig. G1). One pattern is connected to the dev elopmental stage. Within each single one of the three repeat time series, the hybridizations in the middle stages lo ok ”b etter” than the ones in the early stages and the c hips in the late stages. This may , at least to some exten t, b e due to biological rather than tec hnological v ariation. In embry o developmen t, esp ecially in the beginning and at the end, huge num b ers of genes are expected to b e affected, whic h is a p otential violation of assumption (5). Insufficient staging in the first v ery short developmen tal stages may further increase the v ariabilit y . Also, in the early and late stages of developmen t, there is substan tial doubt ab out the symmetry assumption (6). Another systematic trend in this dataset is connected to the rep eat series. The second dozen chips are of p oorer qualit y than the others. In fact, w e learned that they were hybridized on a differen t da y from the rest. 20 The pairplot in Fig. G2 lo oks at the relationship b et ween our chip quality measures. There is no linear association b et w een the ra w in tensities – summarized as Med(PM) – and an y of the qualit y measures. A weak linear association can b e noted b et w een Med(RLE) and IQR(RLE). It is w orth to note that is becomes m uch stronger when focusing on just the c hips h ybridized on the day colored in black. IQR(RLE) and Med(NUSE) again hav e a w eak linear association whic h b ecomes stronger when lo oking only at one of the subgroups, except this time it is the chips colored in gray . F or the pairing Med(RLE) and Med(NUSE), ho wev er, there is no linear relationship. Finally (not sho wn), as in the dysfunctional synapses m utan t fruit fly dataset, a double-w a v e gradien t, as seen in Fig. F2 for the other fruit fly dataset, can b e observed in the qualit y landscap es of many of the c hips. Although these exp erimen ts w ere conducted b y a differen t team of researc hers, they used the same equipmen t as that used in generating the other fruit fly dataset. (H) Lab differences in Pritzker’s gender study: W e lo ok ed at HU95 c hip data from 13 individuals in tw o brain regions, the cortex of the cereb ellar hemisphere (short: cereb ellum) and the dorsolateral prefrontal cortex. With some exceptions, each sample is hybridized in b oth lab M and lab I. The NUSE and RLE b o xplots (Fig. H1) for the cereb ellum dataset display an eye- catc hing pattern: They show systematically muc h b etter quality in Lab M then in Lab I. This migh t b e caused b y ov erexposure or saturation effects in Lab I. The medians of the ra w intensities (PM) v alues in Lab I are, on a l og 2 -scale betw een about 9 and 10.5, while they are v ery consisten tly ab out 2 tw o 3 points low er in Lab M. The dorsolateral prefron tal cortex h ybridizations show, for the most part, a lab effect similar to the one we sa w in the cereb ellum c hips (plots not shown here). (I) Lab differences in Pritzk er’s mo od disorder study: After the exp eriences with lab differences in the gender study , the consortium wen t through extended efforts to minimize these problems. In particular, the machines were calibrated by Affymetrix sp ecialists. Fig. I1 summarizes the quality assessmen ts of three of the Pritzker mo od disorder datasets. W e are looking at HU95 c hips from tw o sample cohorts (a total of about 40 sub jects) in each of the brain regions an terior cingulate cortex, cerebellum, and dorsolateral prefron tal cortex. In terms of Med(PM), for eac h of the three brain regions, the tw o replicates came closer to each other: the difference betw een the t wo labs in the mo od disorder study is a third or less of the difference b et w een the t w o labs in the gender study (see first t w o b o xes in each of the three parts of Fig. I1, and compare with Fig. H1). This is due to lab I dropping in in tensit y (tow ard lab M) and the new lab D also op erating at that lev el. The consequence of the intensit y adjustmen ts for c hip qualit y do not form a coheren t story . While for cereb ellum the quality in lab M is still b etter than in the replicate in one of the other labs, for the other tw o brain regions the ranking is rev ersed. Effects of a sligh t underexp osure in lab M ma y no w ha ve b ecome more visible. Generally , in all brain regions, the quality differences b et ween the tw o labs are still there, but they are muc h smaller than they in the gender study data. (J) Assigning sp ecial causes of p oor quality for St. Jude’s data: Eigh t qualit y land- scap es from the early St. Jude’s data, a collection of 335 HU133Av2 chips. The examples w ere pic ked for b eing particularly strong cases of certain kinds of shortcomings that repeatedly o ccur in this chip collection. They do not represent the general quality level in the early St. Jude’s chips, and even less so the qualit y of later St. Jude’s chips. The figures in this paper are in gra y levels. If the p ositiv e residual landscap e is shown, the negativ e residual landscape is typically some sort of complemen tary image, and vice versa. Colored quality landscapes for all St. Jude’s chips can b e downloaded from Bolstad’s Chip Gal lery at www.plmimagegallery.bmbolstad.com . Fig. J1 ”Bubbles” is the p ositiv e residual landscap e of c hip Hyperdip-50-02. There are small dots in the left upp er part of the slide, and tw o bigger ones in the middle of the slide. W e attribute 21 the dots to dust attac hed to the slide or air bubbles stuck in this place during the hybridization. F urther, there is an accumulation of p ositiv e residuals in the b ottom right corner. Areas of elev ated residuals near the corners and edges of the slide are v ery common, often muc h larger than in this c hip. Mostly they are positive. The most lik ely explanation are air bubbles that, due to insufficien t mixing during the hybridization, got stuck close to the edges where they had gotten when this edges w as in a higher p osition to start with or brough t up there by the rotation. Note that there typically is some air in the solution injected into the chip (through a little hole near one of the edges), but that the air is mov ed around by the rotation during the h ybridization to minimize the effects on the prob e measurements. Fig. J2 ”Circle and stic k” is the residual landscape of Hyperdip47-50-C17. This demonstrates t wo kinds of spatial patterns that are probably caused b y indep enden t technical shortcomings. First, a circle with equally spaced dark er sp ots (approximately). The symmetry of the shap e suggests it was caused by a foreign ob ject scratching tra jectories of the rotation during the h y- bridization into the slide. Second, there are little dots that almost seem to b e aligned along a straigh t line connecting the circle to the upp er right corner. The dots migh t b e air bubbles stuck to some in visible thin straight ob ject or scratch. Fig. J3 ”Sunset” is the negative residual landscap e of Hyp erdip-50-C6. This chip illustrates t wo indep enden t tec hnical deficiencies. First, there is a dark disk in the cen ter of the slide. It migh t be caused by insufficien t mixing, but the sharpness with whic h the disk is separated from the rest of the image asks for additional explanations. Second, the image ob viously splits in to an upp er and a low er rectangular part with differen t residual, separated b y a straigh t b order. As a most lik ely explanation, we attribute this to scanner problems. Fig. J4 ”Pond” is the negative residual landscap e of TEL-AML1-2M03. The nearly centered disc co vers almost the en tire slide. It migh t be caused by the same mec hanisms that w ere resp onsible for the smaller disc in the previous figure. How ev er, in this data collection, w e hav e only seen t wo sizes of discs – the small disk as in the previous figure and the large one as in this figure. This raises the question wh y the mechanism that causes them do es not produce medium size discs. Fig. J5 ”Letter S” is the positive residual landscape of Hyp odip-2M03. The striking pattern – the letter ’S’ with the ”cloud” on top – is a particularly curious example of a common technical shortcoming. W e attribute the spatially heterogeneous distribution of the residuals to insufficien t mixing of the solution during the h ybridization. Fig. J6 ”Compartments” is the p ositiv e residual landscap e of Hyp erdip-50-2M02. This is a unique c hip. One explanation would b e that the v ertical curv es separating the three compartmen ts of this image are long thin foreign ob jects (e.g. hair) that got onto the c hip and blo c k ed or inhabited the liquid from b eing spread equally ov er the en tire c hip. Fig. J7 ”T riangle” is the positive residual landscap e of TEL-AML1-06. The triangle migh t b e caused by a long foreign ob ject stuck to the center of the slide on one end and free, and hence manipulated b y the rotation, on the other end. Fig. J8 ”Fingerprin t” is the positive residual landscap e of Hyp erdip-50-C10. What looks lik e a fingerprint on the picture migh t actually b e one. With the slide measuring 1cm by 1cm, the pattern has ab out the size of a human fingerprin t or the middle part of it. 22 7. DISCUSSION Qualit y landscap es: The pair of the p ositiv e and negative residual landscapes con tains the maxim um information. Often, one of the tw o residual landscap es can already characterize most of the spatial qualit y issues. In the w eigh t pictures, the magnitude of the deriv ation is preserved, but the sign is lost. Therefore, unrelated lo cal defects can app ear indistinguishable in weigh t landscap es. The landscap es allo w a first glance at the ov erall quality of the arra y: A square filled with lo w-level noise t ypically comes from a go o d qualit y chip, one filled with high-level noise comes from a chip with uniformly bad prob es. If the landscap e is reveals an y spatial patterns, the quality ma y or ma y not be compromised dep ending on the size of the problematic area. Even a couple of strong lo cal defects may not lo w er the c hip qualit y , as indicated by our measures. The reason lies in b oth the chip design and the RMA mo del. The prob es belonging to one prob eset are scattered around the c hip assuring that a bubble or little scratch w ould only affect a small num b er of the prob es in a probeset; even a larger under- or o verexposed area of the c hip may affect only a minority of prob es in eac h prob eset. As the RMA mo del is fitted robustly , its expression summaries are shielded against this kind of disturbance. W e found the qualit y landscape most useful in assigning sp ecial causes of po or c hip quality . A qualit y landscap e composed of smo oth moun tains and v alleys is most likely caused b y insufficien t mixing during the h ybridization. Smaller and sharp er cut-out areas of elev ated residuals are t ypically related to foreign ob jects (dust, hair, etc.) or air bubbles. Symmetries can indicate that scratc hing w as caused b y particles b eing rotated during hybridization. Patterns inv olving horizon tal lines may b e caused by scanner miscalibration. It has to b e noted, that the ab o v e assignmen t of causes are educated guesses rather than facts. They are the result of extensive discussions with experimentalist, but there remains a sp eculativ e component to them. Even more h yp othetical are some ideas we ha ve regarding ho w the sign of the residual could reveal more about the special cause. All w e can sa y at this point is that the bac kground corrected and normalized prob e in tensit y deviate from what the fitted RMA mo del would expect them to b e. The fo cus in this pap er is a global one: chip quality . Several authors hav e work ed on spatial chip images from a differen t p erspective, that of automatically detecting and describing lo cal defects (see Reimers and W einstein (2005), or the R-pack age Harshlight b y Su´ arez-F ari ˜ nas et al. (2005)). It remains an op en question how to use this kind of assessment b ey ond the detection and classification of qualit y problems. In our approac h, if we do not see an y indication of quality landscpap e features in another quality indicator such as NUSE or RLE, we supp ose that it has b een rendered harmless b y our robust analysis. This may not b e true. RLE: Despite its simplicity the RLE distribution turns out to b e a p o werful qualit y tool. F or a small num b er of chips, b o xplots of the RLE distributions of each chip allow the detection of outliers and temporal trends. The use of colors or gra y levels for differen t exp erimen tal conditions or sample prop erties facilitates the detection of more complex patterns. F or a large num b er of c hips, the IQR(RLE) is a conv enien t and informative univ ariate summary . Med(RLE) should be monitored as w ell to detect bias. As seen in the Drosophila em bryo data, these assumptions are crucial to ensuring that what the RLE suggests really are tec hnical artifacts rather than biological differences. Note that the RLE is not tied to the RMA mo del, but could as w ell be computed based on expression v alues derived from other algorithms. The results ma y differ, but our exp erience is that the qualit y message turns out to b e similar. NUSE: As in the case of the RLE, b o xplots of NUSE distributions can be used for small chip 23 sets, and plots of their median and interquartile ranges serve as a less space consuming alternativ e for larger chip sets. F or the NUSE, how ev er, w e often observe a very high correlation b et w een median and interquartile range, so k eeping trac k of just the median will t ypically suffice. Again, colors or gra y lev els can b e used to indicate exp erimen tal conditions facilitating the detection their p oten tial input on quality . The NUSE is the most sensitive of our quality to ols, and it do es not hav e a scale. Observ ed quality differences, even systematic ones, hav e therefore to carefully assessed. Ev en large relative differences do not necessarily compromise an experiment, or render useless batches of chips within an exp erimen t. They should alwa ys alert the user to substantial heterogeneit y , whose cause needs to b e inv estigated. On this matter we rep eat an ob vious but imp ortan t principle we apply . When there is uncertaint y about whether or not to include a chip or set of chips in an analysis, we can do b oth analyses and compare the results. If no great differences result, then stic king with the larger set seems justifiable. Ra w in tensities and qualit y measures: Raw in tensities are not useful for qualit y prediction b y itself, but they can provide some explanation for the p o or performance according to the other qualit y measures. All the Pritzker datasets, for example, suffer from systematic differences in the lo cation of the PM in tensit y distribution (indicated b y Med(PM)). Sometimes the lo wer lo cation w as w orse – to o close to underexp osure – and sometimes the higher was w orse – to o close to o verexposure or saturation. W e ha v e seen examples of c hips for which the raw data giv e misleading qualit y assessment. Some kinds of tec hnological shortcomings can b e remo v ed without trace b y the statististical pro cessing, while others remain. Comparison with Affymetrix qualit y scores: W e found go od ov erall agreement b et ween our quality assessment and tw o of the Affymetrix scores: Percen t Present and Scale F actor. Pro- vided the quality in a c hips set co vers a wide enough range, we typically see at least a w eak linear asso ciation betw een our quality measures and these t wo, and sometimes other Affymetrix qualit y scores. How ev er, our qualit y assessment do es not alw a ys agree with the Affymetrix qualit y rep ort. In the St. Jude data collection we saw that the sensitivity of the Affymetrix quality rep ort could b e insufficien t. While our quality assessment based on RLE and NUSE clearly detected the outlier c hip in the MLL c hip B dataset, none of the measures in the Affymetrix quality did. The reverse situation o ccured in the Hyp erdip c hip A dataset. While most of the chips passed according to our qualit y measures, most of the chips got a p oor Affymetrix quality scores. RSF: The Residual Scale F actor can detect quality differences betw een parts of a data collec- tion, such as the diagnostic subgroups in the St. Jude’s data. In the same w a y , it can be emplo y ed to inv estigate quality differences betw een other dataset divisions defined by sample properties, lab site, scanner, h ybridization day , or an y other exp erimental condition. More exp erience as to what magnitudes of differences are acceptable is still needed. 8. CONCLUSIONS AND FUTURE W ORK In this pap er, we hav e laid out a conceptual framework for a statistical approach for the assessmen t and con trol of microarray data quality . In particular, we hav e introduced a quality assessmen t to olkit for short oligon ucleotide arra ys. The to ols highligh t different asp ects in the wide spectrum of p oten tial quality problems. Our n umerical qualit y measures, the NUSE and the RLE, are an efficient w a y to detect chips of unusually p oor quality . F urthermore, they p ermit the detection of temporal trends and patterns, batch effects, and quality biases related to sample prop erties or to exp erimen tal conditions. Our spatial quality metho ds, the weigh t and residual 24 landscap es, add to the understanding of sp ecific causes of p oor quality by marking those regions on the c hip where defects o ccur. F urthermore, they illustrate the robustness of the RMA algorithm to small local defects. The RSF quan tifies qualit y differences b et w een batc hes of chips. It provides a broader framew ork for the qualit y scores of the individual chips in an exp erimen t. All the qualit y measures prop osed in this pap er can b e computed based on the ra w data using publicly a v ailable soft ware. Deriving the quality assessmen t directly from the statistical mo del used to compute the ex- pression v alues is more p o w erful than basing it on the performance of a particular set of of control prob es, b ecause the control prob es ma y not b eha v e in a w a y that is representativ e for the whole set of prob es on the array . The mo del-based approac h is also preferable to metrics less directly related to the bulk of the expression v alues. Some of the Affymetrix metrics, for example, are deriv ed from the raw prob e v alues and in terpret any artifacts as quality problems, ev en if they are remo ved by routine prepro cessing steps. A lesson from the practical examples in this paper is the imp ortance of a w ell designed experiment. One of the most t ypical sources for bias, for example, is an unfortunate systematic connection b et ween h ybridization date and groups of the study – a link that could ha ve b een a v oided by b etter planning. More research needs to b e done on the attribution of specific causes to po or quality measure- men ts. While our quality measures, and, most of all, our qualit y landscapes, are a ric h source for finding specific causes of po or qualit y , a sp eculativ e comp onen t remains. T o increase the credibilit y of the diagnoses, systematic quality exp erimen ts need to b e conducted. A big step forw ard is Bol- stad’s Chip Gal lery at www.plmimagegallery.bmbolstad.com, whic h collects quality landscap es from Affymetrix chip collections, pro vides details ab out the experiment and sometimes offers ex- planations for the tec hnical causes of po or qualit y . Started as a collection of c hip curiosities this w ebsite is now growing into a visual encyclop edia for qualit y assessment. Contributions to the collection, in particular those with known causes of defects, are invited (anonymous if preferred). F urther metho dological research is needed to explore the use of the spatial qualit y for statistically ”repairing” lo cal defects, or making partial use of lo cally damaged c hips. W e are well aw are that the range of acceptable v alues for each quality scores is the burning question for exp erimen talists. Our quality analysis results with microarray datasets from a v ariet y of scientific studies in Section 6 show that the question ab out the righ t threshold for go od chip qualit y does not ha v e a simple answer yet, at least not as the present lev el of generalit y . Thresholds computed for gene expression measuremen ts in fruit fly m utant screenings can not necessarily be transferred to brain disease research or to leuk emia diagnosis. Thresholds need to b e calibrated to the tissue type, the design, and the precision needs of the field of application. W e offer t wo strategies to deal with this on differen t levels: 1. Individual researchers: W e encouraged researchers to lo ok for outliers and artificial pat- terns in the series of qualit y measures of the batch of join tly analyzed c hips. F urthermore, an y other form of unusual observ ations – e.g. a systematic disagreemen t betw een NUSE and RLE, or inconsistencies in the asso ciation b et w een raw intensities and quality measures – p oten tially hints at a qualit y problem in the experiment. 2. Comm unit y of microarray users: W e recommend the developmen t of qualit y guidelines. They should b e ro oted in extended collections of datasets from scien tific experiments. Com- plete raw datasets are ideal, where no prior quality screening has b een employ ed. Careful do cumen tation of the experimental conditions and prop erties help to link un usual patterns in 25 the qualit y measures to sp ecific causes. The sharing of unfiltered ra w c hip data from scien tific exp erimen ts on the w eb and the inclusion of c hip qualit y scores in gene expression databank en tries can lead the wa y tow ards comm unit y-wide quality standards. Besides, it con tributes to a b etter understanding ho w qualit y measures relate to special causes of p oor qualit y . In addition, w e encourage the conduction of designe d micr o arr ay quality exp eriments. Suc h ex- p erimen ts aim at an understanding of the effects of RNA amoun t, experimental conditions, sample properties and sample handling on the qualit y measures as w ell as on the do wnstream analysis. They give an idea of the range of chip quality to be exp ected under giv en certain exp erimen tal, and, again, they help to characterize specific causes of p o or quality . Benc hmarking of microarray data qualit y will happ en one w a y or another; if it is not established b y comm unit y-wide agreemen ts the individual experimentalist will resort to judging on the basis of anecdotal evidence. W e recommend that benchmarks be activ ely developed by the communit y of microarra y researchers, exp erimen talists and data analysts. The statistical concepts and methods prop osed here may serv e as a foundation for the qualit y b enc hmarking pro cess. 9. A CKNO WLEDGEMENT W e thank St. Jude Children’s Researc h Hospital, the Pritzk er Consortium, Tiago Magalh˜ aes, P av el T oman˘ c´ ak and Affymetrix for sharing their data for quality assessment purposes. References Affymetrix (2001), Guidelines for assessing data quality , Affymetrix Inc, San ta Clara, CA. Alizadeh, A. A., Eisen, M. B., Davis, R. E., Ma, C., Lossos, I. S., Rosenw ald, A., Boldrick, J. C., Sab et, H., T ran, T., Y u, X., Po well, J. I., Y ang, L., Marti, G. E., Mo ore, T., Hudson, J., Lu, L., Lewis, D. B., Tibshirani, R., Sherlo c k, G., Chan, W. C., Greiner, T. C., W eisenburger, D. D., Armitage, J. O., W arnke, R., Levy , R., Wilson, W., Grev er, M. R., Byrd, J. C., Botstein, D., Brown, P . O., and Staudt, L. M. (2000), “Distinct t yp es of diffuse large B-cell lymphoma iden tified by gene expression profiling,” Natur e , 403, 503–511. Allison, D., Cui, X., Page, G., and Sabrip our, M. (2006), “Microarray data analysis: from disarray to consolidation and consensus,” Natur e R eview Genetics , 7, 55–65. Arc her, K., Dumur, C., Jo el, S., and Ramakrishnan, V. (2006), “Assessing quality of h ybridized RNA in Affymetrix GeneChip experiments using mixed effects mo dels,” Biostatistics , 7, 198–212. Barczak, A., Ro driguez, M., Hansp ers, K., Koth, L., T ai, Y., Bolstad, B., Sp eed, T., and Erle, D. (2003), “Sp otted long oligonucleotide arra ys for h uman gene expression analysis,” Genome R ese ar ch , 1, 1775–1785. Beissbarth, T., F ellenberg, K., Brors, B., Arribas-Prat, R., Bo er, J., Hauser, N. C., Scheideler, M., Hoheisel, J. D., Sch utz, G., Poustk a, A., and Vingron, M. (2000), “Pro cessing and quality con trol of DNA array hybridization data,” Bioinformatics , 16, 1014–1022. Bild, A., Y ao, G., Chang, J., W ang, Q., P otti, A., Chasse, D., Joshi, M., Harp ole, D., Lancaster, J., Berch uck, A., Olson, J. J., Marks, J., Dressman, H., W est, M., and Nevins, J. (2006), 26 “Oncogenic pathw a y signatures in human cancers as a guide to targeted therapies,” Natur e , 439(7074), 353–357. Bolstad, B. (2003), “Low Lev el Analysis of High-densit y Oligonucleotide Array Data: Back- ground, Normalization and Summarization,” Ph.D. thesis, Universit y of California, Berkeley , http://bmbolstad.com . Bolstad, B., Collin, F., Brettschneider, J., Simpson, K., Cop e, L., Irizarry , R., and Sp eed, T. (2005), “Quality Assessmen t of Affymetrix GeneChip Data,” in Bioinformatics and Computa- tional Biolo gy Solutions Using R and Bio c onductor , eds. Gentleman, R., Carey , V., Huber, W., Irizarry , R., and Dudoit, S., New Y ork: Springer, Statistics for Biology and Health, pp. 33–48. Bolstad, B., Collin, F., Simpson, K., Irizarry , R., and Speed, T. (2004), “Exp erimen tal design and lo w-level analysis of microarray data,” Int R ev Neur obiol , 60, 25–58. Bolstad, B., Irizarry , R., Astrand, M., and Sp eed, T. (2003), “A comparison of normalization metho ds for high densit y oligon ucleotide array data based on v ariance and bias,” Bioinformatics , 19, 185–193, Ev aluation studies. Buness, A., Hub er, W., Steiner, K., Sultmann, H., and Poustk a, A. (2005), “arrayMagic: tw o- colour cDNA microarra y quality control and preprocessing,” Bioinformatics , 21, 554–556. Bunney , W., Bunney , B., V a wter, M., T omita, H., Li, J., Ev ans, S., Choudary , P ., Myers, R., Jones, E., W atson, S., and Akil, H. (2003), “Microarra y technology: a review of new strategies to discov er candidate vulnerability genes in psyc hiatric disorders,” A m J Psychiatry , 160, 657– 666. Cho, R., Campb ell, M., Winzeler, E., Steinmetz, L., Conw a y , A., W o dic k a, L., W olfsb erg, T., Gabrielian, A., Landsman, D., Lockhart, D., and Da vis, R. (1998), “A genome-wide transcrip- tional analysis of the mitotic cell cycle,” Mol Cel l , Jul 2(1), 65–73. Cui, X., Hw ang, J., Qiu, J., Blades, N., and Ch urchill, G. (2005), “Improv ed statistical tests for differen tial gene expression b y shrinking v ariance comp onen ts estimates,” Biostatistics , 6, 31–46. Dobbin, K., Beer, D., Mey erson, M., Y eatman, T., Gerald, W., Jacobson, W., Conley , B., Buetow, K., Heisk anen, M., Simon, R., Minna, J., Girard, L., Misek, D., T aylor, J., Hanash, S., Naoki, K., Ha yes, D., Ladd-Acosta, C., Enk emann, S., Viale, A., and Giordano, T. (2005), “Interlaboratory comparabilit y study of cancer gene expression analysis using oligon ucleotide microarra ys,” Clin Canc er R es , 11, 565–572. Draghici, S., Khatri, P ., Eklund, A., and Szallasi, Z. (2006), “Reliabilit y and reproducibility issues in DNA microarra y measurements,” T r ends in Genetics , 22 (2), 101–109. Dudoit, S., Shaffer, J., and Boldrick, J. (2003), “Multiple h ypothesis testing in microarray exp eri- men ts,” Statistic al Scienc e , 18, 71–103. Dudoit, S., Y ang, Y., Sp eed, T., and MJ, C. (2002), “Statistical metho ds for iden tifying dif- feren tially expressed genes in replicated cDNA microarra y exp erimen ts,” Statistic a Sinic a , 12, 111–139. 27 Dum ur, C., Nasim, S., Best, A., Archer, K., Ladd, A., Mas, V., Wilkinson, D., Garrett, C., and F erreira-Gonzalez, A. (2004), “Ev aluation of quality-con trol criteria for microarray gene expression analysis,” Clin Chem , 50, 1994–2002. Efron, B., Tibshirani, R., Storey , J., and V, T. (2001), “Empirical Bay es analysis of a microarra y exp erimen t,” J A m Stat Ass , 96, 1151–1160. Fink elstein, D. (2005), “T rends in the quality of data from 5168 oligonucleotide microarra ys from a single facilit y,” J Biomol T e ch , 16, 143–153. Fink elstein, D., Ewing, R., Gollub, J., Sterky , F., Cherry , J., and Somerville, S. (2002), “Microarra y data qualit y analysis: lessons from the AFGC pro ject,” Plant Mole cular Biolo gy , 48, 119–131. Gassman, J., Ow en, W., Kuntz, T., Martin, J., and Amoroso, W. (1995), “Data qualit y assurance, monitoring, and rep orting,” Contr ol le d Clinic al T rials , 16(2 Suppl), 104S–136S. Gautier, L., Cop e, L., Bolstad, B., and Irizarry , R. (2004a), “affy - Analysis of Affymetrix GeneChip data at the prob e level,” Bioinformatics , 20(3), 307–315. Gautier, L., Moller, M., F riis-Hansen, L., and Knudsen, S. (2004b), “Alternativ e mapping of prob es to genes for Affymetrix c hips,” BMC Bioinformatics , 5, e111. GCOS (2004), GeneChip Expr ession Analysis – Data Analysis F undamentals , Affymetrix, Inc, San ta Clara, CA. Gen tleman, R., Carey , V., Hub er, W., Irizarry , R., and Dudoit, S. E. (2005), Bioinformatics and Computational Biolo gy Solutions Using R and Bio c onductor , Springer. Gro ves, R. (1987), “Research on survey data qualit y ,” Public Opinion Quaterly , 51, P art 2, Suppl., S156–S172. Hautaniemi, S., Edgren, H., V esanen, P ., W olf, M., J¨ arvinen, A., Yli-Harja, O., Astola, J., Kallion- iemi, O., and Monni, O. (2003), “A nov el strategy for microarray quality control using Bay esian net works,” Bioinformatics , 19, 2031–2038. Hoheisel, J. (2006), “Microarra y technology: b ey ond transcript profiling and genot yp e analysis,” Natur e R eview Genetics , 7 (3), 200–210. Hu, P ., Greenw o o d, C., and Beyene, J. (2005), “Integrativ e analysis of multiple gene expression profiles with qualit y-adjusted effect size mo dels,” BMC Bioinformatics , 6, e128. Hw ang, K., Kong, S., Green b erg, S., and P ark, P . (2004), “Com bining gene expression data from differen t generations of oligonucleotide arrays,” BMC Bioinformatics , 5, e159. Irizarry , R., Bolstad, B., Collin, F., Cop e, L., Hobbs, B., and Sp eed, T. (2003), “Summaries of Affymetrix GeneChip prob e level data,” Nucleic A cids R es , 31, e15. Irizarry , R., W arren, D., Sp encer, F., Kim, I., Biswal, S., F rank, B., Gabrielson, E., Garcia, J., Geoghegan, J., Germino, G., Griffin, C., Hilmer, S., Hoffman, E., Jedlic k a, A., Ka wasaki, E., Martinez-Murillo, F., Morsb erger, L., Lee, H., P etersen, D., Quack en bush, J., Scott, A., Wilson, M., Y ang, Y., Y e, S., and Y u, W. (2005), “Multiple-lab oratory comparison of microarra y platforms,” Nat Metho ds , 2, 345–350. 28 Jarvinen, A.-K., Hautaniemi, S., Edgren, H., Auvinen, P ., Saarela, J., Kallioniemi, O.-P ., and Monni, O. (2004), “Are data from different gene expression microarra y platforms comparable?” Genomics , 83, 1164–1168. Jones, L., Goldstein, D., Hughes, G., Strand, A., Collin, F., Dunnett, S., Ko operb erg, C., Ara- gaki, A., Olson, J., Augo od, S., F aull, R., Luthi-Carter, R., Moskvina, V., and Ho dges, A. (2006), “Assessment of the relationship betw een pre-chip and p ost-c hip v ariables for Affymetrix GeneChip expression data,” BMC Bioinformatics , 7, e211. Kerr, M. (2003), “Design considerations for efficien t and effective microarray studies,” Biometric a , 59, 822–828. Kluger, Y., Y u, H., Qian, J., and Gerstein, M. (2003), “Relationship betw een gene co-expression and prob e lo calization on microarra y slides,” BMC Genomics , 4, e49. Kong, S., Hwang, K., Kim, R., Zhang, B., Greenberg, S., Kohane, I., and Park, P . (2005), “Cross- Chip: a system supporting comparativ e analysis of differen t generations of Affymetrix arrays,” Bioinformatics , 21, 2116–2117. Kuo, W., Jenssen, T., Butte, A., Ohno-Mac hado, L., and Kohane, I. (2002), “Analysis of matc hed mRNA measurements from tw o different microarra y technologies,” Bioinformatics , 18, 405–412. Li, C. and W ong, H. (2001), “Mo del-based analysis of oligonucleotide arrays: Expression index computation and outlier detection,” PNAS , 98, 31–36. Lipsh utz, R., F odor, S., Gingeras, T., and Lo c khart, D. (1999), “High density synthetic oligon u- cleotide arra ys,” Nat Genet , 21, 20–24. Lo c khart, D., Dong, H., Byrne, M., F ollettie, M., Gallo, M., Chee, M., Mittmann, M., W ang, C., Koba yashi, M., Horton, H., and Bro wn, E. (1996), “Expression monitoring b y hybridization to high-densit y oligonucleotide arrays,” Nat Biote chnol , 14, 1675–1680. Lo ebl, A. (1990), “Accuracy and Relev ance and the Quality of Data,” in Data Quality Contr ol, The ory and Pr agmatics , eds. Liepins, G. and Uppuluri, V., New Y ork: Marcel Dekk er, Inc., no. 112 in Statistics: T extbo oks and Monographs, pp. 105–144. L¨ onnstedt, I. and Speed, T. (2002), “Replicated microarray data,” Statistic a Sinic a , 12 (1), 31–46. Marinez, Y., McMahan, C., Barnw ell, G., and Wigo dsky , H. (1984), “Ensuring data quality in medical researc h through an integrated data management system,” Stat Me d , 3, 101–111. Mason, R. and Y oung, J. (2002), Multivariate statistic al pr o c ess c ontr ol with industrial applic ations , Philadelphia, P ennsylv ania: ASA-SIAM. McLac hlan, G., Do, K., and Am broise, C. (2004), Analyzing Micr o arr ay Gene Expr ession Data , Hob ok en, New Jersey: Wiley . Mec ham, B., Klus, G., Strov el, J., Augustus, M., Byrne, D., Bozso, P ., W etmore, D., Mariani, T., Kohane, I., and Szallasi, Z. (2004), “Sequence-matched prob es pro duce increased cross-platform consistency and more repro ducible biological results in microarra y-based gene expression mea- suremen ts,” Nucleic A cids R es , 32, 74. 29 Meh ta, T., T anik, M., and Allison, D. (2004), “T ow ards sound epistemological foundations of statistical metho ds for high-dimensional biology ,” Natur e Genetics , 36, 943–947. Mitc hell, S., Brown, K., Henry , M., Mintz, M., Catchpo ole, D., LaFleur, B., and Stephan, D. (2004), “In ter-platform comparability of microarra ys in acute lymphoblastic leukemia,” BMC Genomics , 5, e71. Mo del, F., K¨ onig, T., Piep en bro c k, C., and Adorjan, P . (2002), “Statistical pro cess con trol for large scale microarra y exp erimen ts,” Bioinformatics , 18 Suppl 1, 155–163, Ev aluation studies. Morris, J., Yin, G., Baggerly , K., W u, C., and Zhang, L. (2004), “P o oling information across differen t studies and oligon ucleotide microarray chip t ypes to identify prognostic genes for lung cancer,” in Metho ds of Micr o arr ay Data A nalysis III , eds. Shoemaker, J. and Lin, S., New Y ork: Springer, pp. 51–66. Naef, F., Socci, N., and Magnasco, M. (2003), “A study of accuracy and precision in oligon ucleotide arra ys: extracting more signal at large concentrations,” Bioinformatics , 19, 178–184. Nimgaonk ar, A., Sanoudou, D., Butte, A., Haslett, J., Kunkel, L., Beggs, A., and Kohane, I. (2003), “Repro ducibilit y of gene expression across generations of Affymetrix microarra ys,” BMC Bioinformatics , 4, e27. No viko v, E. and Barillot, E. (2005), “An algorithm for automatic ev aluation of the sp ot quality in t wo-color DNA microarray experiments,” BMC Bioinformatics , 6, e293. P erou, C., Sorlie, T., Eisen, M., v an de Rijn, M., Jeffrey , S., Rees, C., Pollac k, J., Ross, D., Johnsen, H., Akslen, L., Fluge, O., Pergamensc hik o v, A., Williams, C., Zhu, S., Lonning, P ., Borresen-Dale, A., Brown, P ., and Botstein, D. (2000), “Molecular p ortraits of human breast tumours,” Natur e , 406, 747–752. Qian, J., Kluger, Y., Y u, H., and Gerstein, M. (2003), “Identification and correction of spurious spatial correlations in microarra y data,” Biote chniques , 35, 42–44, Ev aluation studies. Ramasw amy , S. and Golub, T. (2002), “DNA microarrays in clinical oncology ,” J. Clin. Onc ol. , 20, 1932–1941. Redman, T. (1992), Data quality: management and te chnolo gy , New Y ork: Bantam Bo oks. Reimers, M. and W einstein, J. (2005), “Quality assessmen t of microarrays: Visualization of spatial artifacts and quan titation of regional biases,” BMC Bioinformatics , 6, e166. Ritc hie, M., Diyagama, D., Neilson, J., v an Laar, R., A, D., A, H., and GK, S. (2006), “Empirical arra y quality weigh ts in the analysis of microarra y data,” BMC Bioinformatics , 7, e261. Rogo jina, A., Orr, W., Song, B., and Geisert, E. J. (2003), “Comparing the use of Affymetrix to sp otted oligon ucleotide microarrays using tw o retinal pigmen t epithelium cell lines,” Mol Vis , 9, 482–496. Ross, M., Zhou, X., Song, G., Sh urtleff, S., Girtman, K., Williams, W., Liu, H., Mahfouz, R., Raimondi, S., Lenny , N., Patel, A., and Do wning, J. (2003), “Classification of p ediatric acute lymphoblastic leuk emia by gene expression profiling,” Blo o d , 102, 2951–2959. 30 Sc ho or, O., W einsc henk, T., Hennenlotter, J., Corvin, S., Stenzl, A., Rammensee, H., and Ste- v anovic, S. (2003), “Mo derate degradation does not preclude microarray analysis of small amoun ts of RNA,” Biote chniques , 35, 1192–1196. Shewhart, W. (1939), Statistic al Metho d fr om the Viewp oint of Quality Contr ol , Lanceser, Penn- sylv ania: Lancester Press, Inc. Shipp y , R., Sendera, T., Lo c kner, R., P alaniappan, C., Kaysser-Kranic h, T., W atts, G., and J, A. (2004), “P erformance ev aluation of commercial short-oligonucleotide microarrays and the impact of noise in making cross-platform correlations,” BMC Genomics , 5, e61. Smith, K. and Hallett, M. (2004), “T ow ards quality con trol for DNA microarra ys,” J Comput Biol , 11, 945–970. Sm yth, G. (2002), “Prin t-order normalization of cDNA microarra ys,” T ec h. rep., Genetics and Bioinformatics, W alter and Eliza Hall Institute of Medical Research, Melb ourne, av ailable at www.statsci.org/smyth/pubs/porder/porder.html . Sm yth, G., Y ang, H., and Sp eed, T. (2003), “Statistical Issues in cDNA Microarra y Data Analysis,” in F unctional Genomics, Metho ds and Pr oto c ols , eds. Brownstein, M. J. and Kho dursky , A. B., T otow a, New Jersey: Humana Press, no. 224 in Metho ds in Molecular Biology , pp. 111–136. Sp eed, T. (2003), Statistic al analysis of gene expr ession of gene expr ession micr o arr ay data , Boca Raton, Florida: Chapman and Hall/CRC. Stev ens, J. and Do erge, R. (2005), “Combining Affymetrix microarray results,” BMC Bioinfor- matics , 6, e57. Storey , J. (2003), “The positive false discov ery rate: A Ba y esian interpretation and the q-v alue,” Annals of Statistics , 31, 2013–2035. Su´ arez-F ari ˜ nas, M., Haider, A., and Wittko wski, K. (2005), “”Harshligh ting” small blemishes on microarra ys,” BMC Bioinformatics , 6, e65. Subramanian, A., T amay o, P ., Mo otha, V., Mukherjee, S., Ebert, B., Gillette, M., P aulo vich, A., P omeroy , S., Golub, T., Lander, E., and Mesirov, J. (2005), “Gene set enrichmen t analysis: a kno wledge-based approach for Interpreting genomewide expression profiles,” PNAS , 102, 155545– 50. T ai, Y. and Sp eed, T. (2006), “A m ultiv ariate empirical Bay es statstic for replicated microarra y time course data,” A nn Statist , 34, 2387–2412. Thac h, D., Lin, B., W alter, E., Kruzelo c k, R., Ro wley , R., Tibb etts, C., and Stenger, D. (2003), “Assessmen t of tw o metho ds for handling blo od in collection tubes with RNA stabilizing agen t for surv eillance of gene expression profiles with high density microarrays,” J Immunol Metho ds , 283, 269–279. The Chipping F orecast (1999), The Chipping F or e c ast I , vol. 21-1s, Nature Genetics Suppl. — (2002), The Chipping F or e c ast II , v ol. 32-4s, Nature Genetics Suppl. — (2005), The Chipping F or e c ast III , v ol. 37-6s, Nature Genetics Suppl. 31 Thompson, K., Rosenzw eig, B., Pine, P ., Retief, J., T urpaz, Y., Afshari, C., Hamadeh, H., Damore, M., Bo edigheimer, M., Blomme, E., Ciurlionis, R., W aring, J., F usco e, J., Paules, R., T uc k er, C., F are, T., Coffey , E., He, Y., Collins, P ., Jarnagin, K., F ujimoto, S., Ganter, B., Kiser, G., Ka ysser-Kranich, T., Sina, J., and Sistare, F. (2005), “Use of a mixed tissue RNA design for p erformance assessments on multiple microarray formats,” Nucleic A cid R ese ar ch , 33 (2), e187. T om, B., Gilks, W., Bro ok e-Po w ell, E., and Ajiok a, J. (2005), “Quality determination and the repair of p oor quality sp ots in arra y exp erimen ts,” BMC Bioinformatics , 6, e234. T oman˘ c´ ak, P ., Beaton, A., W eiszmann, R., Kw an, E., Shu, S., Lewis, S., Richards, S., Ashburner, M., Hartenstein, V., Celniker, S., and Rubin, G. (2002), “Systematic determination of patterns of gene expression during Drosophila em bryogenesis,” Genome Biol , 3, 1–14. V awter, M., Ev ans, S., Choudary , P ., T omita, H., Meador-W o odruff, J., Molnar, M., Li, J., Lop ez, J., Myers, R., Cox, D., W atson, S., Akil, H., Jones, E., and Bunney , W. (2004), “Gender-sp ecific gene expression in p ost-mortem human brain: lo calization to sex chromosomes,” Neur opsy- chopharmac olo gy , 29, 373–384. W ang, H., He, X., Band, M., and Wilson, Cand Liu, L. (2005), “A study of inter-lab and in ter- platform agreemen t of DNA microarray data,” BMC Genomics , 6, e71. W ang, R. (2001), Data quality , Boston: Klu wer Academic Publishers. W ang, R., Storey , V., and Firth, C. (1995), “A framew ork for analysis of data quality research,” IEEE T r ansactions of Know le dge and Data Engine ering , 7, 623–640. W ang, X., Ghosh, S., and Guo, S. (2001), “Quantitativ e quality control in microarray image pro cessing and data acquisition,” Nucleic A cids R es , 29 (15), e75. Wilson, C. and Miller, C. (2005), “Simpleaffy: a BioConductor pack age for Affyme tr ix quality con trol and data analysis,” Bioinformatics , 21, 3683–3685. Wit, E. and McClure, J. (2004), Statistics for micr o arr ays: design, analysis, infer enc e , Hoboken, New Jersey: Wiley . W o o, Y., Affourtit, J., Daigle, S., Viale, A., Johnson, K., Naggert, J., and Churc hill, G. (2004), “A comparison of cDNA, oligon ucleotide, and Affymetrix GeneChip gene expression microarray platforms,” J Biomol T e ch , 15, 276–284. Y ang, Y., Buckley , M., and Sp eed, T. (2001), “Analysis of cDNA microarray images,” Brief Bioin- form , 2, 341–349. Y ang, Y., Dudoit, S., Luu, P ., Lin, D., P eng, V., Ngai, J., and Speed, T. (2002), “Normalization for cDNA microarray data: a robust comp osite metho d addressing single and multiple slide systematic v ariation,” Nucleic A cids R es , 30, e15. Y auk, C., Berndt, M., Williams, A., and Douglas, G. (2004), “Comprehensive comparison of six microarra y technologies,” Nucleic A cid R ese ar ch , 32 (15), e124. Y eoh, E., Ross, M., Shurtleff, S., Williams, W., Patel, D., Mahfouz, R., Behm, F., Raimondi, S., Relling, M., Patel, A., Cheng, C., Campana, D., Wilkins, D., Zhou, X., Li, J., Liu, H., Pui, C., Ev ans, W., Naeve, C., W ong, L., and Do wning, J. (2002), “Classification, subtype discov ery , and 32 prediction of outcome in p ediatric acute lymphoblastic leuk emia by gene expression profiling,” Canc er Cel l , 1, 133–143. Y uen, T., W urmbac h, E., Pfeffer, R., Eb ersole, B., and Sealfon, S. (2002), “Accuracy and cali- bration of commercial oligon ucleotide and custom cDNA microarra ys,” Nucleic A cids R es , 30, e48. Zhang, W., Shmulevic h, I., and Astola, J. (2004), Micr o arr ay Quality Contr ol , Hob ok en, New Jersey: John Wiley & Sons, Inc. Zh u, B., Ping, G., Shinohara, Y., Zhang, Y., and Baba, Y. (2005), “Comparison of gene expression measuremen ts from cDNA and 60-mer oligonucleotide microarrays,” Genomics , 85, 657–665. 33 FIGURES Figur e A1. W eight landscap es of tw o c hips from the Affymetrix HU95 spike-in experiment. The c hip on the right-hand side is t ypical for this data set, only tiny local defects and an ov erall go od prob e p erformance. The chip of the left-hand side (chip #20) has more do wn-w eigh ted prob es all o ver the slide, and it has a large down-w eigh ted area in the upper left part of the slide . Figur e A2. Series of b o xplots of NUSE (first row) and RLE (second ro w) of 24 chips from the Affymetrix HU95 spike-in exp erimen t. Chip #20 is a clear outlier according to all our qualit y measures: Med(RLE), IQR(RLE), Med(NUSE) and IQR(NUSE) . 34 Figur e A3. Affymetrix quality scores and IQR(RLE) for the 24 c hips from the Affymetrix HU95 spik e-in exp erimen t with the 3 technical replicates in different gra y levels (left/cen ter/righ t in each v ertical plot). The outlier chip #20 from Figure A2 is the chip #4 blue in this figure. It is caught b y GAPDH 3’/5’. By all other Affymetrix qualit y measures it is placed within the group of low er qualit y chips, but it do es not stand out . 35 Figur e B1. Series of boxplots of RLE (first line) and NUSE (second line) for all 20 MLL 133B c hips from St. Jude’s. Chip #15 is an outlier according to all our quality measures: Med(RLE), IQR(RLE), Med(NUSE) and IQR(NUSE) . Chip #10. Chip #11. Chip #15. Figur e B2. W eight images for some of St. Jude’s MLL HU133B chips. Chip #10 and c hip #11 sho w low weigh ts ov erall and small areas with higher weigh ts. Chip #15 has elev ated w eigh ts o verall and a region cov ering almost a third of the total area with extremly high w eigh ts . 36 Figur e B3. Med(NUSE) versus GCOS qualit y rep ort scores for 20 MLL HU133B chips from St. Jude’s data. The outlier chip #15 is in the normal range according to all GCOS quality scores . 37 Figur e C1. Med(NUSE) versus GCOS qualit y rep ort scores for 129 St. Jude’s HU133A c hips. Chips with top three Med(NUSE) v alues are highligh ted. Med(NUSE) sho ws a linear asso ciation with Percen t Present and with Scale F actor. Noise shows some asso ciation with Scale F actor, though not quite a linear one. Ho w ever, the asso ciation betw een Noise and Med(NUSE) is very w eak. GAPDH 3’/5’ do es not show a linear asso ciation with any of the GCOS scores nor with Med(NUSE) . 38 m 5.5 5.5 M 5.5 M 5.5 6.0 6.5 6.5 M 6.5 M 6.5 7.0 7.5 7.5 M 7.5 M 7.5 8.0 8.5 8.5 M 8.5 M 8.5 Perfect match - Chip A M Perfect match - Chip A M Perfect match - Chip A m #8 #8 M #8 M #8 R4 R4 M R4 M R4 C16 C16 M C16 M C16 C18 C18 M C18 M C18 C21 C21 M C21 M C21 C22 C22 M C22 M C22 C23 C23 M C23 M C23 C32 C32 M C32 M C32 C1 C1 M C1 M C1 C4 C4 M C4 M C4 C11 C11 M C11 M C11 C13 C13 M C13 M C13 C15 C15 M C15 M C15 C6 C6 M C6 M C6 C8 C8 M C8 M C8 #14 #14 M #14 M #14 #12 #12 M #12 M #12 Relative log expression - Chip A M Relative log expression - Chip A M Relative log expression - Chip A m -0.2 -0.2 M -0.2 M -0.2 0 0 M 0 M 0 0.2 0.2 M 0.2 M 0.2 m #8 #8 M #8 M #8 R4 R4 M R4 M R4 C16 C16 M C16 M C16 C18 C18 M C18 M C18 C21 C21 M C21 M C21 C22 C22 M C22 M C22 C23 C23 M C23 M C23 C32 C32 M C32 M C32 C1 C1 M C1 M C1 C4 C4 M C4 M C4 C11 C11 M C11 M C11 C13 C13 M C13 M C13 C15 C15 M C15 M C15 C6 C6 M C6 M C6 C8 C8 M C8 M C8 #14 #14 M #14 M #14 #12 #12 M #12 M #12 m 1.00 1.00 M 1.00 M 1.00 1.05 1.10 1.10 M 1.10 M 1.10 NUSE - Chip A M NUSE - Chip A M NUSE - Chip A m #8 #8 M #8 M #8 R4 R4 M R4 M R4 C16 C16 M C16 M C16 C18 C18 M C18 M C18 C21 C21 M C21 M C21 C22 C22 M C22 M C22 C23 C23 M C23 M C23 C32 C32 M C32 M C32 C1 C1 M C1 M C1 C4 C4 M C4 M C4 C11 C11 M C11 M C11 C13 C13 M C13 M C13 C15 C15 M C15 M C15 C6 C6 M C6 M C6 C8 C8 M C8 M C8 #14 #14 M #14 M #14 #12 #12 M #12 M #12 Figur e D1. Boxplots of qualilt y measures for St. Jude’s Hyperdip HU133A chips. P erfect match distributions are heterogeneous. #12, #8 and #14 hav e elev ated IQR(RLE). #12 is a clear outlier in NUSE. The bulk of the chips are of go od quality according to both NUSE and RLE. m 5.5 5.5 M 5.5 M 5.5 6.0 6.5 6.5 M 6.5 M 6.5 7.0 7.5 7.5 M 7.5 M 7.5 8.0 8.5 8.5 M 8.5 M 8.5 Perfect match - Chip B M Perfect match - Chip B M Perfect match - Chip B m #8 #8 M #8 M #8 R4 R4 M R4 M R4 C16 C16 M C16 M C16 C18 C18 M C18 M C18 C21 C21 M C21 M C21 C22 C22 M C22 M C22 C23 C23 M C23 M C23 C32 C32 M C32 M C32 C1 C1 M C1 M C1 C4 C4 M C4 M C4 C11 C11 M C11 M C11 C13 C13 M C13 M C13 C15 C15 M C15 M C15 C6 C6 M C6 M C6 C8 C8 M C8 M C8 #14 #14 M #14 M #14 #12 #12 M #12 M #12 Relative log expression - Chip B M Relative log expression - Chip B M Relative log expression - Chip B m -0.2 -0.2 M -0.2 M -0.2 0 0 M 0 M 0 0.2 0.2 M 0.2 M 0.2 m #8 #8 M #8 M #8 R4 R4 M R4 M R4 C16 C16 M C16 M C16 C18 C18 M C18 M C18 C21 C21 M C21 M C21 C22 C22 M C22 M C22 C23 C23 M C23 M C23 C32 C32 M C32 M C32 C1 C1 M C1 M C1 C4 C4 M C4 M C4 C11 C11 M C11 M C11 C13 C13 M C13 M C13 C15 C15 M C15 M C15 C6 C6 M C6 M C6 C8 C8 M C8 M C8 #14 #14 M #14 M #14 #12 #12 M #12 M #12 m 1.00 1.00 M 1.00 M 1.00 1.05 1.10 1.10 M 1.10 M 1.10 NUSE - Chip B M NUSE - Chip B M NUSE - Chip B m #8 #8 M #8 M #8 R4 R4 M R4 M R4 C16 C16 M C16 M C16 C18 C18 M C18 M C18 C21 C21 M C21 M C21 C22 C22 M C22 M C22 C23 C23 M C23 M C23 C32 C32 M C32 M C32 C1 C1 M C1 M C1 C4 C4 M C4 M C4 C11 C11 M C11 M C11 C13 C13 M C13 M C13 C15 C15 M C15 M C15 C6 C6 M C6 M C6 C8 C8 M C8 M C8 #14 #14 M #14 M #14 #12 #12 M #12 M #12 Figur e D2. Boxplots of qualilt y measures for St. Jude’s Hyperdip HU133B chips. Perfect matc h distributions are heterogeneous. #12 has elev ated IQR(RLE). #12 is a clear outlier in NUSE. The bulk of the chips are of go od quality according to b oth NUSE and RLE. Figur e E1. Bo xplots of the estimated residual scales for diagnostic subgroups in the St. Jude’s dataset. They show noticable quality differences . 39 Figur e F1. Series of b o xplots of log-scaled PM intensities (first ro w), RLE (second row) and NUSE (third ro w) for a comparison of nine fruit fly m utants with 3 to 4 tec hnical replicates eac h. The patterns below the plot indicate m utan ts and the colors of the b o xes indicate h ybridization dates. Med(RLE), IQR(RLE), Med(NUSE) and IQR(NUSE) all indicate substan tially low er quality on the da y colored indigo . Figur e F2. “W a ves”. W eight image for a typical c hip in the fruit fly m utan t dataset. . 40 Figur e G1. Series of b o xplots of log-scaled PM intensities (first row), RLE (second row) and NUSE (third row) in the fruit fly dev elopment data. Boxes 1-12 represent 12 developmen tal stages (visualized b y different colors), b o xes 13-24 and b o xes 25-36 represen t replicates of the whole series. Replicate series B (b o xes 13-24) was hybridized on a differen t day than the other t wo series. Both RLE and NUSE indicate lo wer qualit y for series B. The first couple of chips and the last couple of chips of each series are different from the rest in terms of Med(RLE) deviating from zero (in v arying direction), IQR(RLE) being larger, Med(NUSE) being elev ated. This is probably mainly driv en by the increased high biological v ariabilit y in these stages . 41 Figur e G2. P aired quality measures for fruit fly dev elopment with chips colored dep ending on the day of the hybridization. Med(PM) has no linear asso ciation with an y of the other measures. IQR(RLE) and Med(NUSE) sho w a linear asso ciation on the da y colored in ligh t blue and a w eak linear asso ciation on the day colored in blac k . 42 Figur e H1. Series of b o xplots of log-scaled PM intensities (first row), RLE (second row) and NUSE (third ro w) for Pritzk er gender study brain samples hybridized in t wo labs (some replicates missing). Color indicates lab site (dark for lab M, light for lab I). The PM intensit y distributions are all lo cated around 6 for lab M, and around 10 for lab I. These systematic lab site differences are reflected by IQR(RLE), Med(NUSE) and RLE(NUSE), which consistently show substantially lo wer quality for lab h ybridizations than for lab M h ybridizations . 43 m 5 5 M 5 M 5 6 6 M 6 M 6 7 7 M 7 M 7 8 8 M 8 M 8 9 9 M 9 M 9 Med(PM) M Med(PM) M Med(PM) m I I M I M I M M M M M M m 0.1 0.1 M 0.1 M 0.1 0.2 0.2 M 0.2 M 0.2 0.3 0.3 M 0.3 M 0.3 0.4 0.4 M 0.4 M 0.4 0.5 0.5 M 0.5 M 0.5 0.6 0.6 M 0.6 M 0.6 0.7 0.7 M 0.7 M 0.7 0.8 0.8 M 0.8 M 0.8 IQR(RLE) M IQR(RLE) M IQR(RLE) m I I M I M I M M M M M M m 1.00 1.00 M 1.00 M 1.00 1.05 1.05 M 1.05 M 1.05 1.10 1.10 M 1.10 M 1.10 Med(NUSE) M Med(NUSE) M Med(NUSE) m I I M I M I M M M M M M m 5 5 M 5 M 5 6 6 M 6 M 6 7 7 M 7 M 7 8 8 M 8 M 8 9 9 M 9 M 9 Med(PM) M Med(PM) M Med(PM) M M m I I M I M I M M M M M M m 0.1 0.1 M 0.1 M 0.1 0.2 0.2 M 0.2 M 0.2 0.3 0.3 M 0.3 M 0.3 0.4 0.4 M 0.4 M 0.4 0.5 0.5 M 0.5 M 0.5 0.6 0.6 M 0.6 M 0.6 0.7 0.7 M 0.7 M 0.7 0.8 0.8 M 0.8 M 0.8 IQR(RLE) M IQR(RLE) M IQR(RLE) M M m I I M I M I M M M M M M m 1.00 1.00 M 1.00 M 1.00 1.05 1.05 M 1.05 M 1.05 1.10 1.10 M 1.10 M 1.10 Med(NUSE) M Med(NUSE) M Med(NUSE) M M m I I M I M I M M M M M M m 5 5 M 5 M 5 6 6 M 6 M 6 7 7 M 7 M 7 8 8 M 8 M 8 9 9 M 9 M 9 Med(PM) M Med(PM) M Med(PM) .......................................... M .......................................... M .......................................... m D D M D M D M M M M M M m 0.1 0.1 M 0.1 M 0.1 0.2 0.2 M 0.2 M 0.2 0.3 0.3 M 0.3 M 0.3 0.4 0.4 M 0.4 M 0.4 0.5 0.5 M 0.5 M 0.5 0.6 0.6 M 0.6 M 0.6 0.7 0.7 M 0.7 M 0.7 0.8 0.8 M 0.8 M 0.8 IQR(RLE) M IQR(RLE) M IQR(RLE) .......................................... M .......................................... M .......................................... m D D M D M D M M M M M M m 1.00 1.00 M 1.00 M 1.00 1.05 1.05 M 1.05 M 1.05 1.10 1.10 M 1.10 M 1.10 Med(NUSE) M Med(NUSE) M Med(NUSE) .......................................... M .......................................... M .......................................... m D D M D M D M M M M M M Figur e I1. Three brain regions from Pritzker mo od disorder dataset, eac h sample hybridized in t wo labs (lab site indicated by the letters I, M and D, as well as b y colors of the b o xes). The b o xplots sketc h the distribution of quality measure summaries across entire sets of about 40 c hips eac h. There are still differences b et w een the Med(PM) of the t wo different labs, but they are relativ ely small. In cereb ellum, lab M still pro duced sligh tly higher quality h ybridizations than lab I, while the ranking is rev ersed and more pronounced in an terior cingulate cortex. In dorsolateral prefron tal cortex, lab M shows slightly lo w er qualit y than the replicate site D . 44 J1. ”Bubbles” J2. ”Circle and Stick” J3. ”Sunset” J4. ”P ond” J5. ”Letter S” J6. ”Compartmen ts” J7. ”T riangle” J8. ”Fingerprin t” Figur e J1-8. Quality landscapes of some selected early St. Jude’s chips .
Original Paper
Loading high-quality paper...
Comments & Academic Discussion
Loading comments...
Leave a Comment