Information Transfer in Social Media
Recent research has explored the increasingly important role of social media by examining the dynamics of individual and group behavior, characterizing patterns of information diffusion, and identifying influential individuals. In this paper we sugge…
Authors: Greg Ver Steeg, Aram Galstyan
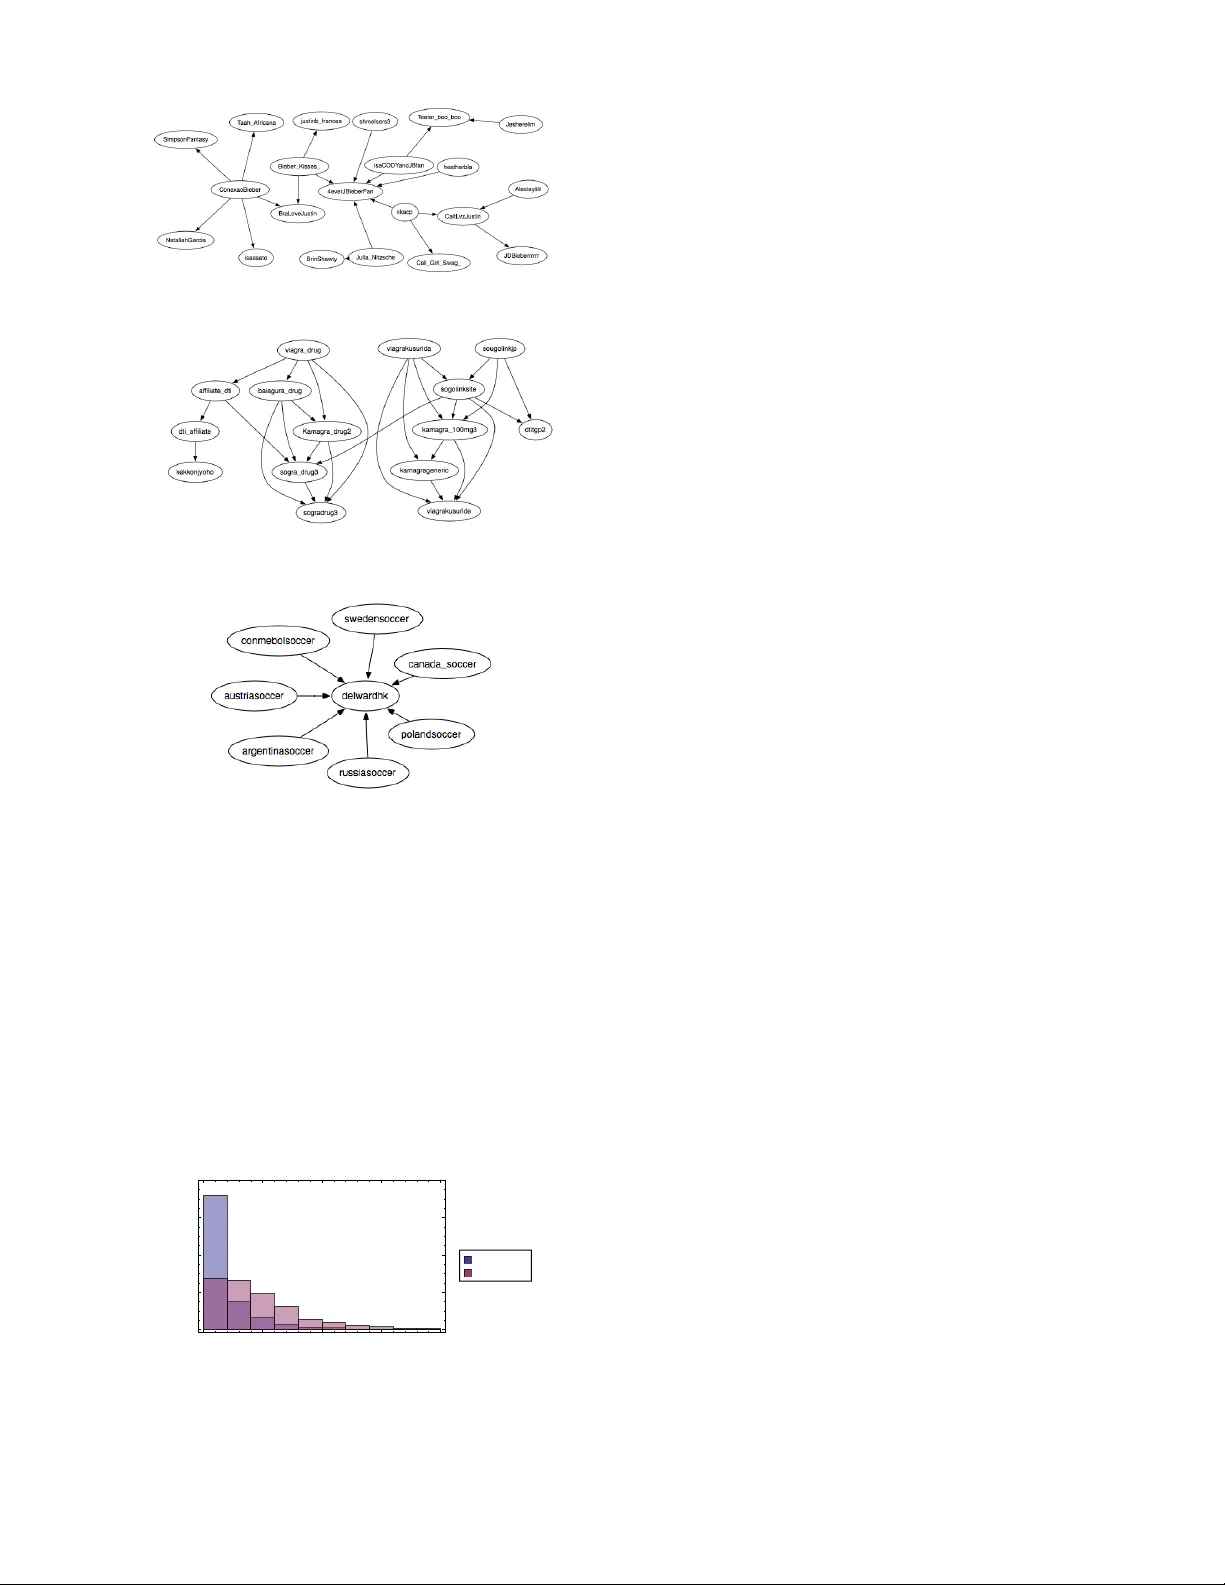
Information T ransfer in So cial Media Greg V er Steeg and Aram Galst y an ∗ USC Information Scienc es Institute,Marina del R ey, CA 90292 (Dated: No vem b er 27, 2024) Recen t researc h has explored the increasingly important role of social media b y examining the dynamics of individual and group b ehavior, characterizing patterns of information diffusion, and iden tifying influen tial individuals. In this paper w e suggest a measure of causal relationships b et w een no des based on the information–theoretic notion of transfer entrop y , or information transfer. This theoretically grounded measure is based on dynamic information, captures fine–grain notions of influence, and admits a natural, predictiv e in terpretation. Causal netw orks inferred b y transfer en tropy can differ significantly from static friendship netw orks because most friendship links are not useful for predicting future dynamics. W e demonstrate through analysis of syn thetic and real–world data that transfer entrop y reveals meaningful hidden net work structures. In addition to altering our notion of who is influential, transfer en tropy allo ws us to differentiate betw een weak influence ov er large groups and strong influence ov er small groups. I. INTR ODUCTION Recen t y ears ha v e witnessed an explosiv e growth of v arious so cial media sites suc h as online so cial netw orks, discussion forums and message b oards, and inter-link ed blogs. F or researchers, so cial media serv es as a fertile ground for examining social in teractions on an unprece- den ted scale [4]. One imp ortan t problem is the charac- terization and identification of influentials , which can b e defined as users who influence the behavior of large n um- b ers of other users. Recen t work on influence propaga- tion has used numerous c haracterizations of influentials based on topological centralit y measures suc h as P ager- ank score [8, 11]. T o c haracterize influence in Twitter, re- searc hers hav e suggested n umber of follow ers, men tions, and retw eets [5], and Pagerank of follow er net work [9]. It has b een observ ed, how ever, that the purely structural measures of influence can be misleading [6] and high p op- ularit y do es not necessarily imply high influence [14, 16]. More recent w ork has used the size of the cascade trees [1] and influence–passivit y score [14]. One serious drawbac k of existing metho ds is that they are based on explicit causal knowledge (i.e., A resp onds to B), whereas for man y data sets suc h knowledge is not av ailable and needs to be discov ered. Here we suggest a mo del–free approac h to uncov er- ing causal relationships and identifying influen tial users based on their capacit y to pr e dict the b ehavior of other users, through the information-theoretic notion of tr ans- fer entr opy , in terc hangeably referred to as information transfer. In a nutshell, transfer entrop y b etw een tw o sto c hastic pro cesses characterizes the reduction of un- certain t y in one pro cess due to the knowledge of the other process; a mathematical definition is giv en below. T ransfer en tropy can b e though t of as a nonlinear gen- eralization of Granger causality [3], and has b een used extensiv ely in computational neuroscience, e.g., for ex- ∗ { gregv,galsty an } @isi.edu amining causal relationships in cortical neurons [7]. In con trast to other correlation measures suc h as m utual information, transfer entrop y is asymmetric and allows differen tiation in the direction of information flo w. F ur- thermore, whereas most existing studies are concerned with aggr e gate measures of influence, the approac h out- lined here allo ws more fine–grained analysis of informa- tion diffusion by analyzing information transfer on eac h existing link in the net work. Finally , our approach is mo del-free. Information–theoretic measures allow us to statistically c haracterize our uncertaint y without making assumptions about human b ehavior. The rest of this pap er is organized as follows. W e b egin by describing the basic in tuition and mathemat- ics b ehind the information transfer, and briefly men tion computational issues of the approac h. In Section I I I A we presen t results of our simulation with synthetically gen- erated data, where we thoroughly examine ho w the infor- mation transfer dep ends on v arious characteristics of the data generating pro cess. In Section I II B we present our results on real-world data extracted from user activities on Twitter. W e conclude the paper by discussing results and some future work in Section IV. I I. TRANSFER ENTROPY A. Notation F or eac h user, X , we record the history of activity , e.g., timing of t w eets, as a sequence of times as S X = { t j : 0 < t 1 < t 2 . . . } . In general, we assume each user’s activit y is describ ed by some stochastic p oin t process. W e are limited by finite data to consider finite temp oral resolution, so we introduce the binned random v ariable, B X ( a, b ) ≡ 1 if ∃ t j ∈ S X ∩ ( b, a ] , 0 otherwise. (1) If w e observe the actions of a user for some long p eriod of time T , we can define probabilities o ver these coarse- 2 grained v ariables. Fix δ ∈ R , then P ( B X ( t, t − δ ) = X t ) ≡ 1 T − δ Z T δ dt [ B i ( t, t − δ ) = X t ] Similarly , we could define a join t probability distribution o v er a sequence of adjacent bins, P ( B X ( t, t − δ 0 ) = X t , B X ( t − δ 0 , t − δ 0 − δ 1 ) = X t − 1 , . . . ) , with widths δ 0 , δ 1 , . . . , δ k ∈ R . W e will omit the binning function for succinctness, P ( X t , X t − 1 , . . . , X t − k ) . W e can write this ev en more compactly by defining X ( t − k ) t ≡ { X t , . . . , X t − k } . The dynamics of a user ma y dep end on users they are linked to in some unknown, arbitrary w ay . There- fore, for t wo users X and Y , with activities recorded b y S X , S Y , we define a joint probability distribution using a common set of bins denoted with widths δ 0 , δ 1 , . . . as P ( X ( t − k ) t , Y ( t − k ) t ). Conditional and marginal probabilit y distributions are defined in the usual wa y and we use the standard definition for conditional entrop y for discrete random v ariables A, B distributed according to P ( A, B ), H ( A | B ) = − X A,B P ( A, B ) log P ( A | B ) . B. Definition of transfer entrop y The tr ansfer entr opy in tro duced in [15] is defined as T X → Y = H ( Y t | Y ( t − k ) t − 1 ) − H ( Y t | Y ( t − k ) t − 1 , X ( t − l ) t − 1 ) (2) The first term represents our uncertaint y ab out Y t giv en Y ’s history only . The second term represents the smaller uncertain t y when we know X ’s history as well. Thus, transfer entrop y explicitly describ es the reduction of un- certain t y in Y t due to knowledge of X ’s recen t activit y . Note that information transfer is asymmetric, as opp osed to mutual information, and th us b etter suited for char- acterizing directed information transfer. F or simplicity , w e tak e l = k from here on. C. Sampling problems and solutions The use of information–theoretic tec hniques to analyze real-w orld point pro cesses has been studied almost exclu- siv ely in the con text of neural activity[17]. Therefore, it is in this literature that the problems associated with estimating en tropies for sparse p oin t pro cess data hav e b een explored most thoroughly . The fundamen tal prob- lem is that, in the absence of sufficien t data, estimating en tropies from probability distributions based on binned frequencies leads to systematic bias [13]. Intuitiv ely , if w e hav e k bins of history then w e need O (2 k ) pieces of data in order to sample all p ossible histories. A v ariety of remedies are a v ailable and w e mak e use of sev eral. T he most obvious solution is to restrict our- selv es to situations where we hav e adequate data. In the subsequen t analysis, we filter out users that are b elo w a certain activity lev el. In practice, how ever, raising our activit y threshold high enough to guarantee con v ergence of entropies w ould eliminate almost all users from our dataset. The next remedy to apply is to estimate the av erage magnitude of the systematic bias that results from using sparse data and subtract it from our estimate. When w e calculate the en tropies in Eq. 2, we subtract out the P anzeri-T rev es bias estimate[12]. Fig. 2 illustrates the effect of this bias correction as a function of amount of data collected. The definition in Eq. 2 implicitly dep ends on bin widths specified by the δ i ’s. The simplest pro cedure, and the one tak en in the neural spike train literature, is to set all the bins to hav e equal width. W e hav e a great deal of pre-existing empirical knowledge ab out h uman activit y that can help us impro v e on this method. Many studies ha v e shown that h umans exhibit a hea vy tail in the dis- tribution of their resp onse times to communications[2]. This implies that bins accoun ting for recent activity should b e narro w er while bins accoun ting for older ac- tivit y can b e wider. W e can even base these bin widths on measured resp onse times, if suc h data is a v ailable. Us- ing more informative bins means w e can use few er bins, reducing the effect of sampling problems. A final technique to reduce bias is discussed in [17] and uses a class of binless entrop y estimators. These tec hniques carry their own mathematical difficulties and w e will not consider them here. With these to ols in hand, w e can proceed to use information transfer to analyze user activit y in so cial media. I II. RESUL TS In this section w e rep ort the results of our experiments with b oth syn thetic data and real world data from Twit- ter. The ultimate goal is to infer information transfer b et ween agen ts in the netw ork by analyzing their pat- terns of activity . Patterns of activity could include many things including timing, con ten t, and medium of mes- sages. W e fo cus only on the timing of activit y on Twitter (t w eeting of URLs). In principle, our analysis could be extended to include more complex information, but, as discussed, this would require either more data or better metho ds for dealing with sparse data. W e test and v alidate our abilit y to infer information transfer from patterns of activit y in tw o wa ys. First, while our information–theoretic analysis of so cial net- w ork data uses only timing of activity , the data includes unique identifiers allowing us to trac k the flow of informa- tion through the netw ork. On Twitter, we trac k sp ecific URLs. W e can use the spread of these track able pieces of information to confirm that the information transfer 3 inferred solely from the timing of activity corresp onds to actual exc hanges of information. F or the synthetic data, w e dictate that an agent’s ac- tivit y dep ends on its neighbors’ activit y in some fixed w a y . This allows us to chec k how well information trans- fer reco vers the hidden dep endence structure from activ- it y patterns alone. F or instance, ev en without kno wing an ything ab out the net w ork structure, we find that a sufficien t amount of data allo ws p erfect reconstruction of the underlying netw ork. A. Exp erimen ts with synthetic data T o form a b etter understanding of different factors im- pacting information transfer, w e p erformed extensive ex- p erimen ts with synthetically generated data. Ideally , w e w ould like our syn thetic data to reflect, in a tunable wa y , the c hallenges we face with real world data. These chal- lenges include a long tail for human resp onse times, het- erogeneous response to neighbors’ activity , bac kground noise affecting no de dynamics, incorrect data, and insuf- ficien t data. W e explore these challenges first for a pair of nodes, and then for an entire netw ork. W e mo del user activit y as a coupled, non-homogeneous P oisson p oint pro cess. Supp ose that w e ha ve tw o nodes and a single link from X → Y . W e can characterize Y ’s activit y in terms of a time-dep endent rate. W e define S t X ≡ S X ∩ [0 , t ), that is, the activity for X until time t . λ Y ( t | S t X ) = µ + γ X t i ∈ S t X g ( t − t i ) (3) The first term, µ , represents a constan t rate of back- ground activity . The second term represents a time- dep enden t increase in the rate of activity in resp onse to activit y from a neigh b or. The strength of influence of X is parametrized by γ . In practice, w e will set the bac kground rate equal to a constan t and v ary the rela- tiv e strength γ /µ through the parameter γ . The time dep endence of the influence is captured by the function g . W e set g (∆ t ) = min(1 , 1 hour ∆ t 3 ) to reflect the ob- serv ed fact that the distribution of human resp onse times are c haracterized b y a long tail[2]. Along with a causal netw ork, Eq. 3 defines a genera- tiv e model for p oin t process activity . W e can efficiently generate activity according to this mo del using the thin- ning metho d discussed in [10]. W e v ary the total amount of data by fixing the background rate µ = 1 ev en t/day and v arying the total amount of observ ation time, T . Equiv alentl y , we could ha v e fixed T and v aried the rate of activity . After fixing the parameters, we can gener- ate data and then use that data to infer the appropriate probabilities to calculate information transfer according to Eq. 2. As discussed in Sec. II C, we tak e a v ariety of measures to ensure go o d estimation. In this case, we directly con- trol the amount of data through the parameter T . F or the bin widths w e choose δ 0 = 1 sec, fixing the finest temp oral resolution. F or the history we c hoose wider bin widths for less recent history . In the synthetic examples w e take the past three hours of history into accoun t b y c ho osing δ 1 = 1 hour , δ 2 = 2 hours. Also, it should b e assumed that the Panzeri-T reves bias estimate has b een tak en in to account, except in Fig. 2(a) where we compare results without bias correction. FIG. 1: If we hav e influence from X → Y but not vice versa, the asymmetry in the information transfer correctly reflects the direction of influence. Information transfer plotted for a single pair of users. Note that in the example in Eq. 3, we hav e allow ed X to affect Y , but not vice versa. As a first test we can generate some data for a pair of users and then compare T X → Y and T Y → X . In Fig. 1, w e compare these t wo quan- tities when γ /µ = 2 as a function of the total observ ation time T . In Fig. 2 w e examine the accuracy and conv ergence of information transfer estimates as a function of time b oth with and without bias correction. W e ran 200 trials and plot the mean and standard deviation of the information transfer estimate at each time step. Clearly , there is a systematically high estimate in the lo w sampling regime, but, ev en in that case, higher influence leads to a higher information transfer on a verage. The P anzeri-T reves bias correction drastically reduces, but do es not completely eliminate, this systematic error. Next, we consider the same scenario, where we gen- erate X , Y according some stochastic pro cess, but now imagine that w e do not see all activity . That is, what if we do not see ev ery ev ent due to limited sampling? This is often the case, for instance, with Twitter data, where researchers t ypically hav e access to only a small fraction of all tw eets, ranging from 1% − 20%. So we set a sampling parameter f , and sa y that for eac h t i ∈ S X , w e only k eep that ev ent with probability f . A summary of how the final transfer entrop y , T Y → X , dep ends on the sampling rate, f , is given in Fig. 3. W e show the results after 500 days to guarantee enough data to b e very close to con v ergence. W e see that sampling drastically reduces the inferred transfer entrop y , destroying our abilit y to de- duce flo w of information. So far, w e ha ve only considered tw o no des with a single link b et w een them. No w, we w ant to consider a directed, causal net w ork of N no des, with some arbitrary connec- 4 10 50 100 150 200 0 2. ´ 10 - 6 4. ´ 10 - 6 6. ´ 10 - 6 8. ´ 10 - 6 0.00001 Time H days L Information Transfer Γ Μ = 2 Γ Μ = 0 (a) 10 50 100 150 200 0 2. ´ 10 - 6 4. ´ 10 - 6 6. ´ 10 - 6 8. ´ 10 - 6 0.00001 Time H days L Information Transfer Γ Μ = 2 Γ Μ = 0 (b) FIG. 2: Mean and std for the estimate of information transfer a veraging ov er 200 pairs of users with γ /µ = 0 , 2 as a function of time. (a) Results without correcting for bias and (b) with P anzeri-T reves bias correction[12]. 5 25 50 75 100 0 2. ´ 10 - 7 4. ´ 10 - 7 6. ´ 10 - 7 8. ´ 10 - 7 1. ´ 10 - 6 1.2 ´ 10 - 6 Sampling rate H % L Information Transfer FIG. 3: A summary of the mean and std of the inferred v alue of T Y → X a veraged o v er 200 trials as a function of the sampling rate, with T = 500 days and γ /µ = 2. tivit y pattern. W e consider a similar sto c hastic model as defined in Eq. 3, except now we denote the set of Y ’s neigh b ors (i.e., p eople who can influence Y ) as N ( Y ). λ Y ( t | S t N ( Y ) ) = µ + X X ∈N ( Y ) γ X X t i ∈ S t X g ( t − t i ) (4) T o begin we imagine γ X = γ for all neigh b ors, but in general a no de may b e affected more strongly by some neigh b ors than others. A sample of activity generated according to this mo del is giv en in Fig. 4. The c hallenge is to tak e the information giv en by the activit y and reco v er the underlying graph structure. F or eac h pair of nodes, X , Y , w e calculate T X → Y . Then we FIG. 4: Each row represen ts a different user. Eac h line repre- sen ts an even t for that user ov er a time p erio d of thirt y days. With enough data we could calculate the information transfer b et ween each pair of users and reco ver the unknown netw ork structure exactly . pic k some threshold T 0 , and if T X → Y > T 0 , w e con- sider there to b e an edge from X → Y , otherwise not. W e could chec k our true p ositiv e rate and false p osi- tiv e rate as a function of T 0 , as shown in Fig. 5(a), for N = 20 , γ /µ = 1 . 0 and time = 450 days. W e sho w an ex- ample of the recov ered v ersus actual netw ork in Fig. 5(b), using a threshold pick ed according to F-measure. The previous example was c hosen to show what kinds of errors arise given a w eak signal. In general, with either enough data or strong enough influence, w e can p erfectly reco v er the underlying graph structure. If we consider the area under the R OC curve (AUC), as in Fig. 5(a), then an AUC of 1 corresp onds to p erfect reconstruction of the graph. W e summarize the AUCs for random netw orks with N = 20 and h k i = 3, while v arying T and γ /µ in Fig. 6. As a final exp eriment, we can consider the effect of al- lo wing differen t γ b et ween differen t pairs of nodes. Fig. 7 sho ws that transfer entrop y is able to recov er the relative influence w ell. In principle, there are many other effects we could ha v e considered to make a more realistic synthetic mo del. Bac kground and influence rates should v ary for different individuals. There may b e p erio dicit y defined by daily , w eekly , and mon thly cycles. How ever, because informa- tion transfer mak es no model assumptions, it is relativ ely insensitiv e to suc h details. The main constraint is data, whic h is why we fo cused on sensitivit y to amount and qualit y of observ ations. B. Results for Twitter dataset Twitter is a p opular micro-blogging service. As of July 2011, users send 200 million tw eets p er day . Twitter has b ecome an important to ol for researc hers b oth due to the volume of activity and b ecause of the easily av ailable to ols for data collection. Twitter’s “Gardenhose” API, allo ws access to 20% − 30% of all t w eets. Unfortunately , as discussed in Sec. I I I A, filtering of 5 (a) (b) FIG. 5: (a) ROC curve and (b) transfer–entrop y induced graph for the synthetically generated data described in the text. Threshold is c hosen according to F-measure. Black solid lines corresp ond to true p ositiv es, red dashed lines to false p ositiv es and blue dotted lines to false negatives. 0 50 100 150 200 250 300 350 0.75 0.80 0.85 0.90 0.95 1.00 Days AUC à Γ Μ = 4 æ Γ Μ = 2 FIG. 6: AUC of the netw ork inferred using transfer entrop y as a function of T , with γ /µ = 2 , 4. data can lead to a drastic reduction in the measured in- formation transfer. Instead, the Gardenhose API was used to identify URLs b eing tw eeted. Then, the searc h API was used to find all mentions of these URLs in an y t w eets by any users. In this w ay , the filtering limitation is av oided, while we restrict ourselves to the domain of URL posting. Additionally , eac h URL corresponds to a unique piece of information whose mo v ement through the net w ork can b e traced. The data also includes the full so cial net work among “activ e users”, in this case, any one 0.0 0.5 1.0 1.5 2.0 2.5 3.0 3.5 0 5. ´ 10 - 7 1. ´ 10 - 6 1.5 ´ 10 - 6 2. ´ 10 - 6 2.5 ´ 10 - 6 3. ´ 10 - 6 Γ Μ Information Transfer FIG. 7: Information transfer b et ween pairs of no des for v ary- ing γ /µ with T = 500 days. The blac k line corresponds to the mean information transfer for a given γ /µ and the shaded re- gion denotes the standard deviation after 100 trials. who tw eeted a URL in the three week collection p eriod. The data we used was collected in the fall of 2010 [6]. The dataset included about 70 thousand distinct URLs, 3.5 million tw eets, and 800 thousand users. W e further filtered our results to “very active” users, namely , users who t w eeted at least 10 URLs during this time p eriod. Before w e can calculate transfer entrop y as presented in Eq. 2, w e need to sp ecify the relev ant bin widths. W e tak e the finest resolution to b e δ 0 = 1 second, the same resolution as presen ted b y the Twitter API. F or binning of the history , w e used distribution of observed re-tw eet resp onse times to motiv ate a choice of δ 1 = 10 min , δ 2 = 2 hours , δ 3 = 24 hours. Although we sa w a long tail of re-t w eet times stretc hing in to days, our data w ere insuffi- cien t to include this weak effect. By limiting ourselves to only three bins, w e only hav e to sample o v er 8 p ossible histories. Note that the activity is for any t weeting of URLs; our calculations do not make use of the informa- tion enco ded in the URL. W e then calculate the transfer en trop y b et ween each pair of users who are connected. The re sult of this pro cedure is the construction of a directed, weigh ted graph, where each edge in the original directed graph is no w lab eled by the calculated transfer en trop y . W e can no w compare standard measures of in- fluence to measures based on this weigh ted graph. The simplest measure of influence on static graphs is to count the num b er of follow ers a user has. This ignores the fact that not all follo w ers are the same, nor do follow ers re- act in the same w a y to different p eople that they follow. F or instance, it may b e that a recommendation from a close friend is worth more to a person than the same recommendation from five acquaintances. This problem is only exacerbated by the recent emergence of “follow- ers for pa y” services, which seek to artificially inflate the n um b er of follow ers to you r Twitter accoun t. In Fig. 8, w e explore the comparison b etw een out degree and trans- fer entrop y and we find that although on a v erage p eople with more follow ers ha v e more transfer entrop y , tw o p eo- ple with the s ame num b er of follow ers ma y hav e v astly differen t influence as measured by transfer entrop y . T o verify that transfer en tropy is a meaningful quan- tit y , we could test ho w well the transfer entrop y , based 6 FIG. 8: F or each user, we compare the num b er of their fol- lo wers to their cumulativ e outgoing transfer entrop y . Note that the outgoing transfer en trop y ma y differ b y an order of magnitude for p eople with the same n um b er of follow ers. only on the timing of activity , matches the measured flow of information, as determined by tracing sp ecific URLs. T o that end, for each pair of connected users, X → Y , w e count ho w many sp ecific URLs were first tw eeted b y X and then subsequently re-tw eeted by Y . This num- b er is compared to the transfer entrop y in Fig. 9. The existence of ev en a w eak correlation is surprising consid- ering the limited amoun t of data and the fact the transfer en trop y is not making use of URL or re-tw eet informa- tion at all. W e also note that while a high num b er of re-t w eets implies high information transfer, a lo w num- b er of re-tw eets is uncorrelated with information transfer. This makes sense b ecause information transfer measures influence that is not necessarily in the form of re-tw eets; w e will giv e some examples b elo w. FIG. 9: The num b er of URLs that were first tw eeted by user X and subsequently tw eeted by X’s follo w er, Y, is correlated with the calculated transfer entrop y b et ween X and Y, even though transfer entrop y is calculated only from the timing of activit y , without regard for specific URLs. Pearson’s correla- tion co efficien t is 0.22. T able I sho ws the edges with the highest information transfer. These accounts are all solely for the purp ose of promotion. T aking the top example, for instance, reveals that these tw o accoun ts will tw eet exactly the same mes- sage within a few seconds of eac h other. Note that in the text of their tw eets neither account uses re-tw eets or an “@” for attribution. Twitter sp ecifically forbids indis- criminate automatic re-tw eets and has a p olicy against duplicate accounts. Many of the accounts on this list ha v e since been banned by Twitter. User F ollow er I.T.( · 10 − 6 ) F ree2BurnMusic F ree2Burn 4328 Earn Cash T o da y income ideas 1159 BuzTw eet com scate 1006 F ree2Burn F ree2BurnMusic 939 Kamagra drug2 sogradrug3 929 sougolinkjp sogolinksite 903 k cal bot FF k cal bot 902 nr1topforex nr1forexmoney 795 wpthemew orld wpthememark et 709 viagrakusurida viagrakusuride 679 Bo ogieF onzareli Nyce Hunnies 668 A tango k obuntango 662 Kamagra drug2 sogra drug3 638 dti affiliate k ekkonjy oho 630 Best of Deals Orbilo ok SMI 621 viagrakusurida k amagra 100mg3 561 k cal bot F amily Mart 542 k amagra 100mg3 viagrakusuride 535 viagra drug baiagura drug 532 k cal bot Sev en Elev en 530 T ABLE I: List of edges with highest information transfer. All are promotion accounts and many of the accoun ts hav e been banned since the data were collected. T o see more complex examples, we restrict ourselves to the top 1000 edges according to information trans- fer. Then we lo ok at the largest connected comp o- nen ts. The largest comp onent inv olved 600 users in Brazil, most of whom had multiple tw eets of the form “BOMBE O SEU TWITTER, COM MILHARES DE NO V OS F OLLO WERS, A TRA VES DO SITE: http://? #QueroSeguidores”, where “?” was a frequen tly c hang- ing URL. Google translates this as “Pump up y our Twit- ter, get thousands of new follo wers, link to this site: h ttp://? #IW antF ollow ers.” Clic king on some of these links suggests that this a “follo wback” service. Y ou agree to follo w previous users who ha ve signed up and in return other users of the service follow your accoun t. It also ap- p ears from the text that y ou are required to re-tw eet the link to get your follow ers. Some other examples of high information transfer clusters are shown in Fig. 10. W e consider another adv an tage of measuring influence through information transfer b y lo oking at tw o users who had almost the same outgoing transfer en trop y ( ∼ 0 . 025, in the top 20 for individuals in our dataset), but v astly differen t b ehavior of follo w ers. The first Twitter ac- coun t is SouljaBoy , a prominent American rapp er who is also very activ e in so cial media. The second account is “silv a marina”, the Twitter account of Marina Silv a, a p opular Brazilian p olitician. This data was taken dur- ing the run up to the Brazilian presidential election, in whic h Marina Silv a was a candidate; she received 19 . 4% of the popular vote. At first it seems surprising that the SouljaBo y , who has six times the follo wers, should ha v e a similar outgoing transfer entrop y to a politician kno wn mostly in one coun try and with fewer than a mil- 7 (a) (b) (c) FIG. 10: (a) This cluster appears to b e non-automated, and rev olves around fandom of singer Justin Bieb er. (b) The clus- ter of drug spam accoun ts. (c) An account which aggregates so ccer news by follo wing and re-tw eeting different regional so ccer accounts. lion Twitter follow ers. On the other hand, Fig. 11 re- v eals the reason for this disparity . Marina Silv a may ha v e few er follow ers, but her effect on them tended to b e m uc h stronger. Marina Silv a’s activit y tended to b e a b etter predictor of her follo wers’ b eha vior than Soulja Bo y’s activit y w as for his follow ers. 0 0.00001 0.00002 0.00003 0.00004 0.0 0.2 0.4 0.6 0.8 I.T. to a single follower Probability SouljaBoy silva_marina FIG. 11: A histogram sho wing the probability distribution of outgoing transfer en tropy for follow ers of t w o different Twitter accoun ts. The strength of Marina Silv a’s influence along with the serendipitous timing b efore the Brazilian elections sug- gests another intriguing p ossibility . It seems likely that not only do es transfer en tropy v ary for differen t follo w- ers, it ma y v ary ov er time as well. This suggests that a dynamic estimate of information transfer could detect c hanges in the imp ortance of individuals in the netw ork. IV. DISCUSSION W e hav e presented a nov el information–theoretic ap- proac h for measuring influence. In con trast to previous studied that fo cused on aggregate measures of influence, the transfer entrop y used here allows us to characterize and quantify the causal information flow for an y pair of users. F or a small n umber of users, this can allow us to reconstruct the netw ork of connections from user activit y alone. F or large net works, this allows us to identify the most important links in the netw ork. The metho d used here for calculating information transfer did not require an y explicit causal kno wledge in the form of re-tw eets or other textual information. On the one hand, this ma y b e an adv antage in situations where suc h information is either missing or misleading, as was the case in the example for mark eters on Twit- ter. On the other hand, we ma y be neglecting v aluable information, and in the future we would lik e to incorp o- rate textual information in more sophisticated wa ys but still within an information–theoretic approach. Although this should b e straightforw ard in principle, in practice en trop y based approaches require large amounts of data. More complex signals require a commensurate increase in data. Therefore, the other main thrust of future work should b e tow ards reducing data required for entrop y es- timation, either through b etter bias correction or through binless approac hes[17]. Because this measure has a rigorous in terpretation in terms of predictabilit y , it allows us to easily understand results that migh t otherwise seem anomalous. F or in- stance, in one example we found that Marina Silv a, the Brazilian presidential candidate, had high information transfer both to and from a Brazilian news service. Nei- ther Twitter accoun t ever retw eeted or explicitly men- tioned a tw eet of the other. Ho wev er, there was an ex- ternal cause, the up coming debates and elections, that explains b oth of their activities. Without kno wing this external cause, it is entirely consistent to say that either user’s activit y could help y ou predict the others. In fact, it ma y b e possible to use this bi-directional predictability to iden tify external causes in the first place. Another result that is easy to understand in the con- text of predictabilit y is the high incidence of “spam” in our results. This is no surprise since a large amount of spam is pro duced b y automated systems and these sys- tems are intrinsically v ery predictable. Although identi- fying spam is a natural application of our analysis, some h uman behavior sto o d out as well. Diehard fandom also 8 leads to quite predictable b ehavior. Man y existing notions of influence are static, ill- defined, ad ho c, or only apply in aggregate. Information transfer is a rigorously defined, dynamic measure capable of capturing fine-grain notions of influence and admitting a straigh tforw ard predictiv e in terpretation. Many of the mathematical techniques necessary ha ve already been de- v elop ed in the neuroscience literature and w e ha v e sho wn ho w to usefully adapt them to a so cial media context. Ac kno wledgmen ts W e w ould lik e to thank Armen Allahv erdyan for useful discussions. This research w as supp orted in part b y the National Science F oundation under gran t No. 0916534 and US AFOSR MURI grant No. F A9550-10-1-0569. [1] Eytan Bakshy , Jake M. Hofman, Winter A. Mason, and Duncan J. W atts. Every one’s an influencer: quantifying influence on twitter. In Pr o c. fourth ACM international c onfer ence on Web se arch and data mining , WSDM ’11, pages 65–74, New Y ork, NY, USA, 2011. A CM. [2] Alb ert-Laszlo Barab´ asi. The origin of bursts and heavy tails in human dynamics. Natur e , 435:207–211, May 2005. [3] Lionel Barnett, Adam B. Barrett, and Anil K. Seth. Granger causalit y and transfer entrop y are equiv alent for gaussian v ariables. Phys. R ev. L ett. , 103:238701, Dec 2009. [4] Claudio Castellano, San to F ortunato, and Vittorio Loreto. Statistical physics of so cial dynamics. R ev. Mo d. Phys. , 81(2):591–646, May 2009. [5] Meeyoung Cha, Hamed Haddadi, F abrcio Beneven uto, and Krishna P . Gummadi. Measuring user influence in t witter: The million follow er fallacy . In in ICWSM 10: Pr o ce e dings of international AAAI Confer enc e on We- blo gs and So cial , 2010. [6] Rumi Ghosh and Kristina Lerman. Predicting influential users in online so cial netw orks. In Pr o c. KDD workshop on Social Network A nalysis (SNAKDD) , Ma y 2010. [7] Boris Gourevitch and Jos J Eggermon t. Ev aluating in- formation transfer betw een auditory cortical neurons. J Neur ophysiol , 97(3):2533–43, 2007. [8] Glen Jeh and Jennifer Widom. Scaling p ersonalized web searc h. In Pr o c e e dings of the 12th international c onfer- enc e on World Wide Web , WWW ’03, pages 271–279, New Y ork, NY, USA, 2003. ACM. [9] Haewoon Kwak, Changhyun Lee, Hosung Park, and Sue Mo on. What is t witter, a so cial netw ork or a news media? In Pr o c e edings of the 19th international c onfer enc e on World wide web , WWW ’10, pages 591–600, New Y ork, NY, USA, 2010. ACM. [10] Y osihiko Ogata. Seismicit y analysis through p oint- pro cess mo deling: A review. Pur e appl. ge ophys. , 155:471–507, 1999. [11] Lawrence P age, Sergey Brin, Ra jeev Motw ani, and T erry Winograd. The PageRank Citation Ranking: Bringing Order to the W eb. T echnical rep ort, Stanford Digital Library T echnologies Pro ject, 1998. [12] S. Panzeri and A. T reves. Analytical estimates of limited sampling biases in different information measures. Net- work: Computation in Neur al Systems , 7:87–107, 1996. [13] Stefano P anzeri, Riccardo Senatore, Marcelo A. Mon te- m urro, and Rasm us S. P etersen. Correcting for the sam- pling bias problem in spike train information measures. Journal of Neur ophysiolo gy , 98(3):1064–1072, 2007. [14] Daniel M. Romero, W o jciec h Galuba, Sitaram Asur, and Bernardo A. Hub erman. Influence and passivity in so cial media. So cial Scienc e R ese ar ch Network Working Pap er Series , August 2010. [15] Thomas Sc hreib er. Measuring information transfer. Phys. Rev. L ett. , 85(2):461–464, Jul 2000. [16] Greg V er Steeg and Aram Galst y an. Information transfer in so cial media. In Workshop on Information Networks , Stern School of Business, New Y ork Universit y , 2011. [17] Jonathan D. Victor. Approaches to information-theoretic analysis of neural activit y . Biolo gic al The ory , 1(3):302– 316, 2006.
Original Paper
Loading high-quality paper...
Comments & Academic Discussion
Loading comments...
Leave a Comment