Identifying relationships between drugs and medical conditions: winning experience in the Challenge 2 of the OMOP 2010 Cup
There is a growing interest in using a longitudinal observational databases to detect drug safety signal. In this paper we present a novel method, which we used online during the OMOP Cup. We consider homogeneous ensembling, which is based on random …
Authors: Vladimir Nikulin
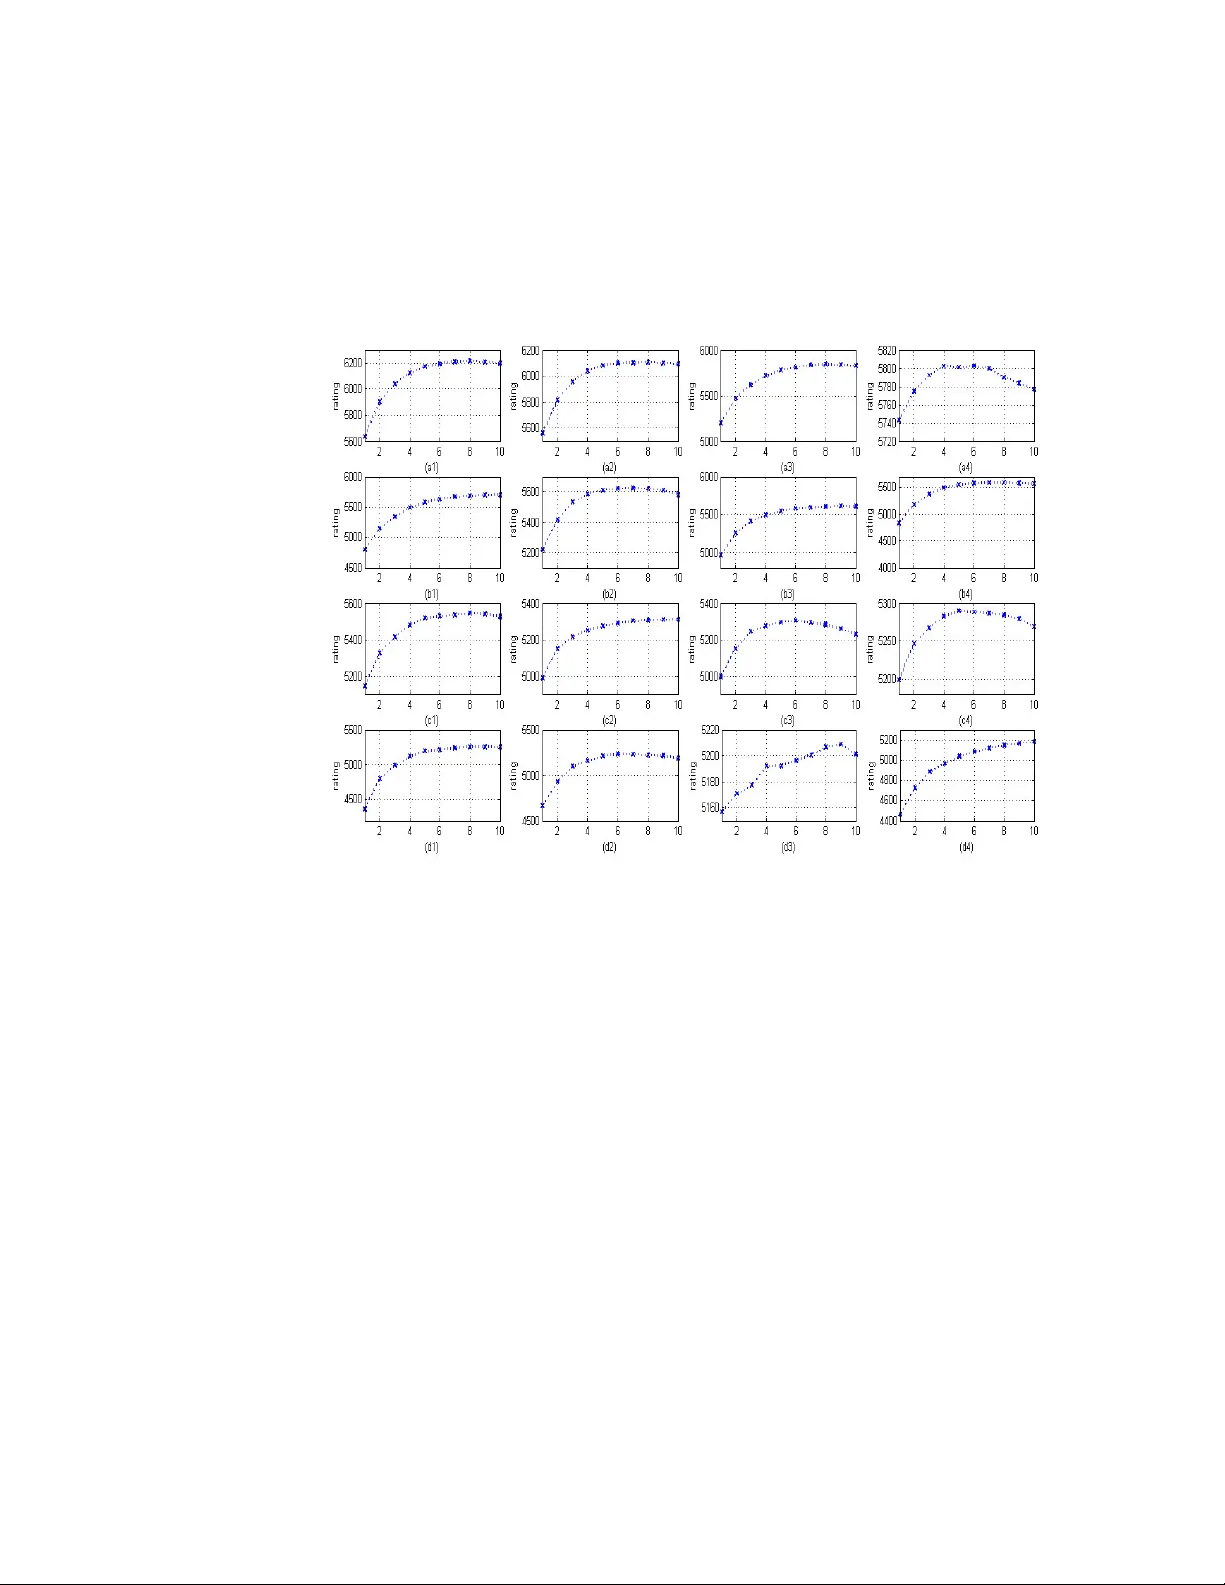
Identifying rel ations hips b etween drugs and medical condit ions: winning experien ce in the Chal lenge 2 of t he OMOP 2010 Cup Vladimir Nikulin # Department of Mathematical Methods in Economics, Vyatka State University, Kirov, Russia Abstract There is a growing interest i n using a longitudinal obser vational databases to dete ct drug safety signal. In t his paper we pres ent a novel method, which we used online during the OMOP Cup. We consider homogeneous ensem bling, which is based on random r e-sam pling (known, also, as bagging ) as a main innovation compared to the previous publi cations in the related fi eld. T his study is base d on a very large si mulated database of the 10 million patients recor ds, which was created by the Observational Medica l Outcomes Partne rship ( OMOP). Compared to the traditi onal classificat ion problem, the given data are unlabelled. The obj ective of this study is to discover hidden associations between drugs and conditions. The main idea of the approach, which we used during the OMOP Cup i s t o compare the numbers of observed and expect ed patter ns. This comparison may be organised in several di fferent ways, and the outcomes (base learners ) may be quite diff erent as well. It is proposed to construc t the final decision function as an ensemble of the base learne rs. Our method was re cognised formally by the Organisers of t he OMOP Cup as a top performing m ethod for the Chall enge N2. Keyw ords: l ongitudinal observational data, signal detection, temporal patte rn discovery, unsupervised learning, elect ronic health r ecords I NTRODUCTI ON An improvement of drug safe ty and the identif ication of adverse drug events remains a very important problem. Several recent dr ug safety events have highlighted the need f or new data sources and algorithms to assist in ident ifying adverse dr ug events in a more timely, effecti ve, and efficient manner. The m ethods and statist ical tools used on large healthcare data sources (e.g ., administrative cl aims and elect ronic he alth r ecords) have been lacking and are not yet systematized to look at di sparate data bases. The Observational Medical Outcomes Part nership (OMOP) conducted a Cup Competition a s a c atalyst for new methods de velopm ent to identify relations hips in data bet ween drugs and adverse events or conditions (OMOP Newsletter , 2010). To pr ovide an obj ective bas is for monitoring and a ssessing the safety of marketed products, pharmaceutical companies and regulatory agencies have implemented post-marketing surveillance activities based in large measure on the collec tion of spontaneously generated adverse re action reports. Report init iation (by heal th professi onals and consumers) is generall y voluntary; by contrast, the pharmaceutical companies are generally under l egal obligation to follow up on report s tha t t hey receive and t o pass them al ong to various regulatory authorit ies (Fram et al., 2003). Every drug has unde rgone extensive t esting before being rel eased to the mark et, but even pre-m arketing cli nical tria ls involving thousands of peopl e cannot uncover all adverse events that may occur in a much larger and diverse populati on. Tradi tionally, post-marketing safet y signal # vnikulin .uq@gm ail.com Identifyin g relationships between drugs and m edical conditions 2 detection has rel ied on voluntar y, spontaneous repor ting of suspect ed adverse drug reactions by health ca re profess ionals, pat ients, and consum ers (Schuemie, 2010). There is a global inter est in using electronic health r ecords for act ive drug safety surveilla nce. Many methods have been developed and exploited for quantitative si gnal det ection in spontane ous r eporting data bases, most of these are based on dis proportionali ty m ethods of case reports. A ful l safety profile of a new drug ca n never be known at the time that it i s intr oduced to the general public. Wherea s premarketing clini cal tri als do consi der safety endpoint s, they are limited in the types and numbers of patients exposed. Act ual clinical practice often differs from the controlled setting of a clini cal trial, with respect to the indication for tr eatment, concomitant medication, and dosag e at which a drug is prescr ibed. Also, it m ay dif fer ov er time. As a consequence, safety monitoring and evaluation m ust continue t hroughout a drug’s life-cycle (Norén et al., 2009). In thi s paper we would like to share our succ essful experience, which was obta ined online during the O MOP 2010 Cup. Also, we would like to direct r eaders to some selected publications (Nikulin, 2008), ( Nikulin and McLachla n, 2010) and ( Nikulin et al., 2011), where we reported our s uccessful models a nd methods, which wer e used duri ng differ ent data mining Challenges. OMOP CHAL LENG E OMOP is a publi c-private par tnership des igned to improve t he monitoring of drugs for safety and effecti veness. The partner ship is conducting a two-y ear research initiat ive to determ ine whether it is feasible and usef ul to use automated healthcar e dat a to identify and evaluate s afety issues of dr ugs on the market. The Par tnership’s methodological re search is conduct ed across multiple disparate obser vational databases (administra tive claims and electronic health records). The ser ies of studies being conducted include as sessing differ ent types of automated healt hcare data, developing tools and methods t o analyze the databases , and evaluating how analyses can contribute t o decision-mak ing. OMOP relies on the expertise and resources of the U.S. Food and Drug Administrat ion, other federal agencies, academ ic institutions , the phar maceutical and heal th insurance industries and non- profit organiz ations. A network of instituti ons, managed by the Foundati on for the National Institute s of Healt h, car ries out specifi c OMOP tasks, a nd all t ogether, more than 100 partners are collabora ting. Thr oughout t he work phas es of OMOP all work product s are made publicly available to pr omote transparency and consistency in resear ch. The competition sta rted in September 2009. OMOP provided the participants with a large simulated data set r esembling healthcare da ta that was “spi ked” with adverse events. The competitors had to find the signals by generating methods t o identif y rel ationships i n the data between dr ugs and medical outcomes (adverse events). The goal was to develop methods that correctly identified true drug -ev ent associations while minim izing false positi ve findings. Methods wer e evaluated by how accurate ly they predict ed the known relati onships that exi sted in the data. At the end of the competition, which was closed on March 31, 2010, there were over sixty competitors from many fields and ent ities. OMOP database The given database includes records of 10 million patients with date s when observation was started and ended. The overall observation pe riod is 10 years. For any particular patient we Identifyin g relationships between drugs and m edical conditions 3 have 2 sequences: 1) drugs with starti ng and ending dates; 2) conditi ons with starti ng date. The total numbers of drugs and condit ions are 5,000 and 4,519, respectively. Accordingly, the total number of possi ble associati ons i s 22,595,000. The re a re a lso s ome demog raphical inf ormation available, such as age and sex. We sha ll denote by D and C sets of all drugs and conditions. As an illustr ation, the or ganisers made availabl e a small subs et of pair s {drug, conditi on} with true label (4000 positive and 3920 negative), but we did not use this i nformation i n the traini ng process. More details r egarding the databas e a nd t he Chal lenge may be found on the OMOP web- site * . Most of t he pre-processings were conducted using special software writt en in Perl, the main algorithms were implem ented in C. In addition, we used special codes written i n Matlab. DI SPROPORTIONAL I TY ANAL YSI S (DPA) In studying the te mporal associ ation be tween two e vents, it is convenient to let one event set the relative time frame in which the incide nce of t he other event is examined. We shal l in the context of this paper l et drug prescr iptions define t he r elative tim e f rame in which the incidence of other medical ev ents is exam ined. T he other medical events considered include notes of clinical symptom s, signs, and diagnoses, and pr escriptions of other drugs. Our object ive i s to identify inter esting temporal patterns relating the occurrence of a m edical event to first prescript ions of a specif ic drug (Norén et al., 2009). Let us denote by ∆ a thr eshold temporal par ameter (for exam ple it m ay be in the r ange of 30-60 day s). Then, we can c onsider the obser vation period T (for example, it may be the whole period of 10 years). We shall consider all the list ed pati ents and shal l compute dc n to be the numbers of associations/ cases, where , 0 ∆ ≤ − ≤ d c t t (1) c t and d t are the dates when condition c and drug d were start ed. As a next step, we count d n and c n to be the numbers of t he t imes drug d and condition c were found within the time interval T . Note that d n and c n were computed independently. Assuming that events are i ndependent, the expect ed number of associations m ay be calculated a ccording to the foll owing form ula , c d dc n b λ = (2) where . , ∈ = = D d d d d n N N n λ Finally, we shall compute required r atings , + + = α α dc dc dc b n f r (3) * http://omo p.fnih.o rg/omopcu p Identifyin g relationships between drugs and m edical conditions 4 where f is a logarit hmic or power functi on, α is a smoothing or shr inkage parameter. In our experiments we used . 5 . 0 1 . 0 ≤ ≤ α Mean average preci sion The perfor mance of the solutions was measured using the Mean A verage Pre cision (MAP), metric of ten used i n the fi eld of information retrieval. It measured how well a system ranks items, a nd emphasizes ranking tr ue posit ive items higher. It is the a verage of pr ecisions computed at t he point of each of the true positives in t he ranked list returned by the method (Schuemie, 2010). With the approach presented in this section we ac hieved result M AP = 0.12 for t he Challenge 1. TEMPORAL ANAL YSI S Most likely, the rati ngs (3) will be too rough if they are cal culated accor ding to the whole time- interval T of 10 years. There fore, it is proposed t o split t he whole inter val T into several consecutive subinter vals: , ,..., 1 , ) ( m i T i = and calculate , ,..., 1 , ) ( m i r i dc = accordi ngly. The m ost suitable value m = 10 , which corresponds to the number of years within the whole observation period. As an outcome, we can produce soluti on for Challenge 2 using ratings . ,..., 1 , ) ( m i r i dc = Challenge 2: ident ifying drug-condi tion associat ions as data accumulates over time Timely detection of drug-related adverse events as part of an active surveillance system would allow pat ients a nd health care providers to minimise potential ri sks and inform dec ision- mak ing authoriti es as qui ckly as possible. Challenge 2 s eeks to evaluate a method’s perfor mance in identifying true drug -condition associ ations and discerning from false associat ion as data accumulates over time. It is important to mention that a n as sociation is defined as a drug that i ncreases the likelihood of a condition occurr ing. A condition t hat is less likely to occur after rece iving a drug, possibly, as an intent ional result of a treat ment, is not counted as an associ ation. For the second chall enge, it was ne cessary to exa mine the first 500 drugs m ore closely. As requested, subm issions shoul d contain one ent ry for each such dr ug- condition combination at the end of each of 10 c alendar years, resul ting in 10 t imes 500 t imes 4519 ( 22,595,000) tot al records. That means, the size of all possible combinations for Chal lenge 2 was exact ly the same as for Challenge 1. We calculat ed solution for Challenge 2 according to the formula , 10 ,..., 1 , 1 1 ) ( ) ( = = = year r year s year i i dc year dc (4) and observed MAP = 0.13 . Also, we considered ) 10 ( dc s in applicat ion to Challenge 1 with MAP = 0.14 . Figure 1 illustra tes behaviour of the 16 sel ected (str ongest relations) pairs {d, c}, which are presented in T able 1. Identifyin g relationships between drugs and m edical conditions 5 RANDOM RESAMPL I NG (BAG GI NG OR HOMOGENEO US ENSEMBL I NG) Bagg ing predi ctors is a m ethod f or generat ing multiple v ersions of a predictor and using these to get an aggregated predic tor. The aggregation averages over t he versi ons when predi cting a numerical outc ome and does a pl urality vote when pr edicting a cl ass (Brei man, 1996). In this section we consider method of random resampling: it is suppose d t hat using the hundreds of predictors (bas e le arners), ba sed on the randomly selected subs ets of the whole training set , we shall reduce t he random fa ctors. According to the pr inciples of homog eneous ensembling, the final predic tor represents an average of the base predictors . As a reference, we m ention random forests ( Breiman, 2001) i s a well-known exam ple of succ essful homog eneous ens emble. However, the construction of random forests is based on anot her m ethod, which i s linked to the features but not to the samples. With the method of r andom resampling we were able to a chieve a dr amatic improvem ent in performance: MAP=0.21 for Chall enge 1 and MAP=0.18 for Challenge 2. The rati ngs for Challenge 2 were calculate d according to the foll owing formula , 10 ,..., 1 , ) ( 1 1 ) ( ) ( = = = year j s k z k j year dc year dc (5) where j is a sequent ial index of t he randomly selected j Ω subset of patients, and, by definit ion, it is assumed that computation of ) ( ) ( j s year dc was based on j Ω . Table 1: List of 16 strongest (ac cording to our evaluation) relations between drugs and conditions, w here ratings were com puted according to (4). Colum n “Figure 1” indicate s hori zontal label of the window in Figure 1, where this time- series of the corresponding rela tionship is pr esented. N Figure 1 Drug Condition Rating 1 a1 198 4017 6214.97 2 a2 199 4018 6105.93 3 a3 80 4011 5843.94 4 a4 3 4002 5802.4 5 b1 314 4025 5700.24 6 b2 137 4013 5623.87 7 b3 362 3509 5613.11 8 b4 437 4039 5585.65 9 c 1 2 4002 5543.93 10 c2 471 1996 5311.32 11 c3 318 4027 5302.99 12 c4 251 4020 5289.66 13 d1 79 4011 5256.8 14 d2 339 4032 5233.38 15 d3 198 1280 5208.57 16 d4 3 1377 5179.46 Identifyin g relationships between drugs and m edical conditions 6 Selection of the pat ients was conducted accordi ng to the condit ion: 65 . 0 ≤ γ , wher e γ i s a standard unifor mly di stributed random variable. Based on our experiments, the number of random samples k=100 is a quite suf ficient. In addition, we decided to extend the random sampling fur ther, and used as a threshol d param eter ∆ in (1) unif ormly distribut ed random variable: . 60 40 ≤ ∆ ≤ Figure 1. T emporal dependence s ( ratings as a function of the years) for the selected pairs {drugs, conditions}, which ar e presented in T able 1. Note that we used soluti on ) 10 ( dc z f or Challenge 1. Figure 2( a) il lustrates the structure /histogram of the solution ) 10 ( dc z , which was reduced to the logarithmic scale, where we used only dr ugs with indexe s from 1 to 500 (t his corresponds t o Challenge 2). In accordance with Figure 2(a) , an absolute majority of the pai rs {d, c} has no expect ed relat ions. Figure 2(b) shows histogram of the right part of the s olution present ed in Figure 2(a) with some potentia l links. DPA: A SECOND APPROACH BASED ON THE DRUG ERAS Compared to the fir st approach of DPA , we shall use her e not a counter of the number of times when drug was used, but the total durat ion in days when drug was used. Let us denote by d h the total durati on of the time when drug d was used during observational peri od T . Then, we can rewrite (2) in this way , c d dc n b θ = (6) Identifyin g relationships between drugs and m edical conditions 7 where . , ∈ = = D d d d d h H H h θ Remark 1. Based on our experi mental eval uations, there i s a significant di fference between formulas (2) and (6) in te rms of t he related outcomes. The formulas (2) and (6) are similar in the structural sense, and represent the most important ini tial steps. The foll owing s teps to construct solution for t his parti cular method are t he same: we can apply (6) to (3). Then, we can repeat the temporal analysis (4) and resampling (5). As an outcome of thi s modified procedure we had observed the score s: MAP = 0.225 for Challenge 1 and MAP = 0.205 for Challenge 2. Figure 2. (a) hist ogram of t he sol ution ) 10 ( dc z , which is def ined in (5); ( b) histogram of the right part of the solution ) 10 ( dc z (with potent ial l inks between drugs and conditions) ; (c) function w for the temporal weighting. HETEROGENEOU S ENSEMBL I NG Definit ion. An ensemble is define d as a heterogene ous if the base models in an ensemble are generated by methodologically different learning algorithms. On the other hand, an ensemble is defined as a homogeneous if the base models are of the same type (for example, resampling or bagging as discussed abov e). As far as solutions DPA1 and DPA2 , which are ba sed on expect ed numbers of associati ons (2) and (6), are very dif ferent i n a str uctural s ense, they cannot be l inked together directly. At the same time we know that the qual ities of both solutions DPA1 and DPA2 are high. The la ter obser vation represent s a very positi ve factor, which indicat es that the solutions DPA1 Identifyin g relationships between drugs and m edical conditions 8 and DPA2 contains differ ent infor mation, which may lead to further improvement if linked in a proper way. Using an ensemble c onstructor (Nikulin and McLachl an, 2009), we can adj ust one solution to the scale of another solution. After that, we can com pute an ensemble solution as a linear combination: , 2 ) 1 ( 1 DPA DPA ENS ⋅ − + ⋅ = τ τ (7) where 1 DPA is the same as DPA1 sol ution, which was adjuste d to the scale of DPA2 solution, 1 0 < < τ is a positi ve weight coefficient. Clearl y, the stronger performance of the solution DPA2 compared to DPA1 the smaller will be value of the coeff icient τ . With an ense mble const ructor (7) , we observed MAP=0.23 for Chall enge 1 and MAP=0.22 for Challenge 2, where we used τ = 0.3 . TEMPORAL WEIG HTI NG FOR COMPUTATI ON OF THE NUMBERS OF ASSOCIA TI ONS According to (3), the value of dc n is a v ery important. Clearl y, t he strength of the si gnal depends ess entially on the di fference d c t t − , subj ect t o the condition (1). Base d on our stati stical analysis (and, also, on some qualitative considerati ons), we decided to implement the following formula ( ) , ∆ + ≤ ≤ − = d c d t t t d c dc t t w n (8) where the structure of weight function w is i llustrat ed in Figure 2(c): it is logical to assume that reaction of the patient’s organism t o drug i s not an im mediate, and the likelihood of the pos sible associati on will decline over ti me after some point (6-10 day s). COMPUTATI ON TI ME A Linux multiproc essor computer with speed 3.2GHz, RAM 16GB, was used for the most of the computations. All the algorithms were implem ented in C. The running time for 100 random sam plings according to (5) was about 10 hours. CONCL UDI NG REMARKS As a main out come of our study, we can report very strong improvem ent with homog eneous ensembling (bagg ing). Also, we were t rying to different iate the matrices (5) for the particul ar age/sex groups, and then create submission a ssuming that the different age/sex g roups are equal ly important. However, we did not observe any significant improvem ents with this appr oach. During the Challenge we conducted experi ments with many different methods and approaches, which were not mentioned in the above Secti ons. For e xample, we tried 2D k-means clusteri ng (Nikulin and McLachlan, 2009) and gradient -based matrix factor isation (Nikulin et al., 2011) in applicati on to the matrix (5) in order to smooth the noise, and can re port some modest progress in this di rection. Identifyin g relationships between drugs and m edical conditions 9 There may be several conse cutive eras of one drug for the s ame pati ent. We achie ved good im provements in the case if we use only fir st drug era, and ignore all the other eras. As t o t he pr ospective work: ass uming that there are tr ue r elations for any drug/condition, it maybe a good i dea to calibrat e the matrix (5) so tha t the most “shiny” drugs/conditions wil l not outshine the ot her drugs/conditions. According t o (J elizarow et al., 2010) , the superiori ty of new algorithms should a lways be demonstrated on an independent validation data. I n this sense, an importance of the dat a m ining contests is unquestionabl e. T he r apid popul arity growth of the data mining cha llenges demonstrates with confidence that it is the be st-k nown way to e valuate different models and systems. ACKNOWL EDGMENTS We are grateful to the Organisers of the OMOP 2010 data mining Contest f or this stimulating opportunity. REFERENCES Breiman L. (1996) Bagg ing Predictors. Machi ne Learning , 24 , 123-140. Breiman L. (2001) Random Forests. Mac hine Learning , 45 , 5-32. Cho H. and Dhill on I. ( 2008) Cocluster ing of Human Cancer Microar rays Using Minimum Sum- Squared Residue Cocluster ing. IEEE/ACM Transacti ons on Computational Bi ology and Bioinformatics , 5 ( 3), 385-400. Fram D., Almenoff J . and DuMouchel W. (2003) Empirical Bayesian Data Mining f or Discovering Patt erns in Post-Marketing Drug Safety. SIGKDD 2003, August 24-27, Washington, DC, USA: 359- 368. Jeli zarow M., Guillemot V., Tenenhaus A., Strimmer K. and Boulesteix A.-L. (2010) Over- optimism in bioinformatics: an illus tration, Bioi nformatics , 26 (16), 1990-1998. Nikulin V. (2008) Classif ication of Imbalanced Data with Random Sets and Mean- Variance Filtering. International J ournal of Data Warehousing and Mining, Vol. 4 (2) , pp.63-78. Nikulin V. and McLachlan G. J . (2009) Classifi cation of imbalanced marketing data wit h balanced random sets. JMLR: Workshop and Conference Proceedi ngs , 7 , 89-100. Nikulin V. and McLachlan G.J. (2010) Identifying fiber bundles with regularised k- means clusteri ng applied t o the grid-based data. In WCCI 2010 I EEE World Congress on Computational Intelligence July, 18-23, 2010 - CCI B, Barcelona, Spain, pp. 2281-2288. Nikulin V., Huang T.-H., Ng S.-K., Rat hnayake S. and McLac hlan G. J. (2011) A Very Fas t Algorithm for Matrix Factori sation. Stati stics and Probabil ity Letter s , 81 , 773-782. Identifyin g relationships between drugs and m edical conditions 10 Nikulin V., Huang T.-H., and McLachlan G.J. (2011a) Clas sificati on of high-dim ensional microarray data with a two s teps procedur e via a Wi lcoxon criter ion and multilayer perceptron. International J ournal of Computational Intelligence and Applicati ons, 10(1), pp. 1-14. Norén G., Hopstadius J., Bate A., Star K. and Edwards I. (2009) Temporal pattern discovery in longitudinal elec tronic pati ent records. Data Mi ning and Knowledge Discovery . OMOP Newslet ter, June 2010, 2 (2). Available a t: http://omop.fni h.org/omopcup/ [Accessed on 28 July 2011]. Schuemie M. (2010) Methods for drug safety signal det ection in longitudinal observational databases: LGPS and LEOPARD. Pharmacoepidmiology and Drug Safety .
Original Paper
Loading high-quality paper...
Comments & Academic Discussion
Loading comments...
Leave a Comment