A new embedding quality assessment method for manifold learning
Manifold learning is a hot research topic in the field of computer science. A crucial issue with current manifold learning methods is that they lack a natural quantitative measure to assess the quality of learned embeddings, which greatly limits thei…
Authors: Peng Zhang, Yuanyuan Ren, Bo Zhang
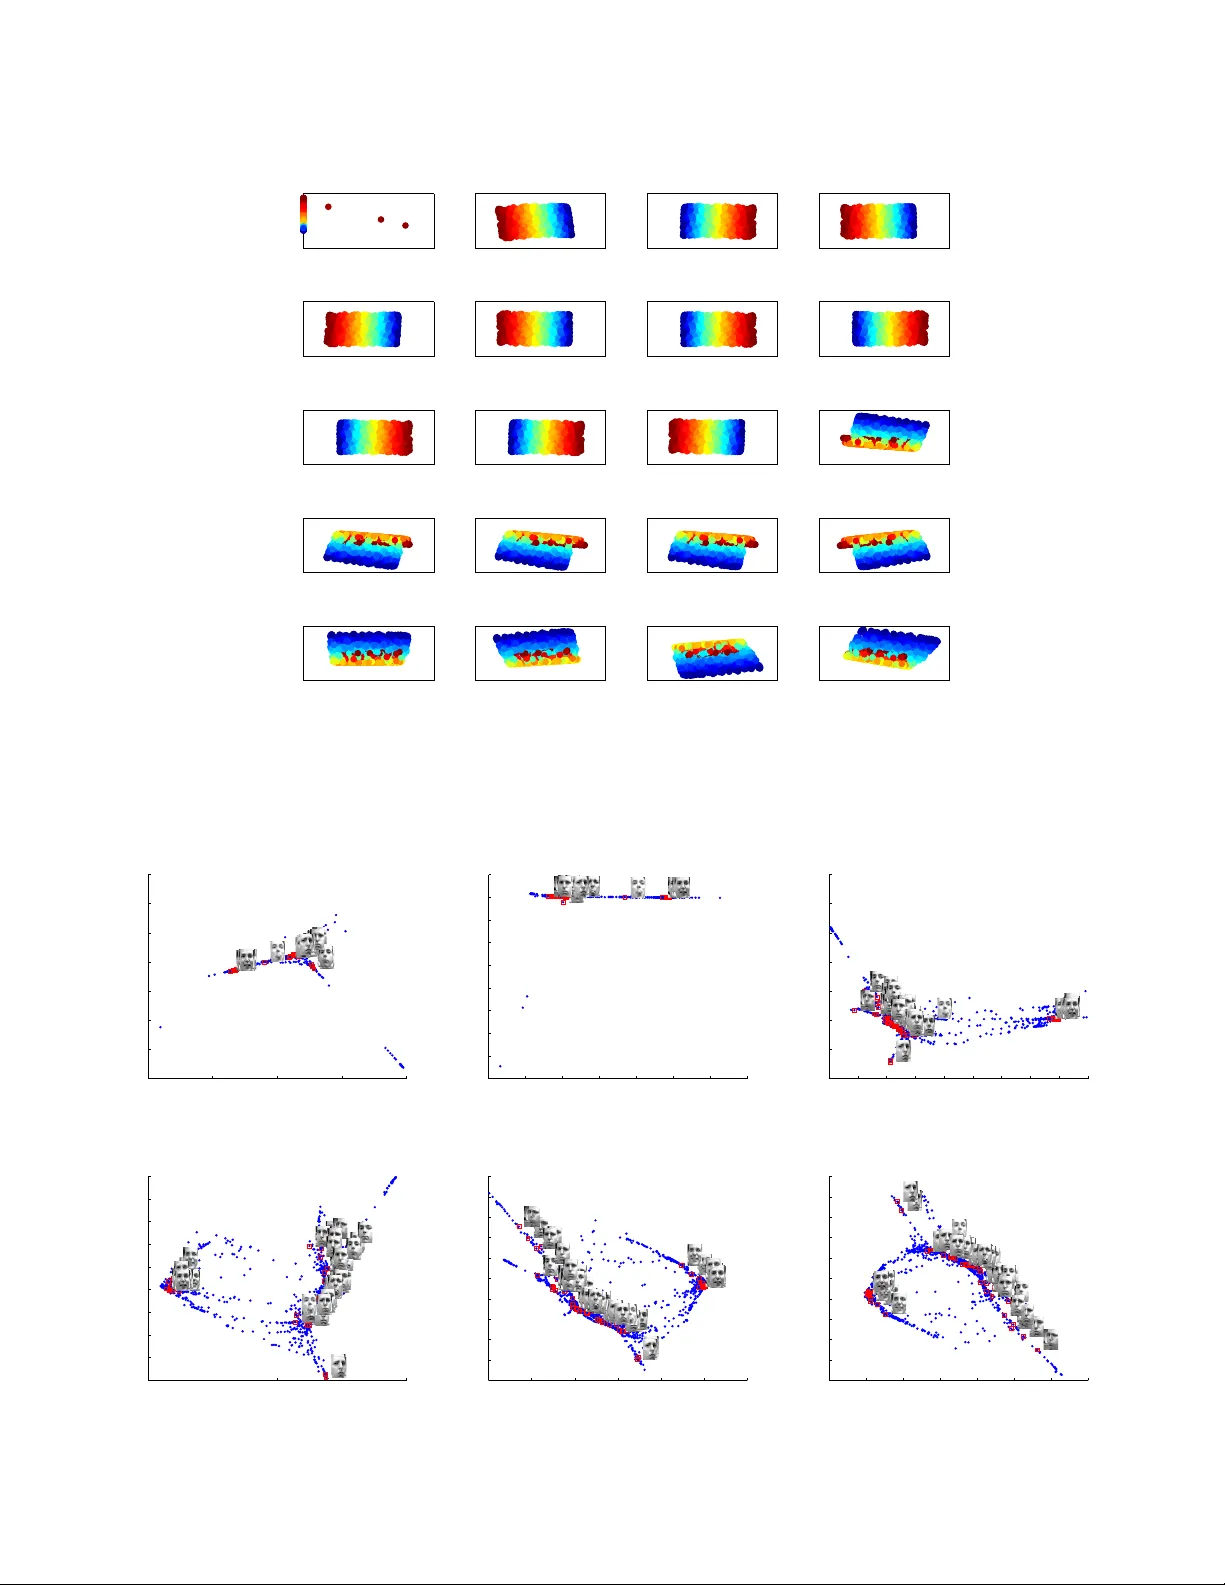
1 A new embedding quality assessment method f or manif old learning Peng Zhang Member , IEEE, Y uanyuan Ren, and Bo Zhang Abstract —Manifold learning is a hot research topic in the field of computer science. A crucial issue with current manif old learning methods is that they lack a natural quantitative measure to assess the quality of learned embeddings, which gr eatly limits their applications to real-world pr oblems. In this paper , a new embedding quality assessment method for manifold learning, named as Normalization Independent Embedding Quality Assess- ment (NIEQA), is proposed. Compared with curr ent assessment methods which are limited to isometric embeddings, the NIEQA method has a much lar ger application range due to two features. First, it is based on a new measure which can effecti vely evaluate how well local neighborhood geometry is preserv ed under normalization, hence it can be applied to both isometric and normalized embeddings. Second, it can provide both local and global e valuations to output an ov erall assessment. Theref ore, NIEQA can serve as a natural tool in model selection and evaluation tasks f or manif old learning . Experimental results on benchmark data sets validate the effectiv eness of the proposed method. Index T erms —Nonlinear Dimensionality reduction, Manifold learning, Data analysis I . I N T RO D U C T I O N A LONG with the adv ance of techniques to collect and store large sets of high-dimensional data, how to ef fi- ciently process such data issues a challenge for many fields in computer science, such as pattern recognition, visual under- standing and data mining. The key problem is caused by “the curse of dimensionality” [1], that is, in handling with such data the computational complexities of algorithms often go up exponentially with the dimension. The main approach to address this issue is to perform dimensionality reduction. Classical linear methods, such as Principal Component Analysis (PCA) [2], [3] and Multidi- mensional Scaling (MDS) [4], achiev e their success under the assumption that data lie in a linear subspace. Howe ver , such assumption may not usually hold and a more realistic assumption is that data lie on or close to a low-dimensional P . Zhang is with the Data Center, National Disaster Reduction Center of China, Beijing, P .R. China (e-mail: zhangpeng@ndrcc.gov .cn). Y . Ren is with the Career Center, Tsinghua University , Beijing, P .R. China. B. Zhang is with the LSEC and the Institute of Applied Mathematics, AMSS, Chinese Academy of Sciences, Beijing 100190, China. manifold embedded in the high-dimensional ambient space. Recently , many methods have been proposed to efficiently find meaningful lo w-dimensional embeddings from manifold- modeled data, and they form a family of dimensionality reduction methods called manifold learning . Representativ e methods include Locally Linear Embedding (LLE) [5], [6], ISOMAP [7], [8], Laplacian Eigenmap (LE) [9], [10], Hessian LLE (HLLE) [11], Diffusion Maps (DM) [12], [13], Local T angent Space Alignment (L TSA) [14], Maximum V ariance Unfolding (MVU) [15], and Riemannian Manifold Learning (RML) [16]. Manifold learning methods hav e dra wn great research inter - ests due to their nonlinear nature, simple intuition, and com- putational simplicity . They also hav e many successful appli- cations, such as motion detection [17], sample preprocessing [18], gait analysis [19], facial expression recognition [20], hyperspectral imagery processing [21], and visual tracking [22]. Despite the above success, a crucial issue with current manifold learning methods is that they lack a natural measure to assess the quality of learned embeddings. In supervised learning tasks such as classification, the classification rate can be directly obtained through label information and used as a natural tool to ev aluate the performance of the classifier . Ho w- ev er, manifold learning methods are fully unsupervised and the intrinsic degrees of freedom underlying high-dimensional data are unknown. Therefore, after training process, we can not directly assess the quality of the learned embedding. As a consequence, model selection and model e v aluation are infeasible. Although visual inspection on the embedding may be an intuiti ve and qualitativ e assessment, it can not provide a quantitativ e ev aluation. Moreov er , it can not be used for embeddings whose dimensions are larger than three. Recently , sev eral approaches ha ve been proposed to address the issue of embedding quality assessment for manifold learn- ing, which can be cast into tow cate gories by their motiv ations. • Methods based on ev aluating ho w well the rank of neigh- bor samples, according to pairwise Euclidean distances, is preserved within each local neighborhood. • Methods based on ev aluating ho w well each local neigh- 2 borhood matches its corresponding embedding under rigid motion. These methods are pro ved to be useful to isometric manifold learning methods, such as ISOMAP and RML. Ho we ver , a large variety of manifold learning methods output normalized embeddings, such as LLE, HLLE, LE, L TSA and MVU, just to name a fe w . In these method, embeddings hav e unit v ariance up to a global scale factor . Then the distance rank of neighbor samples is disturbed in the embedding as pairwise Euclidean distances are no longer preserved. Meanwhile, anisotropic co- ordinate scaling caused by normalization can not be reco vered by rigid motion. As a consequence, existent methods would report false quality assessments for normalized embeddings. In this paper, we first propose a ne w measure, named Anisotropic Scaling Independent Measure (ASIM), which can efficiently compare the similarity between two configurations under rigid motion and anisotropic coordinate scaling. Then based on ASIM, we propose a novel embedding quality assess- ment method, named Normalization Independent Embedding Quality Assessment (NIEQA), which can efficiently assess the quality of normalized embeddings quantitati vely . The NIEQA method owns three characteristics. 1) NIEQA can be applied to both isometric and normalized embeddings. Since NIEQA uses ASIM to assess the sim- ilarity between patches in high-dimensional input space and their corresponding low-dimensional embeddings, the distortion caused by normalization can be eliminated. Then e ven if the aspect ratio of a learned embedding is scaled, NIEQA can still giv e faithful ev aluation of how well the geometric structure of data manifold is preserved. 2) NIEQA can provide both local and global assessments. NIEQA consists of two components for embedding quality assessment, a global one and a local one. The global assessment ev aluates ho w well the skeleton of a data manifold, represented by a set of landmark points, is preserved, while the local assessment e valuates ho w well local neighborhoods are preserved. Therefore, NIEQA can provide an o verall ev aluation. 3) NIEQA can serve as a natural tool for model selection and ev aluation tasks. Using NIEQA to provide quanti- tativ e e v aluations on learned embeddings, we can select optimal parameters for a specific method and compare the performance among dif ferent methods. In order to e v aluate the performance of NIEQA, we conduct a series of e xperiments on benchmark data sets, including both synthetic and real-world data. Experimental results on these data sets v alidate the effecti veness of the proposed method. T ABLE I M A IN N OTA T I O NS . R n n -dimensional Euclidean space where high-dimensional data samples lie R m m -dimensional Euclidean space, m < n , where low-dimensional embeddings lie x i The i -th data sample in R n , i = 1 , 2 , . . . , N X X = { x 1 , x 2 , . . . , x N } X X = [ x 1 x 2 · · · x N ] , n × N data matrix X i X i = { x i 1 , x i 2 , . . . , x i k } , local neighborhood of x i X i X i = [ x i 1 x i 2 · · · x i k ] , n × k data matrix N k ( x i ) The inde x set of the k nearest neighbors of x i in X y i low-dimensional embedding of x i , i = 1 , 2 , . . . , N Y Y = { y 1 , y 2 , . . . , y N } Y Y = [ y 1 y 2 · · · y N ] , m × N data matrix Y i Y i = { y i 1 , y i 2 , . . . , y i k } , lo w-dimensional embedding of X i Y i Y i = [ y i 1 y i 2 · · · y i k ] , m × k data matrix N k ( y i ) The inde x set of the k nearest neighbors of y i in Y e k e = [1 1 · · · 1] T , k dimensional column vector of all ones I k Identity matrix of size k k · k 2 L 2 norm for a vector k · k F Frobenius norm for a matrix The rest of the paper is organized as follows. A liter- ature revie w on related works is presented in Section II. The Anisotropic Scaling Independent Measure (ASIM) is described in Section III. Then the Normalization Independent Embedding Quality Assessment (NIEQA) method is depicted in Section IV. Experimental results are reported in Section V. Some concluding remarks as well as outlooks for future research are gi ven in Section VI. I I . L I T E R A T U R E R E V I E W O N R E L A T E D W O R K S In this section, the current state-of-the-art on embedding quality assessment methods are re vie wed. For con venience and clarity of presentation, main notations used in this paper are summarized in T able I. Throughout the whole paper , all data samples are in the form of column vectors. The superscript of a data v ector is the index of its component. According to motiv ation and application range, existent embedding quality assessment methods can be categorized into two groups: local approaches and global approaches. Related works in the two categories are re viewed respectively as follows. A. Local appr oaches Goldberg and Ritov [23] proposed the Procrustes Measure (PM) that enables quantitative comparison of outputs of iso- metric manifold learning methods. For each X i and Y i , their method first uses Procrustes analysis [24]–[26] to find an 3 optimal rigid motion transformation, consisting of a rotation and a translation, after which Y i best matches X i . Then the local similarity is computed as L ( X i , Y i ) = k X j =1 k x i j − R y i j − b k 2 2 , where R and t are the optimal rotation matrix and translation vector , respectively . Finally , the assessment is is given by M P = 1 N N X i =1 L ( X i , Y i ) / k H k X i k 2 F , (1) where H k = I k − e k e T k . An M P close to zero suggests a faithful embedding. Re- ported experimental results sho w that the PM method provides good estimation of embedding quality for isometric methods such as ISOMAP . Howe ver , as pointed out by the authors, PM is not suitable for normalized embedding since the geometric structure of e very local neighborhood is distorted by normal- ization. Although a modified version of PM is proposed in [23], which eliminates global scaling of each neighborhood, it still can not address the issue of sperate scaling of coordinates in the lo w-dimensional embedding. Besides the PM method, a series of works follow the line that a faithful embedding would yield a high degree of ov erlap between the neighbor sets of a data sample and of its corre- sponding embedding. Se veral works are proposed by using different w ays to define the overlap degree. A representati ve one is the LC meta-criteria (LCMC) proposed by Chen and Buja [27], [28], which can serve as a diagnostic tool for measuring local adequac y of learned embedding. The LCMC assessment is defined as the sum of local o verlap degree and giv en by M LC = 1 k N N X i =1 |N k ( x i ) ∩ N k ( y i ) | . (2) V enna and Kaski [29] proposed an assessment method which consists of two measures, one for trustworthiness and one for continuity , based on the change of indices of neighbor samples in R n and R m according to pairwise Euclidean distances, respectively . Aguirre et al .proposed an alternative approach for quantifying the embedding quality , by evaluating the possible overlaps in the lo w-dimensional embedding. Their assessment is used for automatic choice of the number of nearest neighbors for LLE [30] and also exploited in [31] to ev aluate the embedding quality of LLE with optimal regu- larization parameter . Akkucuk and Carroll [32] independently dev eloped the Agreement Rate (AR) metric which shares the same form to M LC . Based on AR, they suggested another useful assessment method called corrected agreement rate, by randomly reorganize the indices of data in Y . Also with AR, France and Carroll [33] proposed a method using the RAND index to ev aluate dimensionality reduction methods. Lee and V erleysen [34], [35] proposed a general frame- work, named co-ranking matrix, for rank-based criteria. The aforementioned methods, which are based on distance ranking of local neighborhoods, can all be cast into this unified framew ork. The block structure of the co-ranking matrix also provides an intuiti ve way to visualize the differences between distinct methods. In [36], the y further extended their w ork to circumvent the global scale dependency . The above assessments based on o verlap degrees of neigh- borhoods are implemented in the same way: an embedding with good quality corresponds to a high v alue of the assess- ment. They w ork well for isometric embeddings since pairwise distances within each neighborhood are preserved. Howe ver , when the embedding is normalized, the neighborhood structure is distorted since pairwise distances are no longer kept. The ov erlap degree would be much lower than expected even if the embedding is of high quality under visual inspection. B. Global appr oaches T enenbaum et al . [7] suggested to use the residual v ariance as a diagnostic measure to ev aluate the embedding quality . Giv en X and Y , the residual v ariance is computed by M RV = 1 − ρ 2 ( G X , D Y )) , (3) where ρ ( G X , D Y ) is the standard linear correlation coeffi- cients taken over all entries of G X and D Y . Here G X ( i, j ) is the approximated geodesic distance between x i and x j [7] and D Y ( i, j ) = k y i − y j k 2 . A low v alue of M RV close to zero indicates a good equality of the embedding. The M RV measure was applied to choose the dimension of learned embedding for ISOMAP [7] and the optimal parameter for LLE [37]. Nevertheless, for a normalized embedding the geodesic distances are no longer preserved and the reliability of M RV may decrease in such case. Doll ´ ar et al . [38] proposed a supervised method for model ev aluation problem of manifold learning. They assume that there is a very large ground truth data set containing the training data. Pairwise geodesic distances are approximated within this set using ISOMAP , and the assessment is defined as the average error between pairwise Euclidean distances in the embedding and corresponding geodesic distances. Howe ver , in real situations we do not usually ha ve such ground truth set and their assessment can not be used in general cases. Recently , Meng et al . proposed a new quality assessment criterion to encode both local-neighborhood-preserving and 4 global-structure-holding performances for manifold learning. In their method, a shortest path tree is first constructed from the k -NN neighborhood graph of training data. Then the global assessment is computed by using Spearman’ s rank order correlation coefficient defined on the rankings of branch lengths. Finally , the ov erall assessment is defined to be a linear combination of the global assessment and M LC . In their work, normalization is treated as a ne gative aspect in quality assessment, while our work is to define a new assessment which is independent of normalization. I I I . A S I M : A N I S OT R O P I C S C A L I N G I N D E P E N D E N T M E A S U R E In this section, we introduce a novel measure, named Anisotropic Scaling Independent Measure (ASIM), which can effecti vely ev aluate the similarity between tw o configurations under rigid motion and anisotropic coordinate scaling. A syn- thetic example is first giv en in Subsection III-A to demonstrate why existent assessments fail under normalization. Then the motiv ation and overall description of ASIM are presented in Subsection III-B. Finally , the computational details are stated in Subsection III-C. A. A synthetic e xample W e randomly generate 100 points within the area [ − 2 , 2] × [ − 1 , 1] in R 2 , which form the input data set X = { x 1 , x 2 , . . . , x 100 } . Next we normalize X to get output data Y such that Y Y T = I 2 , which are taken as the embedding of X . In fact, X can be obtained from Y through a rotation and anisotropic coordinate scaling, that is, X = RS Y where R = − 0 . 9991 0 . 0434 0 . 0434 0 . 0991 ! , S = 11 . 6414 0 0 5 . 6236 ! . In Fig. 1(a), x i , i = 1 , 2 , . . . , 100 are marked with blue dots and the 10 nearest neighbors of the origin in X are marked with blue circles. In Fig. 1(b), y i , i = 1 , 2 , . . . , 100 are marked with red dots and the 10 nearest neighbors of the origin in Y are marked with red squares. Meanwhile, the corresponding embeddings of the 10 nearest neighbors of the origin in X are marked with blue circles. From Fig. 1(b) we can see that the neighborhood of the origin change a lot after normalization. Only 6 nearest neighbors are still in the neighborhood after normalization and the overlap de gree is only 60%. Meanwhile, we also compute the Procrustes measure M P between X and Y and show it in Fig. 1(b). After normalization, M P is as high as 0.8054. Through this synthetic example, we can clearly observe the distortion on M P and local neighborhood ov erlap degree caused by normalization. −2.5 −2 −1.5 −1 −0.5 0 0.5 1 1.5 2 −1 −0.8 −0.6 −0.4 −0.2 0 0.2 0.4 0.6 0.8 1 (a) −0.2 −0.15 −0.1 −0.05 0 0.05 0.1 0.15 0.2 −0.2 −0.15 −0.1 −0.05 0 0.05 0.1 0.15 0.2 M P =0 . 8054 (b) Fig. 1. A synthetic example where existent assessments fail. (a) Input data X , marked by blue dots. (b) Normalized embedding Y , marked by red dots. Black filled square: the origin (0 , 0) T . Blue circles: the k nearest neighbors of the origin in X and their corresponding embeddings. Red squares: the k nearest neighbors of the origin in Y . B. Motivation and description of ASIM Since a manifold is a topological space which is locally equiv alent to a Euclidean subspace, an embedding would be faithful if it preserves the structure of local neighborhoods. Then we face a question that how to define the “preserv ation” of local neighborhood structure. Under the assumption that the data manifold is dense , each local neighborhood X i can be roughly viewed as a linear subspace embedded in the ambient space. Considering possible normalization on Y , a rational and reasonable choice is to define a ne w measure which can efficiently assess the simi- larity between X i and Y i under rigid motion and anisotropic coordinate scaling. Formally , for each index i , we assume that there exists a rigid motion and anisotropic coordinate scaling between X i and Y i . Since a rigid motion can be decomposed into a rotation 5 and a translation, then for an y x i j ∈ X i we assume that x i j = P i D i y i j + t i , (4) where P i ∈ R n × m is orthogonal, that is, P T i P i = I m . D i is a diagonal matrix of rank m and t i ∈ R n stands for an arbitrary translation. T o e valuate how similar X i and Y i are, our goal is to find optimal P ∗ i , D ∗ i and t ∗ i such that Y i best matches X i under Eq. (4). Equi valently , we need to solve the following constrained optimization problem min P k j =1 k x i j − P ∗ i D ∗ i y i j − t ∗ i k 2 2 s . t . P T i P i = I m D i ∈ D ( m ) , (5) where D ( m ) is the set of all diagonal matrices of rank m . Then the neighborhood “preservation” degree can be defined as the sum of squared distances between corresponding sam- ples in X i and Y i under the above transformation. F ormally , the anisotropic scaling independent measure (ASIM) is defined as follows M asim ( X i , Y i ) = k X j =1 k x i j − P ∗ i D ∗ i y i j − t ∗ i k 2 2 / k X j =1 k x i j k 2 2 , (6) or in matrix form M asim ( X i , Y i ) = k X i − P ∗ i D ∗ i Y i − t ∗ i e T k k 2 F / k X i k 2 F , (7) where the normalization item in denominator is introduced to eliminate arbitrary scaling. C. Computation of ASIM The optimization problem Eq. (5) does not admit a closed- form solution. Alternatively , we use gradient descent method to solve Eq. (5). Note that all n × m orthogonal matrices form the so-called Stiefel manifold, which is a Riemannian submanifold embedded in R nm . W e denote this manifold by S t ( n, m ) . Also note that D ( m ) is closed for matrix addition, multiplication and scalar multiplication, hence D ( m ) is homeomorphic to R m . Then Eq. (5) can be resolved by using gradient descent method over matrix manifolds. For con venience of presentation, we first introduce the δ operator [39], which is defined as follows Definition 1. When the δ operator is defined on a n - dimensional vector v = ( v 1 , v 2 , · · · , v n ) T , δ ( v ) ia a n × n diagonal matrix whose diagonal entries are just components of v , that is δ ( v ) = v 1 v 2 . . . v n . When the δ operator is defined on a n × n squar e matrix A = ( a ij ) , δ ( A ) is a n -dimensional vector formed by the diagonal entries of v , that is, δ ( A ) = ( a 11 , a 22 , · · · , a nn ) T . The δ operator can be compounded, which yields δ 2 ( v ) = v δ 2 ( A ) = a 11 a 22 . . . a nn . W ith the above notations, Eq. (5) now can be re written in matrix form as min P i ,D i ,t i k X i − P i D i Y i − t i e T k k 2 F s . t . P i ∈ S t ( n, m ) , D i ∈ D m . (8) Next, we solve Eq. (8) in three steps, which are described respectiv ely as follo ws. 1) Computation t ∗ i : Let L i = P i D i and note that for any matrix A , k A k 2 F = tr ( A T A ) . Then the objectiv e function can be written as f ( L i , t i ) = tr ( X i − L i Y i − t i e T k ) T ( X i − L i Y i − t i e T k ) . (9) By using the propositions of matrix trace Eq. (9) can be expanded as f ( L i , t i ) = tr ( X T i X i ) + tr ( Y T i L T i L i Y i ) − 2 tr ( Y i X T i L i ) + tr ( t i e T k e k t T i ) − 2 tr ( e T k X T i t i ) + tr ( e T k Y T i L T i t i ) . (10) T aking deriv ative with resect to t i yields ∂ f ( L i , t i ) ∂ t i = 2 k t i − 2 X i e k + 2 L i Y i t i . Since f ( L i , t i ) is a strict con vex function of t i , then by making both sides of the above equation to be zero, we can get the optimal solution to t i as follows t ∗ i = 1 k ( X i − P i D i Y i ) e k . (11) Substitute t ∗ i into Eq. (8), and the latter one is rewritten as min P i ,D i k ¯ X i − P i D i ¯ Y i k 2 F s . t . P i ∈ S t ( n, m ) , D i ∈ D m , (12) where ¯ X i = X i ( I k − 1 k e k e T k ) and ¯ Y i = Y i ( I k − 1 k e k e T k ) . 6 2) Computation of D ∗ i : In the second step, we compute the optimal solution D ∗ i to D i with respect to P i . Let A i = ¯ Y i ¯ Y i T and B i = P T ¯ X i ¯ Y i T , and denote the objecti ve function in Eq. (12) by f ( P i , D i ) . Then we hav e f ( P i , D i ) = tr ( D 2 A i ) − 2 tr ( DB i ) + tr ( ¯ X i ¯ X T i ) = m X j =1 a ( i ) j j ( d ( i ) j ) 2 − 2 m X j =1 b ( i ) j j d ( i ) j + tr ( ¯ X i ¯ X T i ) , where a ( i ) j j , b ( i ) j j and d ( i ) j are the j -th diagonal entries of A i , B i and D i , respectively . Since a ( i ) j j ≥ 0 , j = 1 , 2 , . . . , m , f is a con vex function of vector δ ( D i ) . T aking partial deri vati ve with respect to d ( i ) j ( j = 1 , 2 , . . . , m ) and by making them to be zero, we can get the global optimal solutions to d ( i ) j ( j = 1 , 2 , . . . , m ) as follows d ( i ) j = b ( i ) j j a ( i ) ii , j = 1 , 2 , . . . , m . Then D ∗ i is given by D ∗ i = ( δ 2 ( A i )) − 1 δ 2 ( B i ) . (13) Substituting Eq. (13) into f yields f ( P i ) = tr ( A i (( δ 2 ( A i )) − 1 δ 2 ( B i )) 2 ) − 2 tr (( δ 2 ( A i )) − 1 δ 2 ( B i ) B i ) + tr ( ¯ X i ¯ X i T ) = m X j =1 a ( i ) j j ( b ( i ) j j ) 2 ( a ( i ) j j ) 2 − 2 m X j =1 b ( i ) j j b ( i ) j j a ( i ) j j + tr ( ¯ X i ¯ X i T ) = − m X j =1 ( b ( i ) j j ) 2 a ( i ) j j + tr ( ¯ X i ¯ X i T ) . Let M i = ¯ X i ¯ Y T i ( δ 2 ( A i )) − 1 / 2 , then f ( P i ) can be rewritten as f ( P i ) = − m X j =1 ( P T i j M i j ) 2 + tr ( ¯ X i ¯ X i T ) = − tr (( P T i M i ) ( P T i M i )) + tr ( ¯ X i ¯ X i T ) , where P i j and M i j are the j -th columns of matrices P i and M i , respecti vely . stands for the Hadamard product ov er matrices. The optimization problem Eq. (12) can be transformed into max P i φ ( P i ) = tr (( P T i M i ) ( P T i M i )) s . t . P i ∈ S t ( n, m ) . (14) 3) Computation of P ∗ i : In the third step, we use gradient descent method over matrix manifold to solve Eq. (14), which is an optimization problem for matrix function over the Stiefel manifold S t ( n, m ) . Denote the gradient of φ in R nm by ∇ ¯ φ ( P i ) and the gradient of φ on S t ( n, m ) by ∇ φ ( P i ) , then by the proposition of Stiefel manifold [40], ∇ φ ( P i ) is the projection of ∇ ¯ φ ( P i ) onto the tangential space at P i and can be computed by the following formula ∇ φ ( P i ) = ∇ ¯ φ ( P i ) − P i P Z i ∇ ¯ φ ( P i ) + ( ∇ ¯ φ ( P i )) T P i 2 . (15) Now all we need is to compute ∇ ¯ φ ( P i ) . Let F ( P i ) = ( P T i M i ) ( P T i M i ) . From matrix calculus, the differentiation of φ with respect to P i is D φ ( P i ) = (v ec I m ) T D F ( P i ) , (16) where the vec operator reformulates a n × m matrix into a nm - dimensional vector by stacking its columns one underneath other . Next we derive D F ( P i ) . First, we hav e dF ( P i ) = 2( M T i P i ) ( M T i dP i ) = 2 W T m (( M T i P i ) ⊗ ( M T i dP i )) W m , where ⊗ stands for the Kroneck er product o ver matrices and W m = (v ec w 1 w T 1 , vec w 2 w T 2 , · · · , vec w m w T m ) is an m 2 × m matrix. w i , i = 1 , 2 , . . . , m is an m -dimensional v ector who has 1 in its i -th component and 0 elsewhere. Then we ha ve v ec dF ( P i ) = 2 vec( W T m (( M T i P i ) ⊗ ( M T i dP i )) W m ) = 2( W T m ⊗ W m ) vec( M T i P ⊗ ( M T i dP i )) = 2( W T m ⊗ W m )( H i ⊗ I m ) vec( M T i dP i ) = 2( W T m ⊗ W m )( H i ⊗ I m )( I m ⊗ M T i ) d vec P i , where H i = (( I m ⊗ K mm )((v ec M T i P i ) ⊗ I m )) ⊗ I m . Here K mm is a permutation matrix of order m 2 , and for any square matrix M of order m , K mm v ec M = v ec M T . Then by matrix calculus [41], we have D F ( P i ) = 2( W T m ⊗ W m )( H i ⊗ I m )( I m ⊗ M T i ) . Furthermore, through algebraic deduction and Eq. (16), we hav e D φ ( P i ) = (v ec I m ) T D F ( P i ) = 2 vec( M i δ 2 ( P T i M i )) T . Then ∇ ¯ φ ( P i ) is gi ven by the following formula ∇ ¯ φ ( P i ) = 2 M i δ 2 ( P T i M i ) , and by using Eq. (15), ∇ φ ( P i ) now reads ∇ φ ( P i ) = 2 M i δ 2 ( P T i M i ) − P i P T i δ 2 ( P T i M i ) − P δ 2 ( P T i M i ) M T i P i . (17) Giv en a step length for iteration, we apply gradient descent method to find P ∗ i such that ∇ φ ( P i ) v anishes. In each itera- tion, we first update P i as ˜ P i = P i + α ∇ φ ( P i ) . Then we retract ˜ P i to S t ( n, m ) . From the property of S t ( n, m ) , such retraction can be obtained through the QR 7 Algorithm 1: Anisotropic Scaling Independent Measure (ASIM), M asim . Input : Local neighborhood matrix X i and corresponding embedding matrix Y i , number of nearest neighbors k , step length for iteration α , and threshold for stopping criterion. Output : M asim ( X i , Y i ) . Step 1. Assign ¯ X i = X i ( I k − e k e T k ) . Step 2. Assign ¯ Y i = Y i ( I k − e k e T k ) . Step 3. Set initial value P (0) i for P i . Step 4. Use Eq. (17) to compute ∇ φ ( P (0) i ) . Step 5. If k∇ φ ( P (0) i ) k F < , goto Step 6; otherwise, do P (0) i ← P (0) i + α ∇ φ ( P (0) i ) . Compute the QR decomposition of P (0) i , P (0) i = Q i R i . Let P (0) i ← Q i and goto Step 5. Step 6. Let P ∗ i = P (0) i and use Eq. (13) to compute D ∗ i . Step 7. Use Eq. (11) to compute t ∗ i . Step 8. Compute M asim ( X i , Y i ) through Eq. (7). decomposition of ˜ P i . Let ˜ P i = Q i R i , where Q i ∈ S t ( n, m ) and R i is an upper -triangular matrix. The retraction of ˜ P i to S t ( n, m ) is just Q i . In each iteration, we use Q i to update P i until k∇ φ ( P i ) k F is less than a gi ven threshold . After P ∗ i is computed, D ∗ i can be gi ven by Eq. (13), and the optimal v alue to Eq. (12) is f ( P ∗ i , D ∗ i ) . 4) The algorithm and discussion: Finally , we summarize the computation process of M asim in Algorithm 1. When the dimension n of input samples is very high, performing QR decomposition of ˜ P i in each iteration will greatly increase of computational complexity of Algorithm 1. A possible solution to this issue is first projecting X i to its tangential space, denoted as T X i , and then computing M asim ( T X i , Y i ) . When data are densely distrib uted on the manifold, T X i can optimally recover the local linear structure of a manifold. Therefore, such strategy is feasible. The tan- gential space can be approximated by using PCA, MDS or the method proposed in [42]. I V . N O R M A L I Z A T I O N I N D E P E N D E N T E M B E D D I N G Q UA L I T Y A S S E S S M E N T When assessing the quality of embeddings, we need to consider both local and global ev aluations. This leads to tw o issues. • Does the embedding preserve the global topology of the manifold? • Does the embedding preserve the geometric structure of local neighbor neighborhoods? In this section, we propose Normalization Independent Em- bedding Quality Assessment method (NIEQA) to address these two issues, which is independent of normalization. NIEQA is based on the ASIM measure stated in Section III and consists of two assessments, a local one and a global one. In the following subsections, we introduce these two assessments respectiv ely as well as how NIEQA can be implemented in model selection and model ev aluation. A. Local assessment For local neighborhood X i on a data manifold and its cor - responding low-dimensional embedding Y i , the local measure M asim defined in last section characterizes how well local neighborhood structure is preserved and is independent of normalization. Therefore, we define the local assessment as the mean v alue of M asim ( X i , Y i ) over index i , that is, M L ( X, Y ) = 1 N N X i =1 M asim ( X i , Y i ) . (18) B. Global assessment From geometric intuition, if an embedding preserves the global topology of the data manifold well, then such embed- ding should preserve relativ e positions among “representativ e” samples on the manifold. In other words, if we treat these “rep- resentativ e” samples as a local neighborhood, where pairwise Euclidean distances among neighborhood samples are replaced with pairwise geodesic distances on the manifold, then a good embedding should preserve the geometric structure of this neighborhood. Motiv ated by the above consideration, we define the global assessment as the matching degree between the aforemen- tioned described neighborhood and its corresponding embed- ding under rigid motion and anisotropic coordinate scaling. The computation of the global assessment consists of three steps, which are depicted below , respectively . 1) Selecting landmark points. First, for each training sample x i , find its k l nearest neighbors. Treat x i as a node in a graph and add edges among neighboring samples with edge length being pairwise Euclidean distance. Through such construction we get a connected graph. Then we use the shortest path length between x i and x j to approximate the geodesic distance between them for all i and j . Next, we count how many shortest paths going through each x i and record this number as its importance degree. Finally , the top 10% most 8 important data samples are selected as landmark points on the manifold and the set the y formed is denoted by X l . 2) Computing ˜ Y l . Once X l is fixed in the first step, the dis- tance between any two landmark points is defined to be the approximated geodesic distance. Then we implement MDS [4] to X l to obtain its isometric embedding ˜ Y l , which optimally preserve relative positions of landmark points on the manifold. Note that the dimensions of ˜ Y l and Y l are equal, and the latter one is the subset in Y corresponding to X l . 3) Computing the global assessment . W e define the global assessment M G to be the ASIM measure between ˜ Y l and Y l M G ( X, Y ) = M asim ( ˜ Y l , Y l ) , (19) where ˜ Y l and Y l are the m × l data matrices correspond- ing to ˜ Y l and Y l , respectively . Remark 1. During landmark points selection, the parameter k l needs to be set manually . Based on experimental e xperience, setting k l = 0 . 1 N can yield a connected graph that appr oxi- mates the manifold structur e well. However , if the graph is disconnected under curr ent k l , k l should be set to be the smallest integ er whic h makes the gr aph fully connected. The landmark points selection method stated above has intuitive geometric motivation and is easy to implement. It can also be replaced with other mor e accurate yet mor e complicated appr oaches, for example, the methods pr oposed in [43] and [44]. C. Implementation in model evaluation and model selection In this subsection, we state ho w to implement the NIEQA method to model ev aluation and model selection for manifold learning. • Model evaluation . Given X , suppose that we hav e tw o embeddings, namely Y 1 and Y 2 , obtained by different manifold learning methods. Then we say that Y 1 owns better locality preservation than Y 2 if M L ( X, Y 1 ) < M L ( X, Y 2 ) and vice versa. W e say Y 1 owns better global topology preservation than Y 2 if M G ( X, Y 1 ) < M G ( X, Y 2 ) and vice versa. • Model selection . Giv en X and a set of parameters P = { p 1 , p 2 , . . . , p l } , for each parameter p i we compute its corresponding embedding Y ( i ) using specific manifold learning method. Then we use M G or M L or their combination, which depends on the user’ s demand, to ev aluate the quality of Y ( i ) . Finally , the p i corresponding T ABLE II D E SC R I P TI O N O F E X P ER I M E NTA L DAT A S E T S . Data manifold N n m Description Swissroll 1000 3 2 Surface isometrically embedded in R 3 Swisshole 1000 3 2 Surface embedded in R 3 Gaussian 1000 3 2 Surface isometrically embedded in R 3 lleface 1493 560 2 Face manifold with resolution 28 × 20 T ABLE III N OTA T I O NS U S ED I N E X P ER I M E NT S . Notation Description M P Procrustes measure (Eq. (1)) [23] M c P M P with global scaling removed [23] M LC LCMC measure (Eq. (2)) [27], [28] M RV Residual V ariance measure (Eq. (3)) [7] M L Local assessment of NIEQA (Eq. (18)) M G Global assessment of NIEQA (Eq. (19)) M t Matching degree between Y and ground truth U , M asim ( Y , U ) to the lowest assessment score is chosen to be the optimal parameter . V . E X P E R I M E N T S In this section, the effecti veness of the NIEQA method is validated through a series of experimental tests on benchmark data sets. In Subsection V -A, NIEQA is applied to model ev aluation for manifold learning. In Subsection V -A, NIEQA is used to select optimal parameters for the L TSA method which outputs normalized embeddings. In experiments, NIEQA is compared with three commonly used assessment methods. W e compute 1 − M LC instead M LC to obtain a unified criterion, that is, a small assessment v alue close to zero indicates good quality of the embedding. The benchmark data sets used in experiments are briefly depicted in T able II and notations for methods are summarized in T able III. A. Model e valuation In the first experiment, we apply NIEQA to model ev alua- tion of the Swissroll manifold with parameter equation x 1 = u 1 cos u 1 x 2 = u 2 x 3 = u 1 sin u 1 . W e use LLE [5], LE [10], L TSA [14], ISOMAP [7] and RML [16] to learn this manifold, respectively . 1000 training samples are randomly generated and the number of nearest 9 neighbors is 10. Figs. 2 (c)-(g) sho ws the results of manifold learning, where X and U stands for the training data and the groundtruth of intrinsic degrees of freedom, respectiv ely . By visual inspection, the embeddings given by L TSA and RML are the most similar to U . The one giv en by ISOMAP is a litter worse, and the one learned by LLE has a great change in global shape. LE fails to recover the geometric structure of U . For embeddings giv en by the above methods, we compute the different assessments described in T able III and use bar plots to visualize their values in Figs. 2(h)-(m). From the bar plots, we can see that M P only works for isometric embeddings gi ven by ISOMAP and RML while reports false high values for normalized embeddings learned by L TSA and LLE. Although M c P eliminates the affects of global scaling, only the scale of M P is normalized and it still reports false high values for normalized embeddings. M LC and M RV fails to output reasonable equality ev aluations. It should be noted that M RV is originally designed for the ISOMAP method and hence works well for the embedding gi ven by ISOMAP . The two assessments M L and M G in NIEQA provide ov erall and reasonable ev aluations on embedding quality for various methods. M L shows that L TSA and RML best pre- serve local neighborhood. LLE and ISOMAP perform worse, and LE performs the worst. M G further indicates that the global-shape-preservation of the embedding giv en by LLE is not good. This completely matches visual inspection, which demonstrates that NIEQA can ef fectiv ely ev aluate the quality of both isometric and normalized embeddings. Besides, the bar plot of the matching degree M t between Y and U is shown in Fig. 2(n). W e can see that only M L and M G match M t , which v alidates the effecti veness of NIEQA. Similar to the first e xperiment, we apply NIEQA to model ev aluation of the Swisshole manifold, which shares the same parameter equation to Swissroll . The difference is that the set of intrinsic degree of freedoms U is no longer a con vex set, where a rectangular re gion in U is digged out. Therefore, Swisshole manifold is geodesic non-connected. 1000 training samples are randomly generated from the mani- fold and the number of nearest neighbors k is 10. The learned low-dimensional embeddings and the bar plots of quality assessments are sho wn in Fig. 3. From Fig. 3, we can see that L TSA and RML correctly learned the geometric structure of U with the highest quality ov er other approaches. The embedding giv en by LLE has a distortion in global shape. ISOMAP and LE fails to learn the structure of U . From the bar plots in Figs. 3 (h)-(l), we can see that M L reports a reasonable quality assessment and matches M t well which is illustrated in Fig. 3(m). M P and M c P works only for isometric embeddings provided by ISOMAP and RML. M LC and M RV fails to report reasonable e valuations. Since Swisshole manifold is geodesic non-connected, us- ing shortest path length would fail to approximate geodesci distance. Therefore, we do not compute the global assessment M G in NIEQA. In the third experiment, we apply NIEQA to model ev alu- ation of the Gaussian manifold, whose parameter equation is x 1 = u 1 x 2 = u 2 x 3 = (1 / 2 π ) exp {− (( u 1 ) 2 + ( u 2 ) 2 ) / 2 } . 1000 training samples are randomly generated from the mani- fold and the number of nearest neighbors k is 10. Fig. 4 shows the learned low-dimensional embeddings as well as bar plots of different quality assessments. From Fig. 4, we can observe that except LE all the other methods successfully learned the geometric structure of this manifold, whilst the quality of the embedding giv en by ISOMAP is a litter worse. From Figs. 4 (h)-(m), we can see that M c P performs well in this case by eliminating the global scaling factor . This is due to the isotropic property of this manifold. M LC reports correct ev aluations but still leans against to RML. M RV fails to assess the embeddings correctly . Both the two assessments in NIEQA successfully ev aluate the quality of different embeddings and match M t well. Note that the Gaussian surface is isotropic, hence the measure M c P also works. Howe ver , for anisotropic surfaces like Swissroll and Swisshole , only removing global scaling wound not yield a reasonable assessment. In the next experiment, we apply NIEQA to model ev al- uation tasks on the lleface data set, which is a high- dimensional image manifold. As the code of RML on high- dimensional data is not av ailable, we do not test RML on this data set. The training data contain 1965 face images, and the intrinsic de grees of freedom are the angle of f ace orientation and the variation of facial emotion. W e randomly select 1493 images as training data such that the data graph constructed via ISOMAP is connected. W e apple LLE, LE, ISOMAP and L TSA to learn this manifold with 15 nearest neighbors. The two dimensional embeddings learned by these methods and bar plots of the quality assessments given by different methods are shown in Fig. 5. From Fig. 5 we can see that the embedding given by LLE does not recover the change of face orientation. The other methods all successfully extract the two intrinsic degrees of freedom despite the dif ference in embedding shape. The 10 −10 −5 0 5 10 15 0 20 40 −15 −10 −5 0 5 10 15 (a) X 4 6 8 10 12 14 0 5 10 15 20 (b) U −3 −2 −1 0 1 2 3 4 −2.5 −2 −1.5 −1 −0.5 0 0.5 1 1.5 (c) LLE −2 −1.5 −1 −0.5 0 0.5 1 1.5 −1.5 −1 −0.5 0 0.5 1 1.5 2 (d) LE −0.08 −0.06 −0.04 −0.02 0 0.02 0.04 0.06 −0.06 −0.04 −0.02 0 0.02 0.04 0.06 (e) L TSA −60 −40 −20 0 20 40 60 −15 −10 −5 0 5 10 15 (f) ISOMAP −30 −20 −10 0 10 20 30 40 −50 −40 −30 −20 −10 0 10 20 30 40 (g) RML c d e f g 0 0.2 0.4 0.6 0.8 1 (h) M P c d e f g 0 0.1 0.2 0.3 0.4 0.5 (i) M c P c d e f g 0 0.2 0.4 0.6 0.8 (j) 1- M LC c d e f g 0 0.2 0.4 0.6 0.8 1 (k) M RV c d e f g 0 0.1 0.2 0.3 0.4 0.5 (l) M L c d e f g 0 0.02 0.04 0.06 0.08 0.1 (m) M G c d e f g 0 0.2 0.4 0.6 0.8 (n) M t Fig. 2. Manifold learning results on Swissroll . (a) Training data X . (b) Groundtruth of intrinsic degrees of freedom U . (c)-(g) Embeddings learned by various method. The name of each method is stated below each subfigure. (h)-(n) Bar plots of different assessments on learned embeddings. The lower -case character under each bar corresponds to the index of the subfigure above. abov e visual inspection is also validated by the bar plots of quantitativ e assessments shown in Figs. 5(e)-(i). M LC , M RV and M L all suggest that the quality of the embdding giv en by LLE is poor, while the others are almost of the same quality . M LC and M L indicate that the embedding given by L TSA is of the highest quality . M P and M c P fail in this case. Remark 2. In e xperiments on high-dimensional ima ge man- ifold, we did not compute M G . The r eason lies in that the computation of M G needs to estimate geodesic distances based on shortest gr aph paths. Howe ver , we have no prior knowledge on the underlying geometric structur e of image manifolds, hence using M G to assess the global topology would yield unknown bias. Also note that the values of intrinsic degr ees of fr eedom for image manifolds ar e unknown, hence we do not compute M t either . B. Model selection In this subsection, we take the L TSA method as an example to demonstrate the application of NIEQA to model selection task. The most important parameter for L TSA is the number of nearest neighbors k . W e first apply NIEQA to selecting k 11 −10 −5 0 5 10 15 0 20 40 −15 −10 −5 0 5 10 15 (a) X 4 6 8 10 12 14 16 0 5 10 15 20 25 (b) U −4 −3 −2 −1 0 1 2 3 −1.5 −1 −0.5 0 0.5 1 1.5 2 2.5 (c) LLE −1.5 −1 −0.5 0 0.5 1 1.5 2 −2 −1.5 −1 −0.5 0 0.5 1 1.5 (d) LE −0.06 −0.04 −0.02 0 0.02 0.04 0.06 0.08 −0.06 −0.04 −0.02 0 0.02 0.04 0.06 (e) L TSA −40 −20 0 20 40 60 −20 −15 −10 −5 0 5 10 15 20 (f) ISOMAP −50 −40 −30 −20 −10 0 10 20 30 40 −30 −20 −10 0 10 20 30 40 (g) RML c d e f g 0 0.2 0.4 0.6 0.8 1 (h) M P c d e f g 0 0.1 0.2 0.3 0.4 0.5 (i) M c P c d e f g 0 0.2 0.4 0.6 0.8 (j) 1- M LC c d e f g 0 0.2 0.4 0.6 0.8 1 (k) M RV c d e f g 0 0.1 0.2 0.3 0.4 0.5 (l) M L c d e f g 0 0.2 0.4 0.6 0.8 (m) M t Fig. 3. Manifold learning results on Swisshole . (a) Training data X . (b) Groundtruth of intrinsic degrees of freedom U . (c)-(g) Embeddings learned by various method. The name of each method is stated below each subfigure. (h)-(m) Bar plots of different assessments on learned embeddings. The lower -case character under each bar corresponds to the index of the subfigure above. for L TSA on the Swissroll data set. Similar to the first experiment in Section V -A. W e randomly select 1000 samples from the Swissroll manifold as training data. The v alues of k are chosen to be integers from 5 to 24. For each k , an embedding is learned with L TSA, which are shown in Fig. 6. The assessments given by NIEQA corresponding to different values of k are shown in Fig. 8(a). From the figure we can see that when k is taking values between 6 and 15, L TSA would produce embeddings with high quality . This observ ation is also supported by visual inspection from Fig. 6, which validates the effecti veness of the NIEQA method. In the second experiment, we apply NIEQA to select optimal k for L TSA on the lleface data set. T raining data are the same to those used in the experiment in Section V -A. V alues of k are taken to be integers from 5 to 24. For each k , an embedding is learned with L TSA, which is shown in Fig. 7. Corresponding quality assessment giv en by NIEQA are illustrated in Fig. 8(b), from which we can see that the embedding corresponding to k = 14 is of the highest quality . W e can also observ e that when k > 8 , the quality of embeddings improv es along with the increase of k , which is also validated by visual inspections from Fig. 7. 12 −4 −2 0 2 4 −4 −2 0 2 4 0 0.05 0.1 0.15 0.2 (a) X −4 −3 −2 −1 0 1 2 3 4 −3 −2 −1 0 1 2 3 4 (b) U −4 −3 −2 −1 0 1 2 3 −4 −3 −2 −1 0 1 2 3 4 (c) LLE −2 −1.5 −1 −0.5 0 0.5 1 1.5 2 −1.5 −1 −0.5 0 0.5 1 1.5 2 (d) LE −0.2 −0.15 −0.1 −0.05 0 0.05 0.1 0.15 −0.15 −0.1 −0.05 0 0.05 0.1 (e) L TSA −6 −4 −2 0 2 4 6 −4 −3 −2 −1 0 1 2 3 4 (f) ISOMAP −4 −3 −2 −1 0 1 2 3 4 −4 −3 −2 −1 0 1 2 3 4 (g) RML c d e f g 0 0.2 0.4 0.6 0.8 1 (h) M P c d e f g 0 0.1 0.2 0.3 0.4 (i) M c P c d e f g 0 0.1 0.2 0.3 0.4 (j) 1- M LC c d e f g 0 0.2 0.4 0.6 0.8 1 (k) M RV c d e f g 0 0.05 0.1 0.15 0.2 0.25 (l) M L c d e f g 0 0.01 0.02 0.03 0.04 (m) M G c d e f g 0 0.05 0.1 0.15 0.2 (n) M t Fig. 4. Manifold learning results on Gaussian . (a) Training data X . (b) Groundtruth of intrinsic degrees of freedom U . (c)-(g) Embeddings learned by various method. The name of each method is stated below each subfigure. (h)-(n) Bar plots of different assessments on learned embeddings. The lower -case character under each bar corresponds to the index of the subfigure above. V I . C O N C L U S I O N S A N D D I S C U S S I O N S In this paper, we proposed a no vel normalization indepen- dent embedding quality assessment (NIEQA) method for man- ifold learning, which has wider application range than current approaches. W e first propose a new local measure, which can quantitativ ely ev aluate how well local neighborhood structure is preserved under rigid motion and anisotropic coordinate scaling. Then the NIEQA method, which is designed based on this new measure, can effecti vely and quantitativ ely ev aluate the quality of both isometric and normalized embeddings. Fur- thermore, the NIEQA method considers both local and global topology , thus it can yield an overall assessment. Experimental tests on benchmark data sets v alidate the effecti veness of the proposed method. Some discussions and possible improvements in future works are stated belo w . • The measure M asim is computed by using gradient descent method on matrix manifold. Whether the solution con verges to a global optima remains unproved and is the key part of our future works. Meanwhile, we will also consider how to design more efficient iteration method 13 −8 −6 −4 −2 0 2 4 6 −4 −3 −2 −1 0 1 2 (a) LLE −4 −3 −2 −1 0 1 2 3 4 −2 −1.5 −1 −0.5 0 0.5 1 1.5 (b) LE −0.05 0 0.05 −0.08 −0.06 −0.04 −0.02 0 0.02 0.04 0.06 0.08 0.1 (c) L TSA −5000 −4000 −3000 −2000 −1000 0 1000 2000 3000 4000 −3000 −2000 −1000 0 1000 2000 3000 4000 (d) ISOMAP a b c d 0 0.2 0.4 0.6 0.8 1 (e) M P a b c d 0 0.2 0.4 0.6 0.8 (f) M c P a b c d 0 0.2 0.4 0.6 0.8 (g) 1- M LC a b c d 0 0.2 0.4 0.6 0.8 1 (h) M RV a b c d 0 0.2 0.4 0.6 0.8 (i) M L Fig. 5. Manifold learning results on lleface . (a)-(d) Embeddings learned by various methods. The name of each method is stated below each subfigure. (e)-(i) Bar plots of different assessments on learned embeddings. The lower -case character under each bar corresponds to the index of the subfigure above. 14 k=5 k=6 k=7 k=8 k=9 k=10 k=11 k=12 k=13 k=14 k=15 k=16 k=17 k=18 k=19 k=20 k=21 k=22 k=23 k=24 Fig. 6. Embeddings given by L TSA on Swissroll data set with different values of k . −0.1 −0.05 0 0.05 0.1 −0.2 −0.15 −0.1 −0.05 0 0.05 0.1 0.15 k=6 (a) −0.06 −0.04 −0.02 0 0.02 0.04 0.06 0.08 −0.8 −0.7 −0.6 −0.5 −0.4 −0.3 −0.2 −0.1 0 0.1 k=8 (b) −0.04 −0.03 −0.02 −0.01 0 0.01 0.02 0.03 0.04 0.05 −0.1 −0.05 0 0.05 0.1 0.15 0.2 0.25 k=10 (c) −0.05 0 0.05 −0.08 −0.06 −0.04 −0.02 0 0.02 0.04 0.06 0.08 0.1 k=14 (d) −0.06 −0.04 −0.02 0 0.02 0.04 0.06 −0.08 −0.06 −0.04 −0.02 0 0.02 0.04 0.06 0.08 0.1 0.12 k=18 (e) −0.06 −0.04 −0.02 0 0.02 0.04 0.06 0.08 −0.1 −0.08 −0.06 −0.04 −0.02 0 0.02 0.04 0.06 0.08 0.1 k=22 (f) Fig. 7. Embeddings given by L TSA on lleface data set with different values of k . 15 to accelerate con vergence. • The NIEQA method is based on a local matching method- ology . Its basic assumption is that the manifold is densely sampled and training data strictly lie on the manifold. For data manifold with noise or outliers, the efficienc y of NIEQA may be af fected. A possible solution to this issue is to implement denoising or outlier remov al process before training. • Based on NIEQA, whether we can design a manifold learning method with better learning performance is also one of our future works. A C K N O W L E D G E M E N T S This work was partly supported by the NNSF of China grant no. 90820007, and the 973 Program of China grant no. 2007CB311002. R E F E R E N C E S [1] D. L. Donoho, High-dimensional data analysis: the curses and blessings of dimensionality , in: Proceedings of American Mathematical Society Conference on Math Challenges of the 21st Century , 2000. [2] M. Turk, A. Pentland, Eigenfaces for recognition, Journal of Cognitive Neuroscience 3 (1) (1991) 71–86. [3] I. T . Jollif fe, Principal Component Analysis, 2nd Edition, Springer , 2002. [4] T . F . Cox, M. A. A. Cox, Multidimensional Scaling, Second Edition, Chapman & Hall, 2000. [5] S. T . Roweis, L. K. Saul, Nonlinear dimensionality reduction by locally linear embedding, Science 290 (5500) (2000) 2323–2326. [6] L. K. Saul, S. T . Roweis, Think globally , fit locally: Unsupervised learning of low dimensional manifolds, Journal of Machine Learning Research 4 (2003) 119–155. [7] J. B. T enenbaum, V . Silva, J. C. Langford, A global geometric frame- work for nonlinear dimensionality reduction, Science 290 (5500) (2000) 2319–2323. [8] V . De Silva, J. B. T enenbaum, Global versus local methods in nonlinear dimensionality reduction, in: Advances in Neural Information Processing Systems 15, V ol. 15, 2003, pp. 705–712. [9] M. Belkin, Problems of learning on manifolds, Ph.D. thesis, The Univ ersity of Chicago (2003). [10] M. Belkin, P . Niyogi, Laplacian eigenmaps for dimensionality reduction and data representation, Neural Computation 15 (6) (2003) 1373–1396. [11] D. L. Donoho, C. Grimes, Hessian eigenmaps: Locally linear embedding techniques for high-dimensional data, Proceedings of the National Academy of Sciences of the United States of America 100 (10) (2003) 5591–5596. [12] R. R. Coifman, S. Lafon, A. B. Lee, M. Maggioni, B. Nadler, F . W arner, S. W . Zucker , Geometric diffusions as a tool for harmonic analysis and structure definition of data: Diffusion maps, Proceedings of the National Academy of Sciences of the United States of America 102 (21) (2005) 7426–7431. [13] S. Lafon, A. B. Lee, Dif fusion maps and coarse-graining: A unified framew ork for dimensionality reduction, graph partitioning, and data set parameterization, IEEE Transactions on Pattern Analysis and Machine Intelligence 28 (9) (2006) 1393–1403. [14] Z. Zhang, H. Zha, Principal manifolds and nonlinear dimensionality reduction via tangent space alignment, SIAM Journal on Scientific Computing 26 (1) (2005) 313–338. [15] K. W einberger , L. Saul, Unsupervised learning of image manifolds by semidefinite programming, International Journal of Computer V ision 70 (1) (2006) 77–90. [16] T . Lin, H. Zha, Riemannian manifold learning, IEEE T ransactions on Pattern Analysis and Machine Intelligence 30 (5) (2008) 796–809. [17] L. W ang, D. Suter, Learning and matching of dynamic shape manifolds for human action recognition, IEEE Transactions on Image Processing 16 (6) (2007) 1646–1661. [18] J. Chen, R. W ang, S. Y an, S. Shan, X. Chen, W . Gao, Enhancing human face detection by resampling examples through manifolds, IEEE T ransactions on Systems, Man and Cybernetics, Part A: Systems and Humans 37 (6) (2007) 1017–1028. [19] M. Cheng, M. Ho, C. Huang, Gait analysis for human identification through manifold learning and hmm, Pattern Recognition 41 (8) (2008) 2541–2553. [20] Y . Cheon, D. Kim, Natural facial expression recognition using differential-aam and manifold learning, Pattern Recogn. 42 (7) (2009) 1340–1350. [21] C. M. Bachmann, T . L. Ainsworth, R. A. Fusina, Exploiting manifold geometry in hyperspectral imagery , IEEE Transactions on Geoscience and Remote Sensing 43 (3) (2005) 441–454. [22] H. Qiao, P . Zhang, B. Zhang, S. Zheng, Learning an intrinsic-v ariable preserving manifold for dynamic visual tracking, IEEE T ransactions on Systems, Man and Cybernetics, Part B: Cybernetics 40 (3) (2010) 868– 880. [23] Y . Goldberg, Y . Ritov , Local procrustes for manifold embedding: a measure of embedding quality and embedding algorithms, Machine Learning 77 (1) (2009) 1–25. [24] R. Sibson, Studies in robustness of multidimensional-scaling: Procrustes statistics, Journal of the Royal Statistical Society Series B - Methodolog- ical 40 (2) (1978) 234–238. [25] R. Sibson, Perturbational analysis of classical scaling, Journal of the Royal Statistical Society Series B - Methodological 41 (2) (1979) 217– 229. [26] G. A. F . Seber , Multiv ariate observations, John Wile y & Sons. INC, 2004. [27] L. S. Chen, Local multidimensional scaling for nonlinear dimension reduction, graph layout and proximity analysis, Ph.D. thesis, University of Pennsylvania (2006). [28] L. Chen, A. Buja, Local multidimensional scaling for nonlinear dimen- sion reduction, graph dra wing, and proximity analysis, Journal of the American Statitical Association 104 (485) (2009) 209–219. [29] J. V enna, S. Kaski, Local multidimensional scaling, Neural Networks 19 (6-7) (2006) 889–899. [30] J. V alencia-Aguirre, A. ´ Alvarez Mesa, G. Daza-Santacoloma, G. Castellanos-Dom ´ ınguez, Automatic choice of the number of nearest neighbors in locally linear embedding, in: CIARP ’09: Proceedings of the 14th Iberoamerican Conference on Pattern Recognition, 2009, pp. 77–84. [31] G. Daza-Santacoloma, C. D. Acosta-Medina, G. Castellanos- Dom ´ ınguez, Regularization parameter choice in locally linear embedding, Neurocomputing 73 (10-12) (2010) 1595–1605. [32] U. Akkucuk, J. D. Carroll, Paramap vs. isomap: A comparison of two nonlinear mapping algorithms, Journal of Classification 23 (2006) 221– 254. [33] S. France, D. Carroll, Dev elopment of an agreement metric based upon the rand index for the ev aluation of dimensionality reduction techniques, with applications to mapping customer data, in: Machine Learning and Data Mining in Pattern Recognition, V ol. 4571 of Lecture Notes in Computer Science, Springer Berlin / Heidelberg, 2007, pp. 499–517. [34] J. A. Lee, M. V erleysen, Quality assessment of dimensionality reduction: Rank-based criteria, Neurocomputing 72 (7-9) (2009) 1431–1443. [35] J. A. Lee, M. V erleysen, Quality assessment of nonlinear dimension- ality reduction based on k-ary neighborhoods, in: Journal of Machine 16 5 6 7 8 9 10 11 12 13 14 15 16 17 18 19 20 21 22 23 24 0 0.1 0.2 0.3 0.4 0.5 0.6 0.7 0.8 0.9 1 M L M G (a) 5 6 7 8 9 10 11 12 13 14 15 16 17 18 19 20 21 22 23 24 0.45 0.5 0.55 0.6 0.65 0.7 (b) Fig. 8. Graph plot of embedding quality assessments in model selection experiment for the L TSA method. (a) Assessments on Swissroll data set with different valuse of k . (b) Assessment M L on lleface data set with different valuse of k . Learning Research: W orkshop and Conference proceedings, 2008, pp. 21–35. [36] J. A. Lee, M. V erleysen, Scale-independent quality criteria for dimen- sionality reduction, Pattern Recognition Letters 31 (2010) 2248–2257. [37] O. Kouroptev a, O. Okun, M. Pietik ¨ ainen, Selection of the optimal parameter value for the locally linear embedding algorithm, in: The 1st International Conference on Fuzzy Systems and Knowledge Discovery , 2002, pp. 359–363. [38] P . Doll ´ ar , V . Rabaud, S. Belongie, Non-isometric manifold learning: analysis and an algorithm, in: ICML ’07: Proceedings of the 24th international conference on Machine learning, A CM, Ne w Y ork, NY , USA, 2007, pp. 241–248. [39] J. Dattorro, Conve x Optimization & Euclidean Distance Geometry , Meboo Publishing USA, 2005. [40] P .-A. Absil, R. Mahony , R. Sepulchre, Optimization Algorithms on Matrix Manifolds, Princeton Univ ersity Press, Princeton, NJ, USA, 2007. [41] J. R. Magnus, H. Neudecker, Matrix differential calculus with applica- tions in statistics and econometrics, 2nd Edition, John W iley & Sons, 1999. [42] P . Zhang, H. Qiao, B. Zhang, An improved local tangent space alignment method for manifold learning, Pattern Recognition Letters 32 (2) (2011) 181–190. [43] V . d. Silva, J. B. T enenbaum, Selecting landmark points for sparse man- ifold learning, in: Advances in Neural Information Processing Systems (NIPS), V ol. 18, 2006, pp. 1241–1248. [44] J. Li, P . Hao, Finding representative landmarks of data on manifolds, Pattern Recogn. 42 (11) (2009) 2335–2352.
Original Paper
Loading high-quality paper...
Comments & Academic Discussion
Loading comments...
Leave a Comment