Which are the best cities for psychology research worldwide? A map visualizing city ratios of observed and expected numbers of highly-cited papers
We present scientometric results about world-wide centers of excellence in psychology. Based on Web of Science data, domain-specific excellence can be identified for cities where highly cited papers are published. Data refer to all psychology article…
Authors: Lutz Bornmann, Loet Leydesdorff, G"unter Krampen
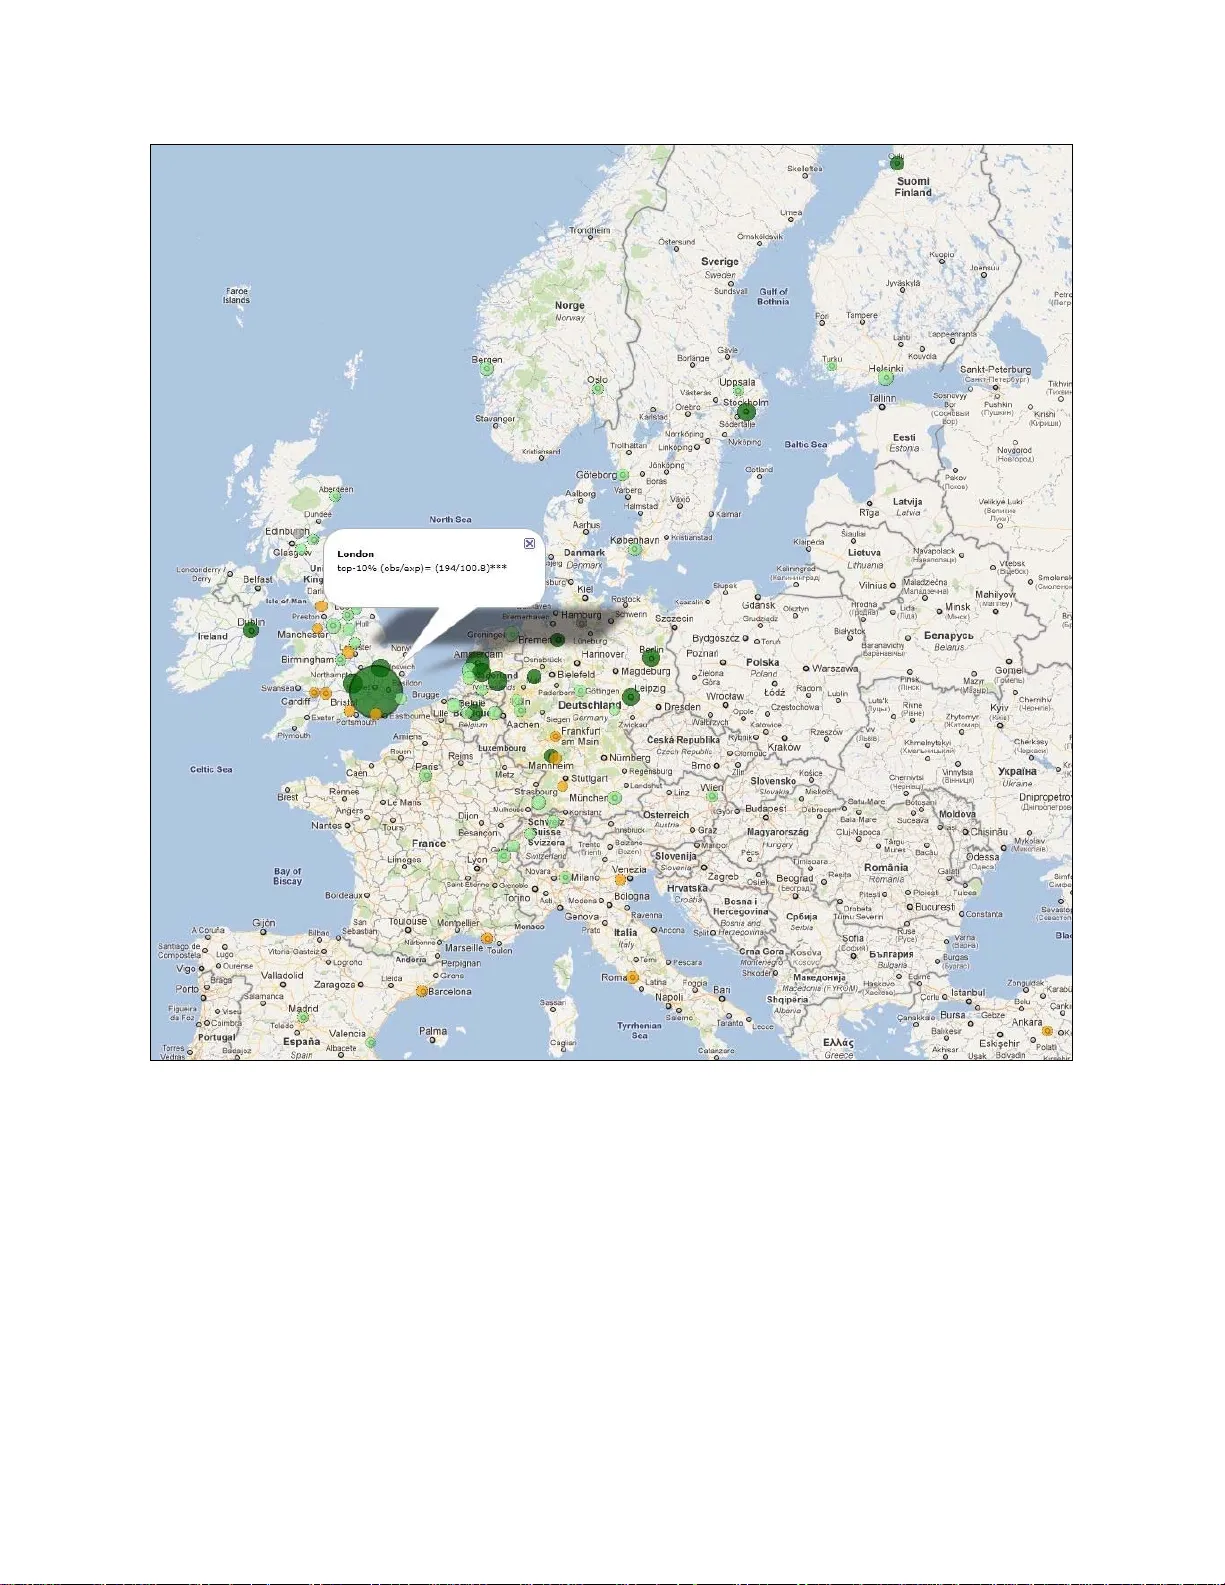
Which are the best cities for psychology research worldwide? A map visualizing city ratios of observed a nd expected numbers of highly-cited papers Lutz Bornmann $ , Loet Leydesdorff § and Günter Krampen & $ Max Planck Society, Hofgartenstr. 8, 80539 Munich, Germany; bornmann@gv.m pg.de. § Amsterdam School of Communication Research (ASCoR), University of Amsterdam, Kloveniersburgwal 48, NL-1012 CX Amsterdam, The Netherlands; loet@leydesdorff.net. & Leibniz-Institute for Psychology In formation, Un iversity of Trier, Germany; krampen@uni- trier.de. Corresponding author: Lutz Bornmann, bornmann@gv.mpg.de. 1 Abstract We present scientometric results abou t world-wi de centers of excellen ce in psychology. Based on Web of Science data, domain-specific excelle nce can be identified for cities where highly cited papers are published. Data refer to al l psychology articles published in 2007 which are documented in the Social Science Citation Index and to their citation frequencies from 2007 to May 2011. Visualized are 214 cities with an articl e output of at least 50 in 2007. Statistical z tests are used for the evaluation of the degree to which an observed number of top-cited papers (top-10%) for a city differs from the number exp ected on the basis of rand omness in the selection of papers. Map visualizing city ratios on significant differences between observed and expected numbers of highly-cited pape rs point at excellen ce centers in citi es at the East and West Coast of the United States as well as in Great Britai n, Germany, the Netherlands, Ireland, Belgium , Sweden, Finland, Australia, and Taiwan. Furtherm ore, positive but non-significant differences in favor of high citation rates are docu mented for so m e cities in the United States, Great Brita in, the Netherlands, the Scandinavian and the Germ an-s peaking countries, Belgium, France, Spain, Israel, South Korea, and China. Scientometric results show co nvincingly that highly-cited psychological research articles come from the Anglo-American countries and some of the non- English European countries in which the number of English-language pub lications has increased during the last decades. Key words: scientometry, citation analysis, bibliometry, psychology, re search, world-wide centers of excellence 2 1 Introduction Since recently we have developed new appr oaches for the spatial visua lization of concentrations of highly-cited papers using overlays to Google Maps. Bornmann, Leydesdorff, Walch-Solimena, and Ettl ( in press ) provided methods to map field- specific centers of excellence around the world using bibliom etric data. These me thods identify and agglomerate excellence in cities where highly-cited pape rs were published. Using colors and sizes for the marks, differences among cities in term s of performance rates can be visualized o n maps. Bornmann and Waltman ( in press ) extended these m ethods and used a new approach with density maps for a spatial examination revealing re gions of excellence. In cont rast to Bornmann, Leydesdorff, Walch-Solimena, and Ettl ( in press ) who focus on cities, this appr oach is intended to visualize broader regions where highly-cited papers were published. A further step in the development of these sp atial visualization m et hods is described in Bornmann and Leydesdorff ( in press ). Our most recent m ethods do not only consider the quantitative numbers of highly-cite d papers, but the observed number of highly-cited papers for a city is tested statistically agai nst the expected number of highl y-cited papers. For example, if authors located in a single ci ty have published 1,000 papers, one would expect for statistical reasons that approximately 100 (that is, 10%) wo uld also belong to the top-10% most-highly cited papers. An observed number of 70 highly-cite d papers for this city may seem as a large number compared to other cities, but the sp ecification of the e xpectation changes the appreciation. This approach has drawn considerable attention in scie nce journalism (see, e.g., http://www.physorg.com/news/2011-03-european-t eam-scientific-relevance-city.html or 3 http://blogs.discovermagazine.com/80beats/2011/03/22/the-best-cam br idge-london-and-worst- moscow-taipei-cities-for-science/). The application of scientometric methods outside the physical and life sciences has sometimes been considered as questionnable ( Moed, 2005 ). Although psychology does not belong to these “hard science” disciplines scient o metric methods have increasing ly been applied for evaluative purposes within the discipline (see, e.g., Endler, Rushton, & Roediger, 1978 ; Krampen, 2008 ; Nosek et al., 2010 ). A possible reason for this de velopm ent is that publication and citation behavior in psychol ogy converges at least in some of its subdisciplines (e.g., experimental psychology, bio- and neuropsyc hology, clinical psychology, social psychology) with the physical and life sciences which resulted during the last decad es in increased publishing in English-language and internationally peer-reviewed journals (see, e.g., Krampen, Huckert, & Schui, in press ; Krampen & Schui, 2011 ). In this study, we provide a map for cities usi ng all 2007 articles contained in the relevant so-called Subject Categories of the Social Sc ience Citation Index (Web of Science, WoS, Thomson Reuters). Although Bornmann and Leydesdorff ( in press ) used psychology data as an example this study is more system atic and one of us as an expert validat ed the results. Bornmann and Leydesdorff ( in press ) based their psychology map only on a sample of all publications from one year; in this study all publications are included. 4 2 Methods Procedure to generate the underlying data The procedure to map the cities of the authors having published the top-10% m ost- highly-cited papers in a certain field is desc ribed in det ail in Bornmann and Leydesdorff ( in press ). In the following, we give a short overview on the procedure. The top-10% of papers with the highest c itation counts in a pub lication set can be considered as highly cited ( Bornmann, Mutz, Marx, Schier, & Daniel, 2011 ). In this study we follow this classification and focus on the to p-10% of papers publis hed in 2007 in psychology, using a citation window from 2007 up to the date of harvesting data from the WoS for this research (May 2011). All papers from 2007 having at least 16 citations each define the top-10% most cited psychology papers in this set. In a first step, all pape rs (n=21,528) with the document type “article” published in 2007 and belongi ng to the subject categories “psychology,” “psychology, applied,” “psychology, biological ,” “psychology, clinical,” “psychology, developmental,” “psychology, educational,” “psychology, experimental,” “psychology, mathematical,” “psychology, m ultidisciplinary,” “psychology, psychoanalysis,” and “psychology, social” were downloaded from th e WoS (Social Science Citation Index). W e restricted the search to articl es (as document types) since (1) the method proposed here is intended to identify excellence at the research front and (2) different docum ent types have different expected citation rates, possibly resulting in non-comparable datasets. After running in subsequent steps various programs which can be copied for free from http://www.leydesdorff.net/topcity/, the output file “ztest.txt” can be uploaded to the webpage of the GPS Visualizer (http://www .gpsvisualizer.com/map_input?form=data) to visualize the content. The file contains the city entries from the W oS data. If more th an a single co-author but 5 with an identical address is provided on a publicati on, this leads to a single city occurrence in the output. If the scientis ts are affiliated with depart me nts in different cities, the different city nam es are used in the programs. The counting of o ccurrences in this st udy (so-called “integer counting”) follows the procedure of how author addresses on publica tions are gathered by Thomson Reuters for inclusion in th e W oS. In the output file “ztest.txt” th e city entries from the WoS data are organized so that aggregated city occurrences can be visua lized on a map, that is, provided with latitudes and longitudes (source of the coordinates: Google). For the maps presented below we zoomed in on Europe and North Am erica. Other regional foci can be stud ied using the full map at http://www.leydesdorff.net/psychology/cities.htm. One can inspect the ratio between observed and expected numbers of excellent papers for a specif ic city by clicking on the respective city node. Since the underlying data of a map from WoS (bibliographic data) and Google (geocoding coordinates; see here the comments on http:// www.gpsvisualizer.com/geocoder/) are error-prone ( Bornmann, et al., in press ), we decided to visualize only citie s (n=214) with an article output in 2007 of at least 50. There is a dang er for cities in the data with a small number of papers that they result from private addresses of researcher s or addresses of hosp itals (but not from psychology departments). Furthermore, the use of a threshold of 50 provides us with a m inimum of five papers expected in the top-10% and t hus confirms with a requirement of using the statistical procedure described in the following. For these 214 cities we could check the validity of the geocoding coordinates. In the case of (systemic) errors still on the m aps, however , we appreciate and will respond to feedback. 6 Statistical procedure The z test for two indepe ndent proportions ( Sheskin, 2007, pp. 637-643 ) is used for evaluating the degree to which an observed number of top-cited papers for a city differs from the value that would be expected on the basis of randomness in the selection of papers ( Bornmann & Leydesdorff, in press ). z is positively signed if the observed nu mber of top papers is larger than the expected num ber and negatively signed in the reverse case. An absolute value of z larger than 1.96 indicates statistical significan ce at the five percent level (p <.05) for the difference between observed and expected numbers of top-cited papers (marked with an asterisk *). In other words, the authors located at this city are outperform ers with respect to scientific excellence in term s of this statistics. Due to the large num ber of city tests being conducted (n =214), especially highly significant p values (p<.01) should be considered as significant a nd interpreted (marked with at least two asterisks **; *** will ind icate p<.001). Using this statistical test, we designed the city circles which are visualized on the map using different colours and sizes. The radii of the circles are calculated by using: | observed value – expected value | + 1 The “+1” must prevent the circles from disappear ing if the o bserved ratio is equal to the expected one. Furthermore, the circles are colour ed green if the observed values are larger th an the expected values. We use dark green if z is statistically signif icant; light green indicates a positive, but statistically non-signifi cant result. In the reverse case that the observed values are smaller than the expected values the circles are red or orange, respectivel y. They are red if the observed value is significantly sm aller than the ex pected value and orange-red if the difference is 7 statistically non-significant. If the expected value equals the observed value a city node is coloured grey. 3 Results Figure 1 shows the location of authors in Eu rope having published hi ghly-cited papers in psychology and the deviations of the observed from the expected num ber of top-cited papers per location (the circle radii) in 2007. If one clicks on a circle (at http://www.leydesdorff.net/psychology/cities.ht m), a frame opens showing the number of observed versus expected values for the respective city, as well as an asterisk indicatin g whether the difference between the values is s tatistica lly significant or not. In Figure 1, for example, London is indicated by a very large dark green circle—the largest green circle in Europe— because of an observed value much larger than ex pected. In the description in a fram e, the large and statistically highly significant difference between the observed (n o =194) and the expected value (n e =100.8) can be retrieved. Further large green circles on the map with a statistically highly significant difference (p<.01) between obs erved and expected values are visib le for Oxford (n o =40, n e =20.0) and Cambridge (n o =32, n e =14.4) in Great Britain as well as Amsterdam (n o =67, n e =40.5). and Nijmegen (n o =42, n e =22.2) in the Netherlands. Significant (p<.05) differences in favor of high citation counts are documented for the cities of Berlin (n o =34, n e =19.4), Bremen (n o =13, n e =5.3), Mannheim (n o =15, n e =6.6), Munster (n o =14, n e =5.6), and Leipzig (n o =29, n e =13.9) in Germany, Dublin in Ireland (n o =18, n e =6.8), Utrecht in the Netherlands (n o =44, n e =25.8), Louvain in Belgium (n o =24, n e =11.6), Stockholm in Sweden (n o =38, n e =20.9), and Oulu in Finland (n o =13, n e =5.0), 8 Furthermore, some more European cities are indicated with light green circ les indicating a positive but statistic al non-signi ficant result. Most of these ci ties for which the relationship between expected and observed cita tions is positive, but not statistically significant are located in Great Britain (i.e., Aberdeen, Birmingham, Ca nterbury, Edinburgh, Lanark, Leeds, Manchester, Nottingham, Sheffield, and Southampton), the Ne therlands (i.e., Groningen, Leiden, Rotterdam, and Tilburg), Germany (i.e., Cologne, Dussel dorf, Freiburg, Gottingen, Jena, and Munich), Belgium (Brussels, Ghent, and Maastrich t), Switz erland (Bern, Geneva, Lausanne, and Zurich), Finland (Helsinki and Turku), Norway (Oslo a nd Bergen), Sweden (Gothenburg and Uppsala) and Spain (Madrid and Valencia). Single cities are located in Aust ria (Vienna), Denmark (Copenhagen) Finland (Helsinki), France (Paris), Ita ly (Milan) , Norway (Bergen), Sweden (Stockholm), and it should be noted that only some of these cities are capitals. The reverse case that the observed value is si gnif icantly smaller than the expected citation value is identified for no European city. However, there are m any more cities which must be described as highly productive (i .e., psychology journal article outpu t in 2007 of at least 50), but for which the relationship between expected and observed citations is ne gative without reaching statistical significance (see orange-r ed circles in Figure 1): Brighton, Bristol, Cardiff, Lancaster, Liverpool, and Southamp ton in Great Britain 1 ; Frankfurt am Main, Heidelberg, and T ubingen in Germany; Padua and Rome in Italy; Barcelona and Granada in Spain; M arseille in France; Athens in Greece; Ankara in Turkey. 1 An orange-re d circle is also fo r Midlands, UK, o n the map, an area comprising central England. Since the author addresses of th e psychology a rticles did not contain f urther city indications, the circle refers t o a broade r area. 9 Figure 1 . Cities in Europe with highly cited articl es in psychology duri ng 2007 (only cities are visualized with a total arti cle output in 2007 of at leas t 50; see for the full map at http://www.leydesdorff.net/psychology/cities.htm) 10 Figure 2 . Cities in the USA with highl y cited articles in psychol ogy during 2007 (only cities are visualized with a total arti cle output in 2007 of at leas t 50; see for the full map at http://www.leydesdorff.net/psychology/cities.htm) Figure 2 shows the corresponding map focusing on the USA. There is a very high concentration of large green circles (indicat ing positive diff erences between observed and expected citation frequencies reaching statisti cal significance) at the East Coast which is completed by some more at th e West cost as well as some in the North-E ast and South-East. The result that the best cities in 2007 for psychol ogy research worldwide are located in the United States is supported further by the large number of light green circles, only a very few orange-red circles, and no red circles in Figure 2. 11 Extending the view to a global one, our results point to the fact tha t in addition to the above described cities in Europe and the United States only a few more cities show significantly positive differences of observed against expected citation f requencies of the psycholog y articles published in 2007: Sydney (n o =45, n e =27.8) and Parkville (n o =19, n e =7.8) in Australia as well as Kaohsiung in Taiwan (n o =26, n e =8.6). Furthermore, light gr een circles indicating a positiv e, but not statistica lly significant diff e rence can be reported for Beer Sheva, Haifa, and Jerusalem (Israel), Adelaide and Melbour ne (Australia), Christchurch and Dunedin (New Zealand), Singapore, Seoul (Taiwan) as well as Beijing (China). Brisbane, Clayton and St. Lucia (Australia), Aichi 2 and Tokyo (Japan) as well as Hong Kong, Auckland (New Zealand), and Tel Aviv (Isr ael) are characterized by orange-red circles indicating a slight negative, but statistically non-s ignificant difference for observed versus expected citation frequencies. Only Mexico City (Mexico), Sa o Paulo (Brasilia), and Taipei (Taiwan) show statistica lly significant negative differences for observed versus expected citation numbers (red circles on the map) indicating an underrepresentation in the gain of top-10% citations. 4 Discussion The maps presented in this pa per allow for an analysis reve aling centers of excellence in psychology around the world using scientometri c data. Based on WoS data, field-specific excellence can be identified in cities where highl y-cited papers were published. Compared to the mapping approaches published h itherto (see the Introduction), our approach is analytically oriented by allowing the assessment of an observed number of excellent papers for a city against 2 Aichi is a prefecture of Ja pan. Most of t he author ad dresses in Aich i belong to Nag oya, the capital of Aichi. 12 the expected number. With this feature, this a pproach can not only identif y the top performers in output but the “true jewels” in psychology. These are cities in which authors are located who publish significantly more top-cite d papers than can be statistica lly expected. Since these cities do not necessarily have a high output of highly-c ited papers, our approach normalizes for size. For the example of psychology, the results pres ented show impressively that in our times most research results are publishe d and cited within the Anglo-Am erican countries: Far most of the best cities for psychology research worldwide are located in the Unit ed States and Great Britain. This is complete d only by some cities in the Nethe rlands, Israel, Australia, the Scandinavian, and the German-speaking countries. In addtion to research resour ces in terms of personnel and fi nance in the United States, it can be assumed that the recen t incentive to publish research results in the English language will contribute to this result pa ttern. At the very latest, in the second part of the 20 th century, English has become the language of the sc iences. Anglicization of the sc iences occurred rapidly in the natural sciences, particu larly in areas of disc overing facts and natural laws, which are not or—at least—only weakly and indirec tly dependent on culture and so cialization, i.e., language, nationality, politics, etc. The A nglicization of the arts and hu manities occurs m ore gradually and less extensively because of its direct dependency and relationships to culture and socialization, e.g., national and cultural specifics of educati onal systems, social no rm s, traditions, etc. Somewhat in between the faster moving natural sc iences and the slower arts and hum anities are the social sciences and, especially, psychology, b ecause its research topics (i.e., behav ior and experience or—more contem porary—action and cognitio n) must be analy zed from both a natural science and a humanities perspec tive ( see, e.g., Krampen, et al., in press ). 13 For example, the psychobiological and neurops ychological determ inants and correlates of behavior and experience are under psychological study as well as the social, cultural and psychodynamic aspects of action an d cognition. Thus, psychological re search can incorporate the natural science methodology as well as the (often m ore qualitative) methodology of the arts and humanities which includes the m ethods (e.g., statisti cs) of the social sciences. For the sake of optimizing the international visibility , reception, and im pact of the results of psychological research in the non-English-speaking countries, fierce discussions in the research communities took and take place. A conclusion was that resear chers should attempt to publish their em pirical findings more frequently in Anglo-American and English-language journals and less frequently—or not at all—in national, non-Englis h journals. In the recent past and to date, similar discussions are taking place in ma ny larger non-English psychology research communities, such as France, Germany, Italy, and Spain. Som e other, however smaller European research communities –Scandinavia and the Netherlands—began contributing to modern psychology increasingly in the Eng lish language after World War II. Despite the advantages of our approach by mapping observed versus expected numbers, we recognize the limitations inherent to these bibliometric exercises ( see here Bornmann & Leydesdorff, in press ): (1) Publications are am ong several types of scientif ic activities. (2) It is not always the case that the addresses listed on the publication reflect the locations wh ere the reported research was conducted. (3) Our method does not consider the different positions of authors on a paper. A paper is counted for a city if at least one co-autho r is located ther e. (4) Citation counts (and thus the cate gorization of publica tions as highly cited) are a function of many variables in addition to scientific quality ( Bornmann & Daniel, 2008 ). Last, but not least, it should be noted that we present a spotlight on all psychology papers published in 2007 which are 14 documented in the Social Science Citation Index covering m any, but not all psychology journals while maintaining its focus on English-language publications. 15 16 References Bornmann, L., & Daniel, H.-D. (2008). What do citati on counts m easure? A review of studies on citing behavior. Journal of Documentation, 64 (1), 45-80. doi: 10.1108/00220410810844150. Bornmann, L., & Leydesdorff, L. (in press). Which ci ties produce m ore excellent papers than can be expected? A new mapping approach—us ing Google Maps—based on statistical significance testing. Journal of the American Society of Information Science and Technology . Bornmann, L., Leydesdorff, L., Walch-Solimena, C., & Ettl, C. (in press ). How to map excellence in the sciences? A mapping appr oach made possible by using Scopus data. Journal of Informetrics . Bornmann, L., Mutz, R., Marx, W., Schier, H ., & Daniel, H .-D. (2011) . A multilevel m odelling approach to investigating the pr edictive validity of editorial decisions: do the editors of a high-profile journal select manuscripts that are hi ghl y cited after publication? Journal of the Royal Statistical Soc iety - Series A (Statistics in Society), 174 (4). doi: 10.1111/j.1467- 985X.2011.00689.x. Bornmann, L., & Waltman, L. (in press). The det ection of “hot regions” in the geography of science: a visualization approach by using density maps. Journal of Informetrics . Endler, N. S., Rushton, J. P., & Roediger, H. L. (1978). Productivity and scholarly impact (citations) of British, Canadian, and Unite d-States departm ents of psychology (1975). [Article]. American Psychologist, 33 (12), 1064-1082. Krampen, G. (2008). The evaluation of university departm ents and their scientists: some general considerations with reference to exemplary bibliometric pub lication and citation analyses for a department of psychology. Scientometrics, 76 (1), 3-21. Krampen, G., Huckert, T., & Schui, G. (in press). Im pact of anglicizing former German-language psychology journals on authorship s and citation frequencies. European Psychologist . Krampen, G., & Schui, G. (2011). Slightly more th an ten years later: Zu Entwicklung und Stand der Internationalisierung der psychologische n Forschung im deutschsprachigen Bereich (On the development and status quo of intern ationalization of psychological research in the German-speaking countries). ZPID Science Information O nline, 11 (2). Moed, H. F. (2005). Citation analysis in research evaluation . Dordrecht, The Netherlands: Springer. Nosek, B. A., Graham, J., Lindner, N. M., Kesebir, S., Hawkins, C. B., Hahn, C., . . . Tenney, E. R. (2010). Cumulative and career-stage citati on impact of social -personality psychology programs and their members. Personality and social Psychology Bulletin, 36 (10), 1283- 1300. doi: Doi 10.1177/0146167210378111. Sheskin, D. (2007). Handbook of parametric and nonparamet ric statistical procedures (4th ed.). Boca Raton, FL, USA: Chapman & Hall/CRC.
Original Paper
Loading high-quality paper...
Comments & Academic Discussion
Loading comments...
Leave a Comment