On the Weakenesses of Correlation Measures used for Search Engines Results (Unsupervised Comparison of Search Engine Rankings)
The correlation of the result lists provided by search engines is fundamental and it has deep and multidisciplinary ramifications. Here, we present automatic and unsupervised methods to assess whether or not search engines provide results that are co…
Authors: Paolo DAlberto, Ali Dasdan
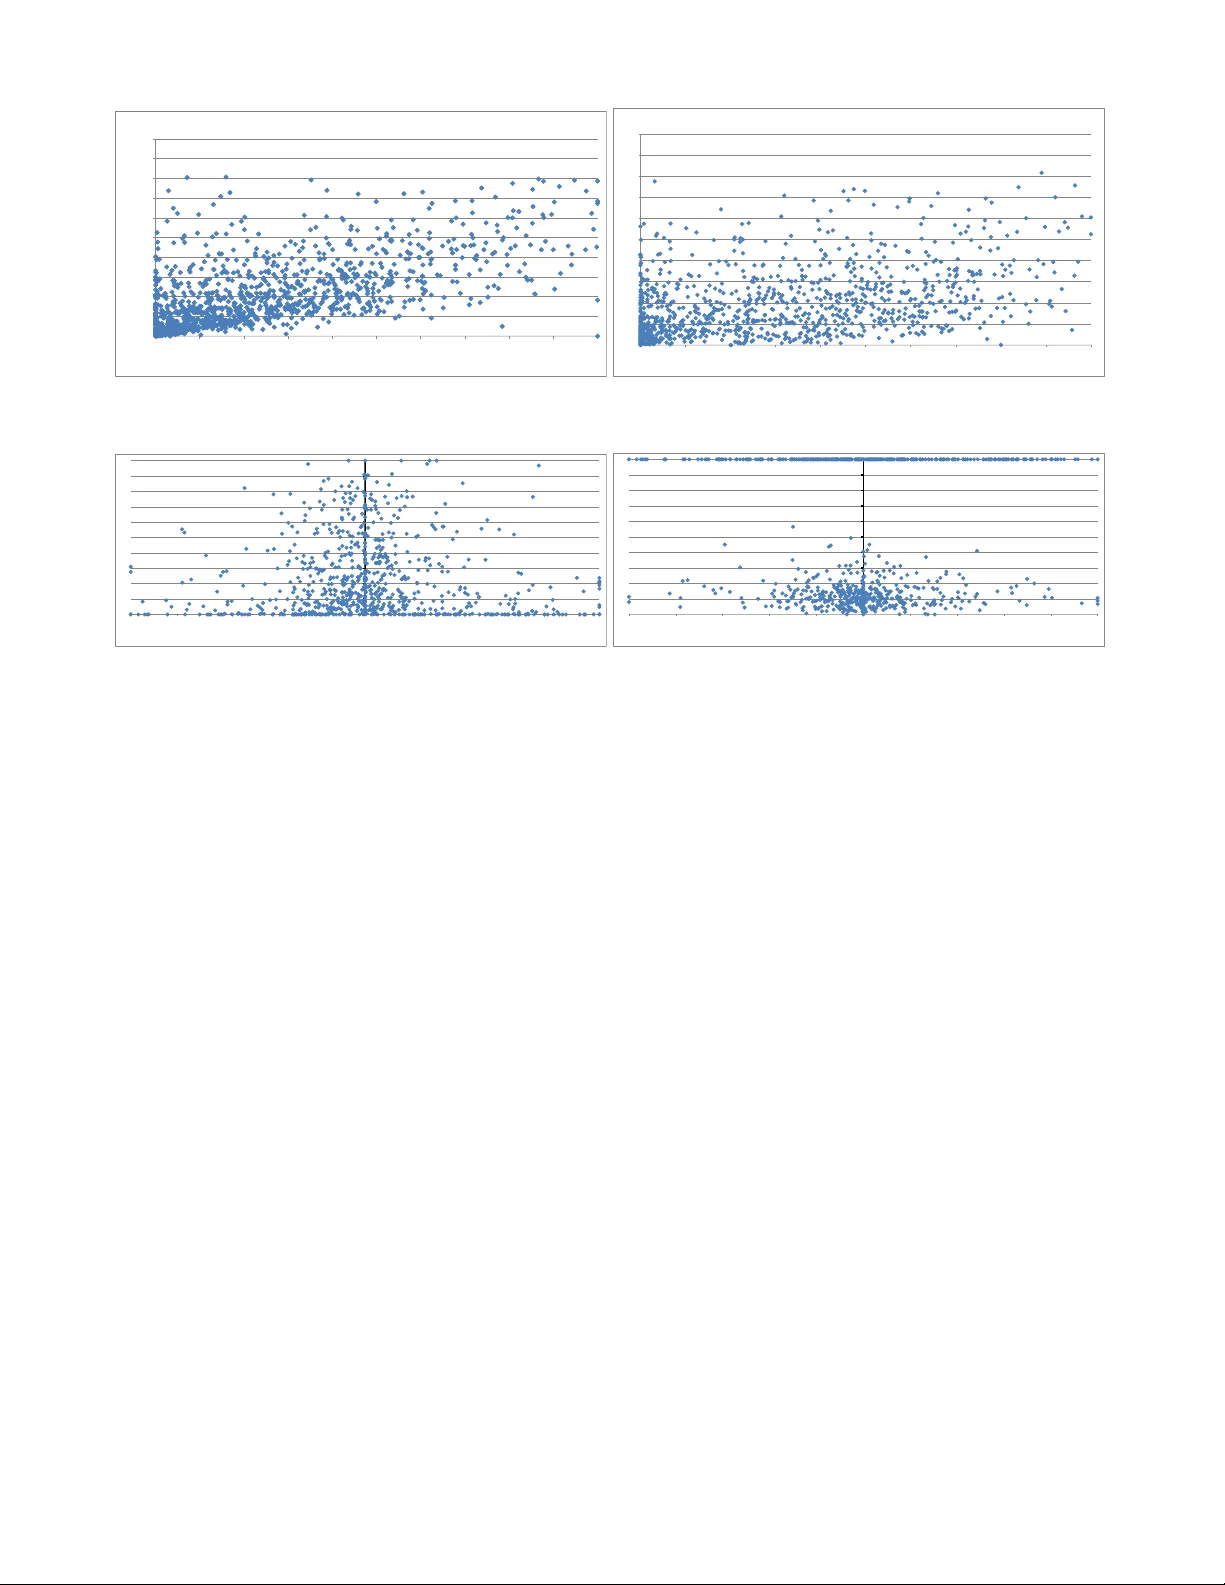
On the W eakenesses of Correlation Measures used f or Sear ch Engines’ Results (Unsuper vised Comparison of Search Engine Rankings) P aolo D’Alber to Y ahoo! Inc. Sunnyv ale, CA, USA pdalber t@yahoo-inc.com Ali Dasdan Knowledge Disco ver y Consulting San Jose, CA, USA ali_dasdan@yahoo .com ABSTRA CT The correlation of the result lists pro vided by searc h engines is fundamental and it has deep and multidisciplinary ramifi- cations. Here, w e presen t automatic and u nsup ervised meth- ods to assess whether or not search engines provi de results that are comparable or correlated. W e ha ve t wo main con tri- butions: First, we pro vide evidence that for more than 80% of the input queries —indep enden tly of their f requency— the t wo ma jor search engines share only three or fewer URLs in their search results, leading to an increasing divergen ce. In this scenario (div ergence), we sho w that even the most ro- bust measures based on comparing lists is useless to apply; that is, the small con tribution by to o few common items will infer no confidence. Second, to ov ercome this problem, w e propose the fist conten t-based measures —i.e., direct com- parison of the con tents from search results; these measures are based on the Jaccard ratio and distribution similarity measures (CDF measures). W e show that they are orthogo- nal to each other (i.e., Jaccard and distribution) and extend the discriminativ e pow er w.r.t. list based measures. Our ap- proac h stems from the real need of comparing searc h-engine results, it is automatic from the query selection to the final ev aluation and it apply to an y geographical mark ets, th us designed to scale and to use as first filtering of query selec- tion (necessary) for supervised metho ds. 1. INTR ODUCTION T oday users ha ve access to man y search eng ines providing services for their web searc h needs but the top three search engines attract almost all user queries and the top searc h- engines provide service to more t han t wo-thirds of the searc h traffic (as today 95%). What is the reason for this situ ation? A ttempting to answer this question and other similar ques- tions, prompted us to the study of the metrics for compar- ing searc h engines. Man y suc h metrics are already a v ailable, suc h as relev ance, cov erage, and presentation (e.g., see the tutorial [ 8 ]). Independent of the metric, w e would expect Permission to make digital or hard copies of all or part of this work for personal or classroom use is granted without fee provided that copies are not made or distrib uted for profit or commercial advantage and that copies bear this notice and the full citation on the first page. T o copy otherwise, to republish, to post on serv ers or to redistrib ute to lists, requires prior specific permission and/or a fee. Copyright 2010 A CM ...$10.00. that, given the same query , if tw o differen t searc h engines return results that are similar in b oth conten ts and order, then the users’ satisfaction should be similar. In this wo rk, w e argue that the previous h yp othesis (i.e., similar results) can be measured; the conclusion (i.e., user satisfaction) is more sub jective and w e show that we m ust hav e a super- vised approach. W e also show that a leading search-en gine is not alwa ys (and should not be alwa ys considered as) the ultimate ref- erence of users’ satisfaction nor quality . 1 Th us, ho w can we judge the similarit y of t wo sets of search results? By representing URLs as sets or lists, w e do take adv antage of these measures: F or example, w e can use the Jaccard ratio for set similarity (without confidence level), w e can use Spearman’s fo otrule and Kendall’s tau for list similarit y (with confidence level and for lists that are p er- m utations and without weigh ts). Ho wev er, differen t search engines pro vide results that are never p erm utations, at best, are sparse lists, and the URLs should not b e treated equally because users pay attention only to the top results (pay lit- tle atten tion to the b ottom results, skip the successiv e re- sult pages and just refine the query). These measures, in com binations with adaptations for sparse lists, are still the state-of-the-art measures and they are the first we used. As w e sho w in this w ork, for more than 80% of the queries the o verlap b et ween tw o sets of searc h results is less than 30%. Unfort unately , This observ ation implies that the top searc h engine do es not subsume the results returned by the next ma jor search engine and URL-based measures are in- sufficien t for comparing different search engines with such a little o verlap. But wh y this small ov erlap affect the qual- it y of URL-based measures? In tuitively and in practice, these measures work well on the common URLs quantifying their difference but the no-common URLs dilute the measu re making them less and less sensitive. W e sho w in this w ork that when the o verlap is low be- t ween the results of tw o search engines, the relative quality (users’ satisfaction) betw een searc h engines v aries widely . W e lo oked at the correlation betw een the URL o v erlap (Jac- card) and the quality of the search results measured b y the discoun ted cumu lative gain (DCG) [ 18 ] (which is a sup er- vised measure because is an editorial–human measure). W e ha ve found that the results v ary widely in quality esp ecially when the o verlap is low: this implies that any search en- 1 If a leading search engine, given a query , pro vides a set of URLs, we do not suggest to pro vide the same set to an y engines. gine can return b etter or worse results dep ending on the query and it is difficult to estimate the outcome reliably . But, once more, wh y this small o verlap affect the qualit y of URL-based measures? Most of the queries will provide uncorrelated v alues: we must use instead precious human resources to distinguish the queries that pro vide different results (i.e., if we could measure the queries that pro vide similar results, we may infer similar users’ satisfaction). W e sho w in this work that con tent-based similarity mea- sures provide more discriminating conclusions than URL- based similarit y measures. A URL is nothing more than a pointer where the information is. The conten ts mu st b e in- terpreted and quan tified as we summarize in the following paragraph: W e propose to use the conten ts from search results landing pages for computing similarity . In particular, w e represent the con tents by a set of terms as well as a distribution of terms and adapt the Jaccard ratio and many distribution- similarit y measures from [ 6 ] (w e present results for the ex- tension of the φ measure [ 21 ] in particular to compute simi- larit y of free-format documents). Ultimately , con tents based measures outp erform lists based measures when applied in an unsup ervised fashion. As practitioners of pairwise correlation measures for search engine comparison and similarit y computation, we are a ware that rank correlation of search engines is used as common example or flagship for the application of list-based correla- tion measures. W e wan t to make a ware the communit y that there are more sophisticated measures. The rest of the paper is organized as follo ws. W e in tro- duce the related work in § 2 and a theo ry of similarit y in § 3 . In § 4 , we presen t how the theory is applied in practice to our choice of similarity measures and their parameters. W e presen t the exp erimen tal metho dology in § 5 and the exp er- imen tal results and our observ ations in § 6 . W e conclude in § 7 . 2. RELA TED WORK In the follo wing, w e will attempt to present a represen- tativ e though limited set of related works in the fields of list correlation, co verage and similarity measures (the three components of our metho d). As suc h, we in troduce previous results in the context of our work in such a wa y to presen t the main differences and then useful references for a deeper in vestigation. Correlation measures hav e a long history and by nature are interdisciplinary . W e can start with the contri butions b y Gauss, Laplace, and Bra v ais; ho wev er, the first refer- ence/in tro duction to the term correlation is by Galton [ 14 ]: where it is crystallized that the v ariation of tw o organs are due to common causes and prop osed a reversion co efficien t, as also discussed b y P earson [ 23 ]. Spearman prop osed the footrule in 1906 [ 28 ] with its dis- tribution in a psyc hology journal, but he turned his atten- tion to rank correlation (comparable rankings for addition and pitch). Concurren tly , the Jaccard ratio was introduced in 1901 [ 16 ] and used for the sp ecies-to-gen us ratio [ 17 ] as introduced in a historical note by [ 19 ]. The ratio was used as measure of v ariety . No probability concept or confidence was in tro- duced . Here, we use the ratio in a similar spirit and without a probability distribution. Kendall in 1938 in tro duced a new measu re of rank correla- tion [ 20 ], based on the count of ho w many sw aps of adjacen t elemen ts are necessary to reduce one list to another as in the bubble sort algorithm. F rom then, differen t versions of correlation measures (with and without weigh ts) hav e b een used and presented (e.g., see [ 29 ] for a short survey). F or example, Kendal’s with weigh ts has b een prop osed b y Siev- ers [ 27 ]. Rank correlation aims at the measure of disarray/concordance especially of short permutations. Its applications range in so man y differen t fields and applications: medicine, psyc hology , wherev er data is incomplete, to capture trends, and rank ag- gregation (e.g., see the reviews in [ 11 , 24 ]). About the rank correlation and their comparison, the lit- erature is quite large, of the recen t publications we ma y cite [ 4 ] and [ 30 ] where the authors introduce a new measure starting from the the Kendall’s co efficient for the informa- tion retriev al field. Closer to our researc h is the comparison of search engines rankings b y Bar-Ilan et al. [ 1 ]: The idea is to set a small set of queries and monitor search engines ranking in time. The query set has a relative high intersection in the result lists (common results at least b et ween Go ogle and Y aho o!). In contrast, we show that our query corpus is large and has wider v ariety . W e conclude this section by citing the w ork by F agin et al. [ 13 , 12 ], where they present v arious distance measures for unw eighted partial lists. These papers are excellen t ref- erences for partial list similarit y measures, their v arious gen- eralizations, their equiv alence, and some results on the com- parison of search engines. In a different work [ 9 ], our pro of of the equiv alence for the w eighted generalizations has the same spirit as the results in these pap ers. The co verage and o verlapping of search engines is a new problem where one of the first attempts to measure such a difference has b een prop osed in 1998 [ 2 ]. The same paper needed a few tools for the similarity of do cumen ts suc h as shingles that w e still use today . Ab out similarity measures of documents, the literature is as large and old as for the correlation measures and it is m ultifaceted: an arbitrary classification is b y signature comparison and by con ten ts. By signature, tw o do cumen ts are compared by summaries or signatures only (e.g., see [ 5 , 3 ]). W e use the Jaccard ratio of the signature because: first, it is common in the field the authors work (e.g., see [ 7 ] for another use); and second it is more a literal comparison than a semantic comparison. W e actually use a signature of up to 1000 items (shingles), thus performing more a conten ts comparison than a probabilistic comparison, reducing to zero false p ositiv es. By c onten ts, w e could use an y bag-of-w ords —e.g., w ord–count histograms— measures, and thus use sto c hastic measures; for example, one of the first measures is prop osed by Kolmogoro v in 1933, but for a recen t survey see [ 6 ]. F or each of these metrics, and esp ecially for the relev ance metrics, the rank of a search result plays an imp ortan t role. The reason is that users expect to find the answer among the top search results, and the probabilit y of a clic k (i.e., the user takes a lo ok at the page) drops quite drastically as the rank increases. In parallel with our w ork (i.e., they cited this work), Kumar and V assilvitskii [ 22 ], present measures so that to take in account the relev ance of a document in conjunction with its rank. Of course, relev ance is (curren tly) a sup ervised feature. 3. A THEOR Y OF SIMILARITY In this section, we provide the mathematical o verview of comparing sets, lists, and distributions. Due to almost a cen tury-old history on the sub ject, our discussion is neces- sarily fo cused on the measures that we use in this study . In the case of list similarit y , w e ha ve a con tribution b y pro- viding a weigh ted generalization of Sp earman’s footrule and Kendall’s tau and prov e their equiv alence for p erm utations and partial lists but we presented separately [ 9 ]. F or list with little ov erlap, we introduce nov el metrics. 3.1 Set Similarity Giv en tw o sets U σ and U π , their intersection and union are defined as U σ ∪ U π = { x | x ∈ U σ or x ∈ U π } (1) and U σ ∩ U π = { x | x ∈ U σ and x ∈ U π } , (2) where elements are included without rep etition. There are man y measures in the literature to compute the similarit y betw een these tw o sets. Among th em, the Jaccard ratio is commonly used. The Jaccard ratio is defined as J ( U σ , U π ) = | U σ ∩ U π | | U σ ∪ U π | , (3) whic h maps to [0 , 1] —i.e., 1 if the sets are iden tical and 0 if the sets hav e no common elements. Example. Given U σ = { a, b, d } and U π = { b, e, f } , we ha ve U σ ∪ U π = { a, b, d, e, f } and U σ ∩ U π = { b } and thus J ( U σ , U π ) = 1 5 = 0 . 2. 3.2 List Similarity As in the measures for comparing sets, there are many measures in the literature to compute the similarit y betw een t wo lists. Among them, Sp earman’s footrule and Kendall’s tau are commonly used. In this pap er, we generalize these measures to inc lude w eights and also to w ork for partial lists as well as p erm utations. By also proving the equiv alence of these tw o measures, we justify our c hoice of Sp earman’s footrule for our list comparison measure. 3.2.1 Rank Assignment Giv en t wo lists σ and π , define σ c = σ − σ ∩ π and π c = π − σ ∩ π and keep the relative order of the remaining elements in σ c and π c the same as they are in the original lists σ and π , resp ectively . Note that σ c and π c bring forth any information only when σ and π are partial lists, because th ey are the empty set otherwi se (i.e., σ and π are permutations). If σ and π are p ermuta tions of length n , the rank of an elemen t i is well defined and equal to σ ( i ) and π ( i ). If these lists are partial lists, the rank of an elemen t is determined as follows: If an element i is in σ but missing from π , then let π ( i ) = n + σ c ( i ) − 1; that is, it is lik e we app end the missing items at the end of the list such as to minimize their displacemen t. Similarly , if an element i is in π but missing from σ , then let σ ( i ) = n + π c ( i ) − 1. No w the rank function σ () and π () infer tw o lists that are the p erm utation of each other. Note that if the lists are of different lengths, w e can alwa ys restate the definition so that if an element i is in π but missing from σ , then let σ ( i ) = | σ | + π c ( i ) − 1. Independently , the resulting lists are p erm utations, thus with the same length. Of course, this rank extension is arbitrary and relative to the pair of lists. In fact, we extend the rank of an element that do es not exist in a list (unknown rank) using its rank from another list (partial kno wn rank). This provides an optimistic ordering that should bias the p ermutat ion-based correlation metrics tow ards positive correlation. This wa y to infer not known rankings is similar/common for comparing top-k lists [ 13 ]. Notice also that we increased the list size; as a function of the increase, any type of list increases, we ma y hav e made the most common correlation measures less sensitiv e. Example. Given σ = ( a, b, d ) and π = ( b, e, f ), we hav e σ 0 = ( a, b, d, e, f ) and π 0 = ( b, e, f , a, d ); that is, t he extended lists. Now, without loss of generalit y , we can substitute the letters to num b ers —i.e., ranks. W e take σ 0 as reference or original p erm utation: σ 0 = ( a, b, c, e, f ) ∼ (1 , 2 , 3 , 4 , 5) and th us we can rewrite π 0 = ( b, e, f , a, d ) as (2 , 4 , 5 , 1 , 3). All measures in tro duced in this pap er are symmetric, thus the result is independent of whether we tak e σ 0 or π 0 as starting point p erm utation. 3.2.2 W eighted Spearman’ s F ootrule The weigh ted Sp earman’s fo otrule [ 28 , 10 ] for partial lists of length n is defined as S w ( σ, π ) = X i ∈ σ ∪ π w ( i ) | σ ( i ) − π ( i ) | . (4) where w ( i ) returns a positive num b er as the weigh t of the elemen t i and the ranks are defined as in § 3.2.1 . The measure S w can b e normalized to the in terv al of [ − 1 , 1] as s w ( σ, π ) = 1 − 2 S w ( σ, π ) P i ∈ σ ∪ π w ( i ) | ( i ) − ( n − i + 1) | (5) where the denominator reaches its maxim um when b oth lists are sorted but in opp osite orders. Both of these equations are v alid if the input lists are permutations. Example. Given σ = ( a, b, d ) and π = ( b, e, f ), we hav e σ 0 = ( a, b, d, e, f ) ∼ (1 , 2 , 3 , 4 , 5) and π 0 = ( b, e, f , a, d ) ∼ (2 , 4 , 5 , 1 , 3) (i.e., we transformed the lists in to p erm utations as we describ ed in the previous example). Then S w = w (1) | 1 − 4 | + w (2) | 2 − 1 | + w (3) | 3 − 5 | + w (4) | 4 − 2 | + w (5) | 5 − 3 | =10 w (6) if we consider w ( i ) constant w and the normalized s w = 1 − 2 w ∗ 10 w ∗ 12 = − 0 . 66 As we can see the denominator grows as n 2 3.2.3 W eighted Kendall’ s T au In context, the unw eighted Kendall’s T au is the num b er of swaps we would p erform during the bubble sort in such a w ay to reduce one p erm utation to the other. As we describ ed the ranks of the extended lists (Section 3.2.1 ), w e can alw ays assume that the first list σ is the identit y (increasing from 1 to n ), and what we need to compute is the num b er of swaps to sort the p erm utation π bac k to the identit y p erm utation (increasing). Here, a weigh t will b e associated to each sw ap. The w eigh ted Kendall’s tau [ 20 , 27 ] for partial lists of length n is defined as K w ( σ = ι, π ) = X 1 ≤ i π ( j )] (7) where [ x ] is equal to 1 if the condition x is true and 0 oth- erwise; also, w e identify the p ermu tation 1 , 2 , . . . , n simply as ι . In practice, if w e would like to sort in increasing or- der the p ermu tation π using a bubble sort algorithm, then K w ( σ = ι, π ) is the cost of each swap . The measure K w can be normalized to the interv al of [ − 1 , 1] as k w = 1 − 2 K w ( σ, π ) P { i,j ∈ σ ∪ π : i 1 and σ i ∈ σ (in the order of the original list, from the highest rank to the low est) (a) I mag e ( σ i ) is the set { v ∈ σ so that J term, 1 ( v , σ i ) ≥ 0 . 5 } . (b) C = ˜ σ ∩ I mag e ( σ i ) is the set of duplicates we ha ve already seen. (c) if | C | > 0 then app end the first element in ˜ σ that is in C to ˜ σ (d) else app end σ i to ˜ σ 2. F or ev ery i ≥ 1 and π i ∈ π (a) I mag e ( π i ) is the set { v ∈ π if J term, 1 ( v , π i ) ≥ 0 . 5 or v ∈ σ if δ term ( v , π i ) = 1 } . (b) C = ˜ σ ∩ ˜ π ∩ I mage ( π i ) is the set of duplicates we ha ve already seen. (c) if | C | > 0 then i. app end the first element in ˜ σ that is in C to ˜ π , if an y (priorit y to the first list) ii. app end the first element in ˜ π that is in C to ˜ π , otherwise (d) else app end π i to ˜ π As a result, duplicate items are relabeled using a single name. Across differen t lists, this is an efficient URL normal- ization (indep endent of the searc h engines) and it increases the l ists in tersection naturally . A side effect, of this lists nor- malization, is that w e are going to flag out duplicates wi thin the same list (and also across lists and especially for the sec- ond list). Then, we need to p enalize any search engine that in tro duce duplicates. W e p ost pro cess the lists so that any subsequen t duplicate within a list will b e substitute with a empt y item ω , which will be taking the ranking p osition but it will not b e used for any comparison. In Section 6.1 and in particular in Fig. 3 , we will show that the wa y w e p erform the URL normalization across lists has very little effect and th us the little o verlap it is not due to the w ay we perform the normalization. P ossible extension. W e could use the J ( ˜ σ ω , ˜ π ω ) to pro vide a normalizing factor for the normalized measure ˜ s w ( σ, π ) so that to extend the range of the measure to orig- inal interv al [-1,1] and thus p ossibly use the fo otrule distri- bution function. This is b ey ond the scope of this work but a natural extension. 6. RESUL TS ON SEARCH RESUL TS SIMI- LARITY W e present our observ ations on searc h results similarit y in terms of the evolutio n of the ov erlap b et ween search results as well as the correlation b et ween o verlap and quality . 6.1 Low Overlap F or a reliable data p oin t in the past, we refer to [ 13 ]. In this reference, pairwise URL-based similarit y of seven searc h engines ov er 750 URLs is computed using a version of Kendall’s tau. It shows that search engines produce quite differen t results except in the case of having the same third part y provider of cra wled con tents. Another confirmation of the low ov erlap comes from [ 1 ] where the ov erlap is found to be “very small” . How ever, both of these studies use very few queries for supporting their findings. Obser v a tion 1. F or mor e than 80% of the queries, the overlap b etwe en two sets of se ar ch r esults is less than 30%. T o supp ort this finding, w e presen t Fig. 3 , where a his- togram for the o verlap in URLs is giv en for four represen- tativ e markets. The x-axis sho ws the Jaccard ratio ( J url, 10 ) as an in terv al for the URLs common to b oth lists and the y-axis shows the frequency of ov erlap. In this figure, markets ha ve similar b eha vior. The highest frequency buck et across markets is that for about 40% of the queries the o verlap as measured b y the Jaccard ratio fall in to the in terv al ( . 1 , . 2] (i.e., betw een 2 and 3 common URLs within top-10 results). If we add up the first three buck ets, then we get what the observ ation claims. Over all markets, less than 5% of the queries hav e more t han 7 common URLs. In F ig. 3 , w e also show that the low o verlap is indep enden t of the duplicate detection measure used from a stricter (on the left) to a lo oser (o n the righ t). Notice that w e performed in parallel for JP and US the same pro cess (of course with queries chosen randomly and indep enden tly as describ ed in Section 5.1 ) only using a different duplicate detection. W e c hose JP and US b ecause in th is example w e ha ve the largest o verlap. This shows that the little o verlap is b ecause of the documents in the lists instead of the wa y w e p erform the tests (inheren t prop ert y of the engines results). Of course, if w e do not apply any duplicate detection, the ov erlap will be even lo wer exaggerating the divergence of the result lists. Previous w orks sho w o verlap only for URL-based compar- isons, so we show a larger div ergence with a stronger ap- proac h for the lists comparisons. Nonetheless, despite our best effort to bring forth more common URLs in the lists, the ov erlap is very limited and decreasing. If we would apply list-based correlation measures on this set as in the previous w orks, we will find little correlation (or un-correlation for that matter) b ecause there is little ov erlap not b ecause there is a real correlation. W e will come bac k to this in Section 6.3 . 6.2 V arying Quality: quality vs. overlap The results in this section require a quality definition and measuremen t. By the quality of a set of search results for a query , we mean the relev ance of the search results in satisfy- ing the information need of the user expressed by the query (e.g., see [ 8 ] for a detailed discussion on relev ance). Among the measures to quan tify the relev ance, Discoun ted Cum ulative Gain (DCG) [ 18 ] seems to be the measure pre- ferred b y most search engines. F or a query set Q , each with n ranked search results, DCG is defined as D C G n = 1 | Q | X q ∈ Q D C G n ( q ) and DC G n ( q ) = n X r =1 g ( r ) d ( r ) (10) where g ( r ) is the gain for the document for the URL at rank r and d ( r ) = lg (1 + r ) is the discoun ting factor to bias to- w ards top ranks. Typica lly , g ( r ) = 2 j − 1 − 1 where j is equal to 5, 4, 3, 2, or 1 for the judgmen ts of Perfect, Excellent, Goo d, F air or Bad results, resp ectiv ely . The judgments are from editors binding the query in tent to the result lists and their do cumen t con tents. In this section, we used ab out 800 queries selected uni- formly at random from user queries submitted to our search engine (some are identical queries at different times). F or eac h query , we scrap ed the top 5 search results for each of the ma jor search engines. W e define a relative measure b etw een tw o search engines S E 1 and S E 2 as r DC G 5 ( q ) = D C G S E 1 5 ( q ) − DC G S E 2 5 ( q ) max( D C G S E 1 5 ( q ) , DC G S E 2 5 ( q )) (11) where − 1 ≤ r DC G 5 ( q ) ≤ 1 and D C G S E i 5 is the DCG for S E i with i = 1 , 2 (where w e leav e the true identit y of the searc h engine anonymous for ob vious reasons). Armed with these definiti ons and results, w e can state the relationship b et ween qualit y and ov erlap. Obser v a tion 2. When the overlap is low b etwe en the r e- 0" 10" 20" 30" 40" 50" 0" (0,0.1]" (0.1,0.2]" (0.2,0.3]" (0.3,0.4]" (0.4,0.5]" (0.5,1]" Frequency"(%)" Jaccard" JP" FR" US" TW" 0" 10" 20" 30" 40" 50" 0" (0,0.1]" (0.1,0.2]" (0.2,0.3]" (0.3,0.4]" (0.4,0.5]" (0.5,1]" Frequency"(%)" Jaccard" JP" US" Figure 3: Number of queries and equiv alen t num b er of common results expressed as the Jaccard ratio of the URLs J U R L, 10 : left, duplicate using J term, 1 ( , ) only (shingles); righ t, using b oth J term, 1 ( , ) or δ term ( , ) (lo ose comparison) for only US and JP where we hav e more intersection to start with. The bars are in the same order as the legend. Note the w ay w e compare duplicates b et wee n lists do es not c hange the divergence of the result lists ov erall. !" !#$" !#%" !#&" !#'" !#(" !#)" !#*" !#+" !#," $" -$" -!#+" -!#)" -!#'" -!#%" !" !#%" !#'" !#)" !#+" $" ./0123$!4" 1567895":;<(" !"# !$%&# !$%'# !$%(# !$%)# $# $%)# $%(# $%'# $%&# "# !"# !$%&# !$%'# !$%(# !$%)# $# $%)# $%(# $%'# $%&# "# *+,-./0123##4++5,6/2# 72/.892#:;<= # Figure 4: T op: J url, 5 vs. DC G 5 with greatly v arying DCG when the ov erlap is lo w; b ottom: s url, 5 vs. D C G 5 with greatly v arying DCG at no correlation. sults of two se ar ch engines, the r elative quality b etwe en se ar ch engines varies widely. In Fig. 4 , we presen t a comparison betw een the relativ e D C G 5 , s url, 5 (footrule) and J url, 5 (common intersec tion). There is no correlation (not up on intended) betw een DCG and fo otrule. How ever, w e can say that when the common in tersection b et we en the result list is large enough there is no particular difference of DCG v alues and th us the searc h engines seem correlated and equiv alen t (i.e., having a large n umber of common URLs and the ed itors graded these URLs with similar scores based on conten ts and ranking, we can safely infer that the engines pro vide the same URLs and with the same ranking). In other words, lo w o verla p does not necessarily mean that one of the searc h engines is con- sisten tly better at the search results quality . T o supp ort this finding, we presen t Fig. 4 , where the scat- ter plot b etw een the DCG and t w o similarity measures is giv en. The x-axis shows the relative DCG measure and the y-axis sho ws the Jaccard ratio (to p) and normalized footrule (bottom). 0" 20" 40" 60" 80" 100" 120" [‐1,‐0.8)" [‐0.8,‐0.6)" [‐0.6,‐0.4)" [‐0.4,‐0.2)" [‐0.2,0)" [0,0.2)" [0.2,0.4)" [0.4,0.6)" [0.6,0.8)" [0.8,1]" Number'of'queries' DCG5'' Figure 5: Distribution of the relativ e DCG when the o verlap is low: with Jaccard less than 0.2. W e ha v e three observ ations: First, most of the queries ha ve low ov erlap as measured by the Jaccard ratio; second, most of the queries fall in to the narro w interv al [-0.2, 0.2] as measured by the normalized fo otrule; third, for most of the queries the DCG v alue is orthogonal to both measures. One application of list based measures is the determination of query with little ov erlap to filter/reduce the list of queries that really need editorial judgments. In Fig. 5 , w e provide additional evidence for our third observ ation (i.e., for most of the queries the DCG v alue is orthogonal to b oth measures). In this figure, we presen t the distribution of the r DC G 5 ( q ) ov er all queries q such that the Jaccard ratio is less than 0.2; that is, with low ov erlap (1 in 5 common results). The existence of fat tails at both ends of the distribution implies a large range of v alues for quality as measured by the DCG (most likely the qualit y of the search results do es not c ome from the common results). 6.3 Results on Similarity Measures W e conclude the exp erimen tal section b y stating our last observ ation, which is one of the main motiv ations for this w ork. Obser v a tion 3. Due to the low overlap b etwe en se ar ch r esults, c ontent-b ase d similarity me asur es pr ovide mor e dis- criminating c onclusions than URL-b ase d similarity measu r es do. W e are going to break do wn the discussion into four parts: the relationship of conten t-based and URL-based Jaccard ratios (i.e., differen t wa ys of measuring ov erlap), URL- and con tent-based measures and normalized Sp earman’s fo otrule (i.e., ov erlap vs. rank correlation), the effect of conten ts size on the similarit y outcome (i.e., parameter sensitivit y of conten t-based measures), and the relationship betw een con tent-based measures and relative DCG (i.e., ov erlap vs. qualit y). ‐1# ‐0.8# ‐0.6# ‐0.4# ‐0.2# 0# 0.2# 0.4# 0.6# 0.8# 1# 0# 0.1# 0.2# 0.3# 0.4# 0.5# 0.6# 0.7# 0.8# 0.9# 1# Normalized#footrule# Jaccard# JP## ‐1# ‐0.8# ‐0.6# ‐0.4# ‐0.2# 0# 0.2# 0.4# 0.6# 0.8# 1# 0# 0.1# 0.2# 0.3# 0.4# 0.5# 0.6# 0.7# 0.8# 0.9# 1# Normalized#footrule# Jaccard# US## Figure 6: Comparison of the URL-based Jaccard ratio and normalized fo otrule: J url, 10 vs s url, 10 6.3.1 URL-based Jaccar d ratio vs. normalized footrule In practice, here w e presen t ho w w eak lists based corre- lation measures are and we show in a plain cross product (scatter plot) that little correlation (or lack of correlation thereof ) is b ecause the lists hav e really small intersection. In Fig. 6 , we show the relationship b et ween the ov erlap of the URLs and the normalized fo otrule for t wo markets US and JP . As so on as the ov erlap of the lists decreases, the range of the normalized footrule also shrinks. Thus, at lo w o verlap, list similarity measures will b e less meaningful and less discriminating. Even the p o wer of the URL-based Jac- card ratio decreases, helping supp ort the need for con tent- based measures. If we wan ted to use Sp earman’s fo ot rule as correlation measure w e would b e tempted to assume there is little cor- relation b etw een the lists even in the most fav orable cases. Actually , we hav e halved the range of the measure and thus what we really miss is the confidence in the measure more than missing a correlation measure. Thus, these measures ha ve little or no discriminativ e p o wer. List-based measure are not suitable for neither automatic nor unsup ervised meth- ods. 6.3.2 Content-based vs. URL-based J accar d ratios Let us refresh our memory about these conten ts-based measures: URL-based Jaccard ratio is computed b y first normalizing the URL name b y duplicate detection. Then the URL results are taken as list and the intersection/union ratio is computed. The duplicate detection is computed by using shingles or w ord histograms. If a threshold is reached, then the tw o URLs are considered iden tical and only one URL will be placed on both p ositions. F or con tents-based Jaccard ratio we tak e the shingles of all do cumen ts in a re- sults list up to a sp ecific rank and then w e compute the in tersection/union ratio of b oth lists. W e ma y summarize 0" 0.1" 0.2" 0.3" 0.4" 0.5" 0.6" 0.7" 0.8" 0.9" 1" 0" 0.1" 0.2" 0.3" 0.4" 0.5" 0.6" 0.7" 0.8" 0.9" 1" J(term)" J(url,10)" JP" J(term,5)* J(term,10)* J(term,1)* 0" 0.1" 0.2" 0.3" 0.4" 0.5" 0.6" 0.7" 0.8" 0.9" 1" 0" 0.1" 0.2" 0.3" 0.4" 0.5" 0.6" 0.7" 0.8" 0.9" 1" J(term)" J(url,10)" US" J(term,5)* J(term,10)* J(term,1)* Figure 7: Comparison of con ten t-based and URL- based Jaccard ratios J term,n and J url, 10 at differen t con ten ts sizes. that the former emphasizes the discrete nature of the list, instead the latter emphasizes the full con tents of the do cu- men ts in the lists. In Fig. 7 , we show the relationship b etw een the con tent- based Jaccard ratios J term,n for conten ts from top- n search results for n = 1 , 5 , 10 and the the URL-based Jaccard ratio J url for the US and JP markets. It seems that a single search result is to o few to show similarit y based on conten ts; that is, taking the top results is a hit/miss measure and th us v ery limited. Ho wev er, if we use the first five search results we ha ve enough i nformation to reac h the whole similarit y range (i.e,. [0,1]). The abilit y to pro vide enough information in only the first fiv e results is probably because of the emphasis of search engines to return the key results at the top. Notice that Fig. 7 (and Fig. 6 ) sho w the same information about the URL-based Jaccard presented in Fig. 3 but we did not create bins. W e wan t to show that even though t we w anted to collect 10 URLs per engines, there are queries for whic h we hav e less than 10. W e can see that J url,n is in clusters (i.e., close vertical lines) ha ving the same n umber of common URLs but differen t n umber of search results. 6.3.3 Content-based measures vs. normalized footrule No w, we finally presen t the comparison b etw een conten t- based measures such as J term,k and φ term,k v ersus the most common correlation measures. The goal is to exp ose the differen t information, presented as quan titativ e v alue by the t wo different t yp es of measures. In Fig. 8 , w e presen t the relationship betw een the con tent- based measures and the normalized footrule for the US mar- k et —for whic h we hav e the largest o verlap in our experi- men ts. This is to sho w how small the range of the normalized footrule is and, in contrast, ho w the range of the conten t- based measure offers more v ariety and insigh ts. It also shows that these effects greatly magnify when the ov erlap is really lo w, whic h we ha ve sho wn is increasing common. W e sho w that the normalized fo otrule will b e indifferent ‐1# ‐0.8# ‐0.6# ‐0.4# ‐0.2# 0# 0.2# 0.4# 0.6# 0.8# 1# 0# 0.1# 0.2# 0.3# 0.4# 0.5# 0.6# 0.7# 0.8# 0.9# 1# Normalize#footrule# phi(term,10)- phi(term,5)- phi(term,1)- ‐1# ‐0.8# ‐0.6# ‐0.4# ‐0.2# 0# 0.2# 0.4# 0.6# 0.8# 1# 0# 0.1# 0.2# 0.3# 0.4# 0.5# 0.6# 0.7# 0.8# 0.9# 1# Normalized#footrule# J(term,10)+ J(term,5)+ J(term,1)+ Figure 8: Comparisons for the US market; top: the distribution measure φ term,n vs. normalized footrule s w ( ur l, 10) ; b ottom: con ten t-based Jaccard ratio J term,n vs. normalized fo otrule s w ( ur l, 10) . to cases where the first fiv e do cumen ts in the lists are al- most p erfect duplicates ( s w ( ur l, 10) ∼ 0 and J term, 5 = 1). First, let us recall what J term, 5 means: tak e an engine list and consider only the first 5 URLs, take the con tents of the documents as shingles (10 words eac h shingle without rep eti- tion) and create a set, and now p erform the Jaccard ratio of the sets so determined. Let us interpret this situation: b oth engines give the same con tents in the top of the results, it could be the same URLs (but i t is not really important). On one side, this will provide the same exp erience to the user, w e see intuitiv ely that the engines are highly correlated for the query; on the other side, the fo otrule measure do es not pro vide any information, despite our b est efforts to find com- mon item s in the lists. In suc h a case, ha ving a 10 URLs lists (20 total) is large enough that if only 3-4 URLs are really common and high in the result list, the fo otrule is dominated b y the denominator and the contribution in the numera tor is mixed. As a note, the size of one document, may dominate the J term, 5 v alue —even when few do cumen ts hav e common con tents. This is a natural weig ht and, in practice, con tents based measures emphasizes the literal size of the common documents. So we ha ve a correlation measure for which w e can interpret the v alue in a more in tuitive fashion and it is more discriminative. Let us tak e a look at the range of the φ term,n measure and let us recall what the measure means: take the first 5 URLs of eac h lists (e.g., n = 5), we create an histogram w ord–count b y the conten ts of the do cumen ts, then we com- pare the histograms by creating a cum ulativ e distribution function (CDF) and apply the formula Eq. 9 . If we use a lexicographical sort and a natural merge algorithm of the w ords, we can alwa ys create a CDF out of the histograms. W e present the ra w distance and the function has a nat- ural range b et ween 0 and 2 —where 0 means equality , 2 difference, but as a function of m the n umber of different w ords the real statistically difference may be as small as 0.2). In this figure, it seems that the function has a lim- ited range but for this function we hav e a significance v alue or p-v alue. There are tw o reasons: First, we require at a minim um 30% o verlap before to p erform any comparison (from histograms to CDFs); otherwise w e state a distance of 1 and p-v alue of 1. Second, for this distance function (and for all the sto c hastic distance function we used in this w ork) we do ha v e a statistical confidence level or p-v alue, whic h offers further granularit y for the distance measure as described ab ov e. The fo otrule confidence will not adjust to the different range, but we ha ve reform ulated the problem in suc h a wa y that w e can use a statistically sound approach with a confidence lev el making this measure more discrim- inativ e and suitable for a automatic approac h (practically independent of the measure range). 6.3.4 J accard ratio with differ ent contents sizes In practice, we are introducing a correlation measure that return a v ector of v alues: w e can compute n v alues of the con tents-based Jaccard ratio J term,n , here we presented three v alues for n = 1 , 5 , 10. Here, we show ho w to use the vector of v alues to find rank correlation problems. In Fig. 9 , w e sho w a scattered plot for the US and JP mark ets for the cont ent-based Jaccard ratios for different con tents sizes n = 5 , 10. The relativ ely strong correlation is evident from these plots. Intuiti vely , if there is a strong J term, 5 , that is the results lists are top he avy , having lots of common conten ts, this will con tribute to J term, 10 as well. The most in teresting cases are where J term, 10 > J term, 5 , that is the tail of the result lists are richer of common con- ten ts than the heads. F or example, with the simple rule that J term, 5 < J term, 10 and J term, 10 > 0 . 2, w e ha ve found qu eries for whic h ranking of one o f the searc h engines had problems. Let us elab orate this. If J term, 5 < J term, 10 w e can see t wo possible cases. First, the tail of the results list has conten ts common to the head of the other, this is the classic case of in verse correlation. Second, the tails of b oth lists hav e the common conten ts, thu s the heads are different, this is a case of un-correlated results. In b oth cases, the queries exploit differen t engine rankings. A sup ervised approac h may take these queries and v erify whether w e return the better results (editorial test) or otherwise wh y our system did not return the other engine results. Eac h suc h case provides a w ay to automatically generate training data or regression tests for mac hine-learned ranking systems. Think ab out this pro cess of query selection as a filtering so that only the queries re- quiring editorial judgment are necessary and then can be used for training of ranking/relev ance systems. 6.3.5 Overlap by Jaccar d ratio vs. r esults quality by DCG W e conclude with a final ev aluation of the conten t-based measures ( φ term, 10 and J term, 10 ) with the conten ts quality as measured by DCG5. W e present our exp erimen tal results in Fig. 10 and the conclusions are simila r to what we ha ve found previously and presen ted in Fig. 4 : DCG5 v aries greatly when the ov erlap is lo w (URL or con tents). In other w ords, the results qualit y can cov er the whole range from p erfect to bad results when the o verlap betw een the results is low. This result also just i- 0" 0.1" 0.2" 0.3" 0.4" 0.5" 0.6" 0.7" 0.8" 0.9" 1" 0" 0.1" 0.2" 0.3" 0.4" 0.5" 0.6" 0.7" 0.8" 0.9" 1" J(term,10)" J(term,5)" US" 0" 0.1" 0.2" 0.3" 0.4" 0.5" 0.6" 0.7" 0.8" 0.9" 1" 0" 0.1" 0.2" 0.3" 0.4" 0.5" 0.6" 0.7" 0.8" 0.9" 1" J(term,10)+ J(term,5)+ JP+ Figure 9: Correlation b et ween conten t-based Jaccard ratios with con tents from top-5 and top-10 searc h results: J term, 5 vs. J term, 10 ; left: the US market; righ t: the JP market. !" !#$" !#%" !#&" !#'" !#(" !#)" !#*" !#+" !#," $" -$" -!#+" -!#)" -!#'" -!#%" !" !#%" !#'" !#)" !#+" $" ./01234$!5" 61789:1";<=(" 0" 0.1" 0.2" 0.3" 0.4" 0.5" 0.6" 0.7" 0.8" 0.9" 1" ‐1" ‐0.8" ‐0.6" ‐0.4" ‐0.2" 0" 0.2" 0.4" 0.6" 0.8" 1" phi(term,10)" Rela;ve"DCG5" Figure 10: Correlation b et w een conten t-based measures and relativ e DCG; left: the Jaccard ratio J term, 10 vs. relativ e DCG; right: the distribution measure φ term, 10 vs. relativ e DCG. fies that lo w o verlap betw een tw o ma jor searc h engines do es not necessarily make one of them also better in results qual- it y but clearly low ov erlap does not mean little correlation (or in verse correlation), it means that w e can infer very little about the correlation of the results. W e w ould like to conclude this section and the experi- men tal result section noting that —at the least— we hav e presen ted correlation measure that are more discriminativ e than the existing list-based correlation measures for search engine results. These measures can b e certainly used as a fil- tering tool so that to find the queries that really need sup er- vised approaches or used as testing to ols for the debugging of a search engine pip eline. 7. CONCLUSIONS W e present ho w to measure searc h-results ov erlap using URL-based and conten t-based measures, with conten ts de- riv ed from the do cumen ts at the landing pages of the URLs in search results. W e extend such measures to carry weigh ts and also work for permutations as w ell as partial lists. In a separate and concurrent work [ 9 ], we prov e the equiv a- lence of the weigh ted generalizations of tw o well-kno wn list similarit y measures. W e sho w that the o verlap b etw een the results o f tw o ma jor searc h engines is fairly low (for o ver 80% of the queries, no more than three URLs). This result makes the application of URL-based measures difficult, thereb y increasing the im- portance and applicabilit y of conten t-based measures. W e also show that low o verlap do es not necessarily indicate the superiority of one search engine ov er another in terms of re- sults qualit y; the quality can v ary greatly along the qualit y range when the o verlap is low. W e presen t ma ny results on the sensitivi ty of the prop osed measures to differen t parameters (e.g., n umber of items in the lists) as we ll as the relationships b etw een the measures (list-based vs. con tents-based measures). W e also briefly discuss ho w these measures can be used to automatically create regression tests (i.e., filtering out query for which t wo engines do w ell already) or training data for mac hine-learned ranking systems (i.e., filtering the query that need editorial judgmen t). In turn, this automatic selection of queries can be used for the debugging of the searc h engine pip eline and automatic classification could b e obtained b y the engineer- ing team. Acknowledgments Under the ho o d of this mac hinery , w e used sev eral comp o- nen ts and consulted very capable engineers: Suresh Lokia for the set of queries, Kexiang Hu for the scraping to ol, Marcin Kadluczk a for the high level fetc hing system for the retriev al of the do cumen ts in real time, and Amit Sasturk ar and Sw apnil Ha jela for the word-view pip eline and do cu- men t signature. W e also thank San tanu Kola y for useful discussions on v arious asp ects of this work and Ravi Kumar for discussions on the weigh ted form of Kendall’s tau. Acknowledgments Under the ho o d of this mac hinery , w e used sev eral comp o- nen ts and consulted very capable engineers: Suresh Lokia for the set of queries, Kexiang Hu for the scraping to ol, Marcin Kadluczk a for the high level fetc hing system for the retriev al of the do cumen ts in real time, and Amit Sasturk ar and Sw apnil Ha jela for the word-view pip eline and do cu- men t signature. W e also thank San tanu Kola y for useful discussions on v arious asp ects of this work and Ravi Kumar for discussions on the weigh ted form of Kendall’s tau. 8. REFERENCES [1] J. Bar-Ilan, M. Mat-Hassan, and K. Levene. Metho ds for comparing rankings of search engine results. Comput. Netw. ISDN Syst. , 50(10):1448–1463, 2006. [2] K. Bharat and A. Bro der. A technique for measuring the relative size and ov erlap of public web searc h engines. Comput. Netw. ISDN Syst. , 30(1-7):379–388, 1998. [3] A. Bro der. On the resem blance and containmen t of documents. In Pr o c. Compr ession and Complexity of Se quenc es (SEQUENCES) , page 21. IEEE, 1997. [4] B. Carterette. On rank correlation and the distance betw een rankings. In Pr o c. of Conf. on R ese ar ch and Dev. in Info. R etrieval (SIGIR) , pages 436–443. A CM, 2009. [5] Moses S. Charik ar. Similarit y estimation techniques from rounding algorithms. In Pr o c. Symp. The ory of Computing (STOC) , pages 380–388. ACM, 2002. [6] P . D’Alberto and A. Dasdan. Non-parametric information-theoretic measures of one-dimensional distribution functions from contin uous time series. In Pr o c. Int. Conf. Data Mining (SDM) , pages 685–696. SIAM, 2009. [7] A. Dasdan, P . D’Alb erto, S. Kolay , and C. Drome. Automatic retriev al of similar con tent using search engine query interface. In Pr o c. Int. Conf. Info. and Know le dge Management (CIKM) . A CM, 2009. [8] A. Dasdan, K. Tsioutsiouliklis, and E. V elipasaoglu. W eb search engine metrics: Direct metrics to measure user satisfaction. T utorial in the 18th Int. Conf. W orld Wide W eb (WWW), 2009. [9] Ali Dasdan and Paolo D’Alb erto. W eigh ted generalization and equiv alence of Sp earman’s fo otrule and Kendall’s tau for comparing partial and permutation rankings. Submitted for pubblication. [10] P . Diaconis and R. Graham. Sp earman’s fo otrule as a measure of disarray . J. R oy. Statistics So c. , 39(Ser. B):262–268, 1977. [11] C. Dwork, R. Kumar, M. Naor, and D. Siv akumar. Rank aggregation metho ds for the web. In Pr o c. Int. Conf. World Wide Web (WWW) , pages 613–622. A CM, 2001. [12] R. F agin, R. Kumar, M. Mahdian, D. Siv akumar, and E. V ee. Comparing and aggregating rankings with ties. In Pr o c. Symp. Principles of Datab ase Syst. (PODS) , pages 47–58. ACM, Jun 2004. [13] R. F agin, R. Kumar, and D. Siv akumar. Comparing top k lists. SIAM J. Discr ete Math. , 17(1):134–160, 2003. [14] F. Galton. Co-relations and their measurement, c hiefly from anthropometric data. Pr o c. the R oy. So c. of L ondon , 45:135–145, 1888–1889. [15] M. R. Henzinger. Finding near-duplicate web pages: a large-scale ev aluation of algorithms. In Pr o c. of Conf. on R ese ar ch and Dev. in Info. R etrieval (SIGIR) , pages 284–291. ACM, Aug 2006. [16] P . Jaccard. Distribution de la flore alpine dans le bassin des Dranses et dans quelques r ´ egions voisines. Bul letin del la So ci ´ et ´ e V auOPTdoise des Scienc es Natur el les , 37:241–272, 1901. [17] P . Jaccard. ´ etude comparativ e de la distribution florale dans une portion des Alpes et du Jura. Bul letin del la So ci´ et´ e V auOPTdoise des Scienc es Natur el les , 37:547–579, 1901. [18] K. J ¨ arv elin and J. Kek ¨ al ¨ ainen. Cumulated gain-based ev aluation of IR techniques. AC M T r ans. Inf. Syst. , 20(4):422–446, 2002. [19] O. Jarvinen. Species-to-genus ratios in biogeography: A historical note. Journal of Bio ge ogr aphy , 9(4):363–370, Jul 1982. [20] M. G. Kendall. A new measure of rank correlation. Biometrika , 30(1–2):81–93, Jun. 1938. [21] D. Kifer, S. Ben-David, and J. Gehrk e. Detecting c hange in data streams. In Pr o c. Int. Conf. V ery L ar ge Data Bases (VLDB) , pages 180–191. Morgan Kaufmann, Elsevier, Aug 2004. [22] Ravi Kumar and Sergei V assilvitskii. Generalized distances b et ween rankings. In Pr o c e e dings of the 19th international c onfer enc e on World wide web , WWW ’10, pages 571–580, New Y ork, NY, USA, 2010. ACM. [23] K. Pearson. Notes on the history of correlation. Biometrika , 13:25–45, 1920–1921. [24] D. Sculley . Rank aggregation for similar items. In Pr o c. Int. Conf. Data Mining (SDM) , 2007. [25] G. B. Shieh. A weigh ted k endall’s tau statistic. Statist. Pr ob ab. L ett. , 39:17–24, 1998. [26] G. B. Shieh, Z. Bai, and W. Y. Tsai. Rank tests for independence - with a weigh ted contamination alternativ e. Statistic a Sinic a , 10:577–593, 2000. [27] G. L. Sievers. W eighted rank statistics for simple linear regression. J. of the Americ an Stat. Asso c. , 73(363):628–631, Sep 1978. [28] C. Sp earman. A fo otrule for measuring correlation. British J of Psycholo gy , 2:89–108, 1906. [29] A. T arsitano. Nonlinear rank correlation. W orking paper, 2002. [30] E. Yilmaz, J. A. Aslam, and S. Rob ertson. A new rank correlation co efficien t for information retriev al. In Pr o c. of Conf. on R ese ar ch and Dev. in Info. R etrieval (SIGIR) , pages 587–594. ACM, 2008. APPENDIX Review ers’ Commen ts The communit y has sp ok en about and against this work. Here we share the anon ymous con- siderations without our reply . Enjo y the drama. APPENDIX Review ers’ Commen ts Journal 1 Dear Paolo, Thanks for asking. Unfortunately , after ha ving tried quite a few potential —- reviewers, we are not able to get even one referee rep ort. Most of them declined to review, and some of them suggest this pap er is not well within the scope of —-. The guardian editors of this work hav e ev aluated the situation, they are con vinced this pap er is most likely not interesting to —- readers, by lo oking at especially the people and journals/conferences men tioned in their related w ork. they consider this work is more web search than w eb engineering. Therefore, it should b e the best in terests of the authors to find some other better suitable journal to this work. W e return this paper back to you as the author, and wish you goo d luc k somewhere else. Regards, W ei for —- Editorial APPENDIX Review ers’ Commen ts Journal 2 Second Round. Dear Dr. Paolo D’Alberto: W e hav e receiv ed the rep orts from our advisors on your man uscript, ” On the Div ergence of Search Engines’ Results (Unsupervised Comparison of Search Engine Rankings)” . With regret, I must inform y ou that, based on the advice receiv ed, th e Editor-in-Chief has decided that your manuscript cannot be accepted for publication in W orld Wide W eb Jour- nal. A ttached, please find the reviewer comments for your p e- rusal. I would lik e to thank you very muc h for forw arding your man uscript to us for consideration and wish y ou every suc- cess in finding an alternative place of publication. Commen ts for the Author: Review er 2: The pap er addressed most of review ers’ com- men t reasonably well. Presentation has b een improv ed greatly: scoping and motiv ation of the problem has b een substan- tially imp rov ed, and it’s now in a goo d s hap e. The impact of the paper remains at the same level: not as strong as ground- breaking, but a useful pro of plus empirical studies on the w eakness of list-based comparison metho ds, and also sug- gestion/v alidation of a conten t-based comparison metho d. The review er recommends the paper for the publication in —-, after the minor revisions discussed b elo w: 1) section 3.2.1 the same as they are in the original lists \ sigma and \ pi, respectively . – > the same as they are in the original lists \ pi and \ sigma, resp ectiv ely . 2) same section 3.2.1 example (a,b,c,e,f ) – > (a,b,d,e,f ) 3) question: why use a,b,d,e,f ? why no ” c” ? It’s not even an issue, but just curious... 4) section 3.2.2 example (nice example, BTW) it’s not clear how s w (normalized v ersion) denominator is computed in the example. S w has been shown to the detail, and it’ll be nice to show the same pro cedure for the denominator (so that the reader do esn’t hav e to wonder.) Also it seems that s w uses 2 S w rather than S w at the top, so shouldn’t it b e 20 w , instead of 10 w ? Also, s w ’s w can b e cancelled form the top and b ottom, so t wo w ’s should cancel each other? 5) Figure 1. F or the same countries, ” JP” and ” US” , it’ll be nice to use the same color. Review er 3: My primary complain ts on the earlier draft w ere that (1) The set (or list) si milarity section is marginally related to the experimental part of the pap er. (2) The contribu tion and the conclusion of exp erimen tal section were not clear. (3) The paper is difficult to follo w at v arious places and needs significant revision. In their reply , the authors tried to make the case for the relev ance of their similarity part, but I am still not con- vinced. There are no new insigh ts or results that the au- thors added to the new draft of the experiment section. The writing of the paper has improv ed but it still needs to be polished more. Based on these, I recommend rejecting the paper. Here are more detailed comments. (1) The authors argue that the similarit y-metric equiv a- lence result is significant b ecause it gives credibility to their results in the exp erimen t section. I do not agree with this argumen t. What is new in the pap er (in terms of the similar- it y metric equiv alence) is their extension of the equiv alence theorem to w eighted metrics. The equiv alence of unw eighted metrics are already kno wn in the literature. Unfortunately , in their exp erimen tal section, the authors even tually decide that they will use only unw eighted metrics. Then what was really the p oin t of Section 3? Why do y ou need to prov e the equiv alence of weigh ted metrics when you do not use them? (2) In the original review, I complained ab out the signifi- cance of results reported in the experimental section and the difficult y of reading parts of the section. The writing qualit y of the exp erimen tal section has improv ed in the new draft, but no new results or insights ha ve b een added. I am still not clear ab out what is the takea wa y message of the results reported in the exp erimental section. (3) At man y places, the pap er still needs quite a bit of proof reading and/or p olishing. I will p oint out problems in Sec 3.2 as an example: (a) Line 42 of Sec 3.2.1: pi(i) = n + sigma(i) - 1: what is n here? Since we are dealing with partial list, the meaning of n is different from earlier definition of n. I also believe that the equation should not hav e -1 at the end. Assuming n is the length of pi, when we app end an elemen t at the end of pi, its rank starts with n+1, not n. (b) Line 58-61 of Sec 3.2.1: I do not understand this state- men t. (c) Equation (5). the denominator has (n-i+1). Again, I am not clear what n means here. (d) equation on s _ w after Equation (6). I am not sure wh y it simplfies to 1 - w 1/3. I also do not see why the denominator grows as n 2 . (e) Equation (7). sigma = iota(?). Iota has not b een defined. (f ) Line 31 on the righ t column of 5. What is F metric? The paper has errors like these in other parts as well, whic h mak e it difficult to follo w. Review er 4: Second review of ” On the di vergence of search engines’ results” The results of Section 3 seem to b e unre- lated to those in later sections. There is some impro vemen t in presentation, but further impro vemen t is needed. Some examples: p.4 first example, sigma prime ” c” replaced by ” d” ? How do es the normalized Kw b ecome negativ e? p.6 Example phi(Fsigma, Fpi) =2. The tw o distributions are not that differen t. Why the maximum difference? p.8 an example in Section 5.3.1 would help. Sections 6.3.2- 6.3.4 need to b e presented b etter. The figures are hard to read with three figures sup erimposed to- gether. Better explanations should b e provided. First Round. Dear Dr. Paolo D’Alberto: W e hav e receiv ed the rep orts from our advisors on your man uscript, ” On the Div ergence of Search Engines’ Results (Unsupervised Comparison of Search Engine Rankings)” , whic h y ou submitted to W orld Wide W eb Journal. Based on the advice received, the Editor feels that your man uscript could be reconsidered for publication should you be prepared to incorporate ma jor revisions. When preparin g y our revised manuscript, you are asked to carefully consider the reviewer commen ts which are attac hed, and submit a list of resp onses to the comments. Y our list of responses should be uploaded as a file in addition to your revised manu script. COMMENTS FOR THE AUTHOR : Review er 1: The pap er prop oses a metho d for compar- ing the results from differen t search engines. The pap er is w ell motiv ated and has a potential of practical use. How- ev er, the first contribution claimed, pro of of equiv alence b e- t ween a w eighted generalizations of Spearman’s fo otrule and Kendall’s tau, is weak since it is a simple extension of the existing w ork, the proof for the unw eighted permutations [9]. Moreov er, I’m not sure whether the pro of should b e in- cluded in this pap er. It consumes m uch space but it is not essen tial part of the paper. It wo uld be enough to choose one of tw o measures. The other contributions claimed are appli- cations of the existing work. It is difficult to find significan t tec hnical con tributions. Review er 2: The authors claim three main con tributions - i) proof for equiv alence of extended version of Sp earman’s footrule and Kendall’s tau, ii) observ ation of divergen t re- sults from multiple search engines, and iii) conten t-based similarit y measuremen t of search engine results. First contribution app ears to b e a solid and useful contri- bution that can b e used for general similarity measuremen t methods. Ho wev er, to the reviewer, it seems that the rest of the pap er is not very strongly motiv ated - wh y should readers care ab out the div ergence of search engines? The curren t status of art pro vides a reasonable quality , and the fact that differen t search engines pro duce different results is hardly surprising considering the scale of web and the difficult y of search task. The pap er ma y b e interesti ng for some engineers at Go ogle, Y ahoo, or Microsoft, but to the general audience, it’s not clear what they gain from the pa- per. Authors recommend that users should use meta-search or m ultiple search engines b ecause of the div ergence, but it seems that users are fine with what they get from a sin- gle searc h engine, and the suggestion do esn’t seem to make sense. One p ossible direction for impro vemen t is to discuss more about the detailed anlysis of search engine biases, such as whic h searc h engine is go o d at what, and not so go od at what, rather than simply rep orting that they are differen t. This may give general audiences a b etter insight tow ard the curren t status of multiple searc h engine technologies. Review er 3: Summary: In this pap er t he authors presen t URL-based and conten t- based measures of search engine result o verlap. F or URLs, they sho w that (1) ev en with norm alized URLs, o verlap (e.g. Jaccard ratio) is generally small, and (2) URL ov erlap is not indicativ e of quality . Given this, they suggest conten t-based approac hes for measuring ov erlap. They sho w con tent-based approac hes (e.g. shingle ov erlap from the top n pages) pro- vides a wider range of v alues, and again no correlation b e- t ween ov erlap and qualit y . These apply to both ordered (set) and unordered (list) measure s. These measures can be used, for example, to see where one search engine p erforms b etter than another. Commen ts: * The bulk of the con tributions seems to b e Section 3 and small observ ations about the figures throughout Section 6. Could use more insight in to what eac h of the graphs really means. Isn’t the ” second” contribution really just motiv ation for the use of conten t-based comparisons? * V ery long discussion and pro ofs of fo otrule and Kendall’s, their equiv alence, etc in Section 3... but then the figures seem to suggest fo otrule is not particularly useful for com- paring search results anyw ays (due to high divergence)? So then why is their equiv alence or the extension to w eigh ted lists imp ortan t here? * A lot of the details of the pap er seem to b e in areas mostly unrelated to what I p erceiv ed as the main point (most of Section 3, 5.1, 5.3). * Query classification (e.g. navigational) could make a h uge difference on the results. One would reasonably expect na vigational queries to hav e m uch higher URL correlation than, say , informational queries, particularly in the top few results. The high J(term,1) and phi(term,1) results in Fig 4 and 6 could be due to this, and it could raise the o verall con tent-based similarit y scores. * The pap er could benefit from reorganization. Motiv a- tions aren’t as clear upfront (e.g. at the time, I didn’t really kno w why I was reading through the messy details of Sec- tion 3). The ” Normalization” steps in Section 5.3.1 is almost unreadable. I’m not clear what this is saying or what each of the symbols really means. * Are the x-y lab els for Fig 7 (JP) correct? Review er 4: The pap er has three results. (1) a pro of that Spearman’s fo otrule and Kendall’ tau are equiv alen t. (2) Most queries hav e very little ov erlap for the top tw o search engines, Google and Y aho o, in their top 10 results. (3) In- troduce measures to compare p erformance of search engines based on conten ts. The results are somewhat in teresting, but the presenta tion needs improv ement. There is not even a single example in the entire paper. The authors should utilize examples to illustrate their ideas. Specifice comments: p.5 Giv e the intuitiv e idea of Kw in equation (6). line after equation (8) Should it be the numerator instead of the denominator? SMetric space: Should F b e Section 3.2.4 Equiv alence usually implies ” stronger than within small con- stan t m ultiples of one another” ? p.7 Section 4.4 second para What is exactly the similarit y score defined in [22]? p.8 left line 32 Should the Jaccard ratio be ab o ve 0.5? Section 5.3.1 I am lost. What is sigma zero? What is the in tuition for normalization. Please explain Step 1 and step 2 clearly . p.9 right l.48 Wh y are ” the searc h engines seem corre- lated” ? p.10 first para Fig. 3 The v alues in the range [0.4, 1] seem to b e larger than those in [-0.4, -1]. Do es’n t that imply one searc h engine has b etter p erformance than the other? p.10 I don’t understand what Fig. 4 shows. Please ex- plain clearly . What exactly are the purp oses for detecting near-duplicates using shingles? Is it used to detect near du- plicates among do cumen ts in the search result of one search engine and those in the search result of the other? Or, the near duplicates are detected among documents withi n single searc h engine? p.11 left lines 31-33 I hav e difficulty understanding this sen tence. l.57 What is mean t by ” w e could create queries for whic h ranking pf one of the search engines had problems” and how? Section 6.3.5 F or the statement ” DCG5 v aries greatly when the ov erlap is low” , should’n t DCG5 b e the Y-axis and the ov erlap be the X-axis? Conclusion It is not clear ” ho w these measures can b e used to atom atically c reate regression test s or training data for mac hine-learned ranking systems” ? APPENDIX Review ers’ Commen ts Conference 1 to add
Original Paper
Loading high-quality paper...
Comments & Academic Discussion
Loading comments...
Leave a Comment