Deviance Information Criteria for Model Selection in Approximate Bayesian Computation
Approximate Bayesian computation (ABC) is a class of algorithmic methods in Bayesian inference using statistical summaries and computer simulations. ABC has become popular in evolutionary genetics and in other branches of biology. However model selec…
Authors: Olivier Francois, Guillaume Laval
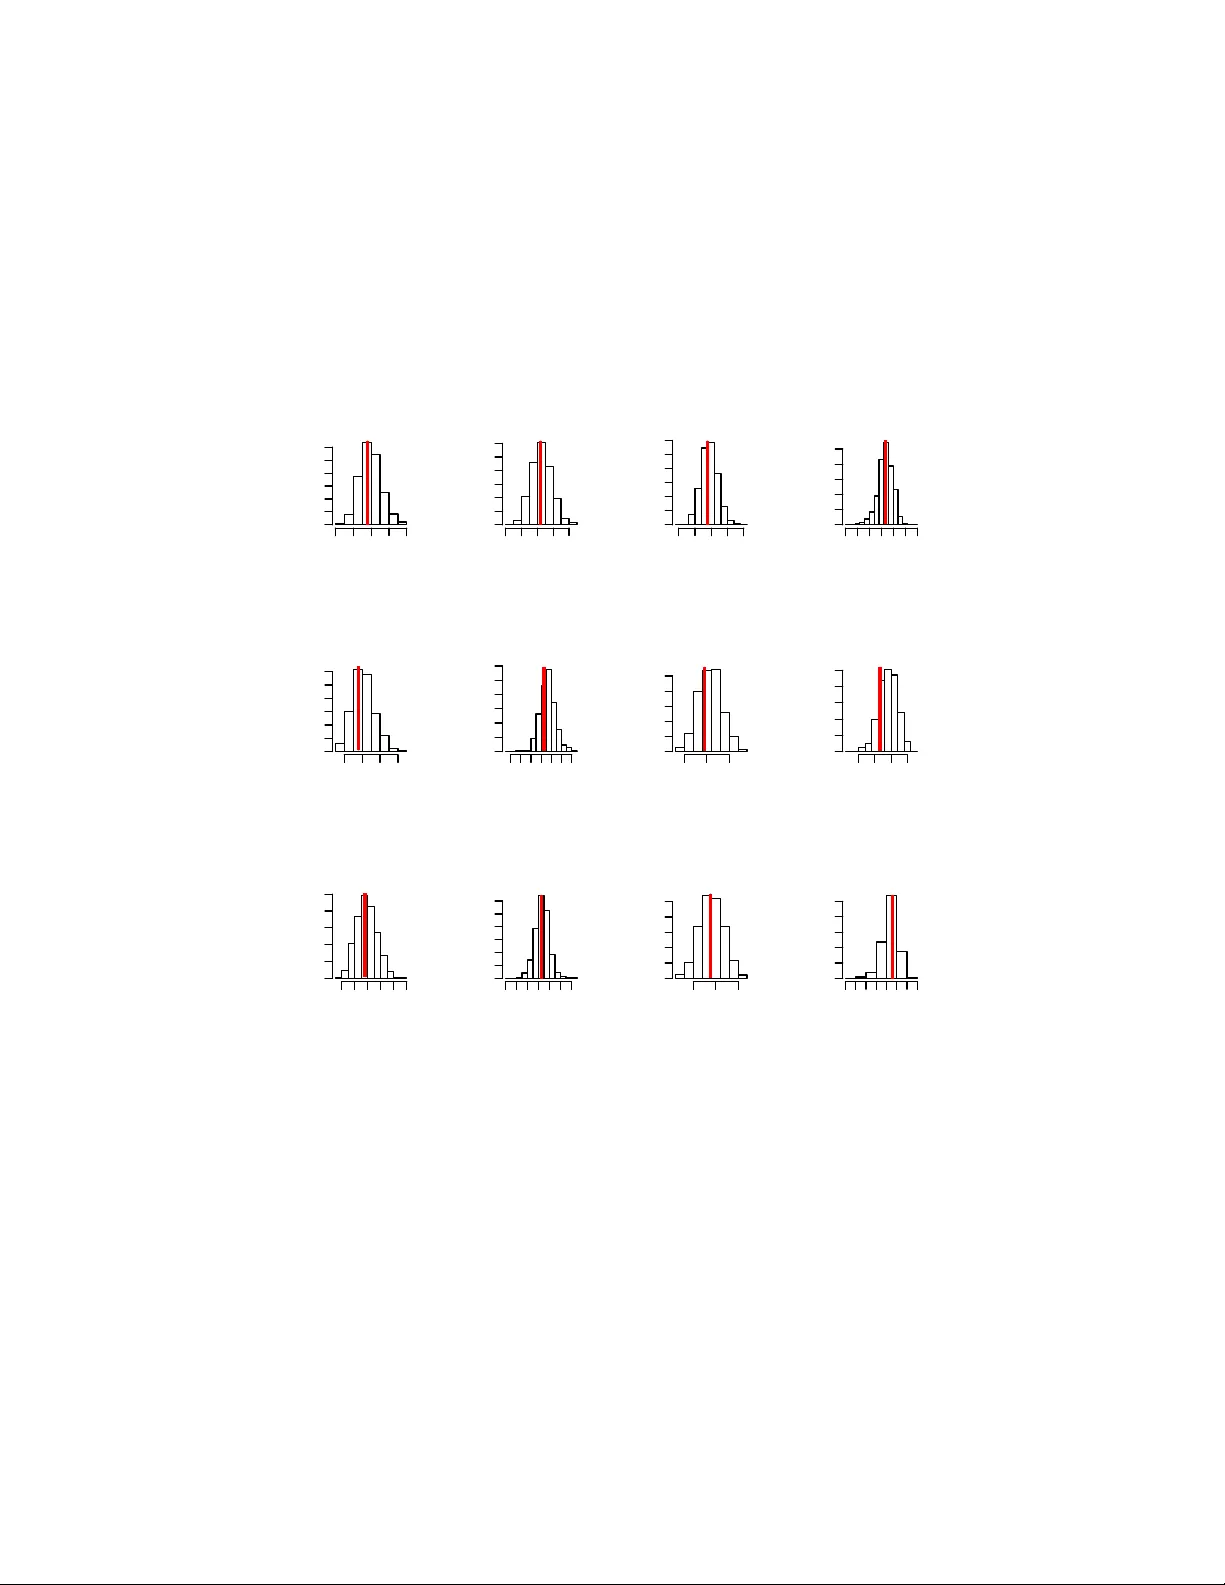
Deviance Information Criteria for Mo del Selection in Appro ximate Ba y esian Computation Olivier F ran¸ cois 1 Guillaume La v al 2 Ma y 31, 2018 1 Univ ersit´ e Joseph F ourier Grenoble, Cen tre National de la Rec herche Scien- tifique, TIMC-IMA G UMR 5525, 38042 Grenoble, F rance. 2 Institut P asteur, Human Evolutionary Genetics, P aris, F rance. Abstract Appro ximate Ba yesian computation (ABC) is a class of algorithmic metho ds in Ba yesian inference using statistical summaries and computer sim ulations. ABC has b ecome p opular in evolutionary genetics and in other branc hes of biology . How ev er mo del selection under ABC algorithms has b een a sub ject of intense debate during the recent years. Here we prop ose no vel approaches to mo del selection based on p osterior predictiv e distributions and appro ximations of the deviance. W e argue that this framew ork can settle some contradictions b et ween the computation of mo del probabilities and p osterior predictive chec ks using ABC p osterior distributions. A simulation study and an analysis of a resequencing data set of h uman DNA sho w that the deviance criteria lead to sensible results in a n umber of mo del c hoice problems of in terest to p opulation geneticists. In tro duction Appro ximate Ba yesian Computation (ABC) is a class of Mon te-Carlo algorithms for parameter inference based on summary statistics instead of the full data (Beaumon t et al 2002, Marjoram et al 2006, Beaumont 2010). More sp ecif- ically , ABC algorithms use simulations from a sto chastic mo del to generate random samples from an approximation of the p osterior distribution of a mul- tidimensional parameter, θ , after reduction of the original data, y 0 , in to a set of summary statistics, s 0 = s ( y 0 ). Here we will consider that s 0 are the only data a v ailable to ABC analyses, and will refer to (Rob ert et al 2011) for discussions related to the sufficiency of the summary statistics. ABC metho ds found their origin in evolutionary genetics (Pritchard et al 1999, T av ar ´ e 2004), where they ha ve b een fruitfully applied to the inference of demographic history of sev eral 1 sp ecies (Lopes and Beaumont 2009, Csill´ ery et al 2010, Beaumont 2010). Ex- amples of analyses encompass the ev aluation of alternative scenarios of h uman ev olution (F agundes et al 2007, P atin et al 2009, Lav al et al 2010), inference in demographic mo dels of p opulation expansion, b ottlenec k or migration (Thorn- ton et al 2006, F ran¸ cois et al 2008), p opulation structure and adaptation (Bazin et al 2010). Curren t ABC algorithms fall into broad sub classes of metho ds that extend the standard subclasses of computational algorithms used in Ba y esian statistics. The first class of algorithms makes use of the rejection algorithm to accept parameters generating simulated data close to the observ ations (Pritchard et al 1999). The rejection algorithm p erforms the following ste ps: 1) Generate a candidate v alue θ from a prior distribution; 2) Simulate a data set, y , from a generating mechanism using the parameter θ , and compute the set of summary statistics s = s ( y ); 3) Accept the v alue of θ if the (Euclidean) distance betw een s and s 0 is less than , a presp ecified error v alue; 4) If rejected, go to 1). F or this basic algorithm, the accepted v alues ( θ i ) form a random sample from an appro ximation of the p osterior distribution. The abov e approximation becomes exact as go es to zero, but the algorithm is then highly inefficient. Recen t techniques improv e the appro ximation of the p osterior distribution by applying linear or non-linear transforms (Beaumont et al 2002, W egmann et al 2009, Leuenberger and W egmann 2010, Blum and F ran¸ cois 2010). In those improv ements, the accepted v alues of the parameter, θ i , are weigh ted by a quantit y that dep ends on the distance b et ween s i and s 0 . Then they are adjusted according to a regression transform, for example, θ ∗ i = θ i − b T ( s i − s 0 ), where b is a vector of linear regression co efficien ts (Beau- mon t et al 2002). Several studies hav e provided evidence that the transformed parameters form a significantly b etter approximation of the p osterior distribu- tion than the non-transformed ones (Beaumon t et al 2002, Blum and F ran¸ cois 2010), and regression adjustments are now widely used b y ABC practioners (Thorn ton 2009, Cornuet et al 2009, Lop es and Beaumont 2009). Tw o other classes of algorithms implement Marko v chain Monte Carlo metho ds without lik eliho o d (Marjoram et al 2003, Bortot et al 2007) and iterative algorithms that were originally inspired by sequen tial Mon te Carlo samplers (Sisson et al 2007, Beaumon t et al 2009, T oni et al 2009). An imp ortan t asp ect of ABC is its use for mo del selection in addition to parameter estimation. In general the aim of mo del selection is to find mo dels receiving the highest p osterior probabilities among a finite subset of candidates. Ba yesian statisticians hav e devised numerous wa ys to ev aluate and select mo d- els for inference (Gelman et al 2004). Assuming that there are M mo dels under consideration, the Ba yesian paradigm includes mo del selection in the inference step, taking the mo del lab el as an additional parameter, m . In decision theo- retic approaches, mo del c hoice is p erformed on the basis of p osterior probabili- ties, p ( m | s 0 ), whic h are prop ortional to the marginal probabilities, p ( s 0 | m ). In ABC these probabilities can b e crudely estimated by counting simulations from mo del m that fall at a distance less than a fixed v alue to the observ ed data. More sophisticated estimators of p osterior mo del probabilities can b e found in (Beaumon t 2008) or in (Leuenberger and W egmann 2009). Alternativ ely se- quen tial Monte-Carlo algorithms can also used to estimate mo del probabilities via iterated imp ortance sampling pro cedures (T oni and Stumpf 2010). Mo del selection using ABC algorithms has b een recently questioned (T em- pleton 2009, Beaumont et al 2010, Csill´ ery et al 2010, Rob ert et al 2011). Here w e p oin t out a p oten tially serious concern when selecting mo dels on the ba- sis of approximate p osterior mo del probabilities. Because appro ximate mo del probabilit y estimates are based on the rejection algorithm and ignore regression adjustmen ts on parameter samples, we argue that mo del c hoice based on these probabilities does not apply to the (appro ximate) models in whic h we even tually mak e inference. T o see this, assume θ | m = θ m , and let p ( θ m | s 0 ) ∝ Pr( k s − s 0 k ≤ | θ, m ) p ( θ m ) , (1) b e the approximation of the p osterior distribution obtained from the rejection algorithm, where p ( θ m ) denotes the prior distribution on the parameter θ m for mo del m . The joint distribution defining mo del m is then equal to p ( θ m , s 0 | m ) = p ( θ m | s 0 ) p ( s 0 | m ) . (2) Regression adjustmen ts replace p ( θ m | s 0 ) with another distribution p reg ( θ m | s 0 ), whic h is generally closer to the exact p osterior distribution. Clearly this c hange mo difies the join t distribution in equation (2). Thus a model c hosen on the basis of p ( m | s 0 ) can b e different from the mo del in which we even tually estimate parameter uncertain ty . In the next section, we define tw o information theoretic criteria for mo del selection based on measures of mo del fit p enalized by an estimate of the mo del complexit y . While our fo cus in on regression metho ds, the ideas introduced in the presen t study apply to any ABC algorithm. The approac h shares similarities with the popular Ak aike information criterion (AIC, Ak aike 1974) whic h is v alid for the comparison of nested mo dels (Burnham et al 2002, Johnson and Om- land 2004, Ripley 2004, Carsten et al 2009). The assumption of nested mo dels is seldom appropriate to ABC, and we develop a statistical theory of approx- imate deviance information criteria (DIC), a generalization of AIC that do es not require the assumption of nested models (Spiegelhalter et al 2002, Gelman et al 2004). Then we pro vide an example of ABC analysis where mo del choice based on appro ximate probabilities disagree with the prediction of adjusted mo dels and DICs. Using simulations, we study the relev ance of the prop osed information criteria to inference in p opulation genetics under v arious mo dels of demographic history and p opulation structure. In the last part of the study , we presen t an application to an empirical genetic data set of 20 nonco ding DNA regions resequenced from 213 humans (Lav al et al 2010), and we use DICs to question the replacemen t of Neanderthals by mo dern humans. Theory In this section we describ e model selection criteria based on p osterior predictive distributions and appro ximations of the deviance. Information theoretic criteria In Ba yesian analyses, the deviance informa- tion criterion summarizes the fit of a mo del by the p osterior exp ectation of the deviance, ¯ D , and the c omplexity of a model by its effe ctive numb er of p ar ame- ters , p D (Spiegelhalter et al 2002). The mo dels that receive the highest supp ort from the data are those with the low est v alues of the DIC. More sp ecifically , the definition of DIC is DIC = ¯ D + p D , (3) where the deviance is minus twice the logarithm of the likelihoo d, D ( θ ) = − 2 log p ( s 0 | θ ), ¯ D is the exp ected deviance ¯ D = E θ | s 0 [ D ( θ )] , (4) and p D is the difference b et ween ¯ D and the deviance ev aluated at a particular p oin t estimate, D ( ˆ θ ). An example of ˆ θ often used in applications is the estimate of the p osterior mean of the mo del parameter. A complication arises when mo dels are defined hierarc hically . In hierarchical mo dels there is a hidden parameter ϕ , and the p osterior distribution decomposes as follo ws p ( θ , ϕ | s 0 ) ∝ p ( s 0 | ϕ ) p ( ϕ | θ ) p ( θ ) . (5) In this situation, several definitions of the deviance and DIC hav e been proposed dep ending on the fo cus of the mo del (Spiegelhalter et al 2002; Celeux et al 2006). F or example fo cusing on θ , the deviance can b e tak en equal to D ( θ ) = − 2 log Z ϕ p ( s 0 | ϕ ) p ( ϕ | θ ) dϕ , (6) and the computation of DIC should b e mo dified accordingly . A hierarchical model approac h to ABC Without regression adjustmen ts, one wa y to define ABC is as a hierarchical Bay esian mo del in whic h the simulated summary statistics are viewed as laten t v ariables. In this hierarchical mo del, the p osterior distribution decomp oses as p ( θ , s | s 0 ) ∝ p ( s 0 | s ) p ( s | θ ) p ( θ ) (7) where s are the sim ulated statistics, and θ becomes the “hyper-prior” parameter. In this mo del, p ( s | θ ) is the probability of the generating the summary statis- tics, s , with parameter θ . T o make use of a hierarchical framework, we define a surrogate lik eliho o d function p ( s 0 | s ) ≡ K ( s 0 − s ) = 1 K s 0 − s ) , (8) where K is a density function, called the kernel , and is the error parameter. The distribution p ( s 0 | s ) can b e view ed as a mo del for the observ ation error, and ABC p erforms exact inference under the assumption of mo del error (Wilkinson 2008). The hierarchical mo del reformulation of ABC dates to the work of Mar- joram et al (2003) who used it as a rationale for defining MCMC algorithms without likelihoo d. This p oin t of view has also prov en useful in a v ariety of the- oretical w orks on ABC (Bortot et al 2007, Ratmann et al 2009, Wilkinson 2008). Regarding the basic rejection algorithm, the definition amoun ts to choosing a uniform densit y function ov er the interv al (0 , 1) for the kernel. In this case, we obtain p ( s 0 | θ ) ≈ Z s p ( s 0 | s ) p ( s | θ ) d s = Pr( k s 0 − s k < | θ ) . (9) Extensions of the rejection algorithm use non-uniform kernels. F or example, Beaumon t et al (2002) implemented the Epanetchnik o v function whic h is p opu- lar in densit y estimation. Because we wan t to relate the quantit y log K ( s 0 − s ) to a natural measure of mo del fit, we take the Gaussian kernel K ( u ) = 1 √ 2 π e − u 2 / 2 , u ∈ R . (10) With this choice, the quantit y − 2 log K 1 ( s 0 − s ) has a natural in terpretation as the sum of squares error b et w een observed and simulated statistics. The surrogate mo del presented ab o ve has a tw o-level hierarch y . F ollowing Spiegelhalter et al (2002) or Celeux et al (2006), distinct definitions of DIC can b e prop osed, dep ending on whether the fo cus is on the fit of the summary statistics to the observ ed ones or on the model parameters themselv es. F o cusing on the parameter level allo ws us to b etter ev aluate the predictive p o wer of the fitted mo dels, and we next in tro duce tw o definitions for an approximate deviance at this lev el. A first wa y to define a Ba yesian deviance is by considering a p osterior pre- dictiv e av erage of a “low level” deviance dev( θ ) = − 2 E s | θ [log p ( s 0 | s )] = − 2 Z s log p ( s 0 | s ) p ( s | θ ) d s . (11) In this case, the exp ected Bay esian deviance is ¯ D 1 = E θ | s 0 [dev( θ )] = − 2 E s | s 0 [log p ( s 0 | s )] With this definition, a Monte-Carlo estimate of the exp ected deviance can b e easily computed from the sim ulated data as follows ¯ D 1 ≈ − 2 n n X j =1 log K ( s j − s 0 ) , (12) where the s j are summary statistics obtained from the posterior predictive dis- tribution p ( s | s 0 ). T o compute the penalty p 1 D , w e generate n summary statistics s j from p ( s | ˆ θ ), where ˆ θ is a p oin t estimate of θ , for example an estimate of the p osterior mean, E[ θ | s 0 ]. Applying the same formula as ab o ve, we come with an estimate ¯ D 1 ( ˆ θ ) that we use to define p 1 D p 1 D = ¯ D 1 − ¯ D 1 ( ˆ θ ) . (13) Though the focus is on the parameter θ , the previous definition of a deviance is not equiv alent to equation (6). A definition of the deviance in a hierarc hical mo del consistent with this equation is as follows D ( θ ) = − 2 log p ( s 0 | θ ) = − 2 log Z s p ( s 0 | s ) p ( s | θ ) d s , (14) whic h is also equal to D ( θ ) = − 2 log E s | θ [ K ( s − s 0 )] . (15) With this definition, an estimate of the exp ected deviance requires tw o levels of Mon te Carlo integration ¯ D 2 = E θ | s 0 [ D ( θ )] ≈ − 2 m m X i =1 log 1 n n X j =1 K ( s j i − s 0 ) (16) where we hav e m replicates, ( θ i ) i =1 ,...,m , from the approximate p osterior distri- bution, p ( θ | s 0 ), and each s j i is sampled from p ( s | θ i ), j = 1 , . . . , n . T o compute p 2 D , w e generate n summary statistics, s j , from the conditional distribution p ( s | ˆ θ ), where ˆ θ is a p oin t estimate of θ , and we set ¯ D 2 ( ˆ θ ) ≈ − 2 log 1 n n X j =1 K ( s j − s 0 ) . (17) Then w e define p 2 D = ¯ D 2 − ¯ D 2 ( ˆ θ ) . (18) Both definitions of ¯ D and p D lead to distinct definitions of an information criterion, DIC i = ¯ D i + p i D , i = 1 , 2. DIC 2 has the adv antage of defining DIC for ABC mo dels more rigorously than DIC 1 , but it has the disadv antage of b eing computationally more in tensive. Unlik e mo del probabilities, ¯ D and p D can b e computed from any approxi- mation of the p osterior distribution. Using linear or non-linear regression ad- jusmen ts, w e can consider the transformed parameter p osterior distribution, p reg ( θ m | s 0 ), instead of p ( θ m | s 0 ). T o compute DIC, w e then replace the θ i ’s b y their adjusted v alues θ ∗ i ’s, sampled from the modified posterior distribution, and generate p osterior predictive densities from these v alues. In the sequel, DIC i will refer to predictiv e distributions generated from adjusted parameters. T o motiv ate the use of information criteria and illustrate some of the issues presen ted in the introduction, we consider an example where samples of size n = 20 are simulated from a Gaussian disribution of mean µ 0 = 2 and standard deviation σ 0 = 3 (then assumed to b e unknown). The data are summarized b y their empirical mean, standard deviation, skewness and kurtosis, and the sample size is kno wn. W e observ ed s 0 = (2 . 00 , 3 . 11 , − 0 . 78 , 0 . 14). F or these data tw o mo dels are h yp othesized. The sampling distribution of first model is a Gaussian distribution where the parameter, θ = ( µ, σ 2 ), corresp onds to the mean and the v ariance. The prior distribution on µ is a Gaussian distribution of mean 2 and standard deviation 10. The prior distribution on σ is an inv erse-exp onen tial distribution of rate 1. The sampling distribution of the second mo del is a Laplace distribution of mean 3 and rate λ . The prior distribution on λ is an exp onen tial distribution of rate 1. T o p erform ABC analyses, we simulated 10,000 samples from each mo del, and po oled the 20,000 v ectors of statistics into a single data set. Using an ac- ceptance rate of 10%, we estimated mo del probabilities using the R pack age abc (R core team 2010). This pac k age computes the prop ortion of accepted sim ulations under b oth mo dels, and also implemen ts the weigh ted logistic re- gression metho d of (Beaumont 2008). The Bay es factor, defined as the ratio of marginal probabilities for tw o mo dels m 1 and m 2 can b e estimated as the ratio of counts in fav or of m 1 and m 2 (Pritc hard et al 1999, Grelaud et al 2009). The prop ortion of accepted simulations from mo del 2 (Laplace) w as 0.83. Assuming a uniform prior distribution on mo dels 1 and 2 we obtained an approximation of the Ba yes factor equal to BF ≈ 5 . 02. The logistic regression estimate for the p osterior probability of mo del 2 was 0.85, and we obtained BF ≈ 5 . 75. Accord- ing to Jeffrey’s scale on Ba yes factors (Jeffreys 1961), there w ould b e substan tial evidence in fa vor of the Laplace mo del ov er the Gaussian mo del. In a second stage, we p erformed regression adjustments to the approximate p osterior samples. The observ ed v alue of the kurtosis statistic was outside the tails of the p osterior predictive distribution under the Laplace mo del. In con- trast it was within the tails of the p osterior predictive distribution under the Gaussian mo del. Th us there is an apparent contradiction b et ween the com- putation of mo del probabilities and the predictions from the p osterior distri- bution. T o b etter understand this contradiction, w e drew the exact p osterior distribution of σ 2 under the Gaussian mo del (an in verse-Gamma(11 , 1 + 9 . 5 v 2 0 ) distribution, where v 2 0 is the empirical v ariance). Although p osterior densit y appro ximations are improv ed by the adjustment metho d (Figure 1), the esti- mates of mo del probabilities did not account for such improv emen ts. Then we computed DICs for the Gaussian and Laplace mo dels. Under the Gaussian mo del, we obtained DIC 1 = 4 . 5 and DIC 2 = 3 . 2. Under the Laplace mo del, w e obtained DIC 1 = 10 . 1 and DIC 2 = 4 . 5. Once the corrections were applied, DIC indicated that the Gaussian mo del was a b etter choice than the Laplace mo del. T o inv estigate whether our analysis was robust, we replicated it 100 times with v alues of s 0 sampled from the same Gaussian distribution in each replicate. The av erage v alue of the Ba yes factor was around 3.45 (3.58 when using the logistic regression metho d) in fa vor of the Laplace mo del which obtained the highest posterior probabilit y in 100% of the replicates. In con trast, the Gaussian Exact posterior distribution Density 0 10 20 30 40 50 0.00 0.04 0.08 0.12 Approximate posterior distribution (rejection) σ 0 10 20 30 40 0.00 0.04 0.08 0.12 Approximate posterior distribution (regression) 5 10 15 20 25 30 35 0.00 0.05 0.10 0.15 0.20 2 Figure 1: Posterior distributions of p ar ameter σ 2 (Gaussian mo del). A) The exact p osterior distribution. B) The appr oximation obtaine d fr om the r eje ction algorithm. C) The appr oximation obtaine d with the r e gr ession adjustement. mo del was preferred in 100% of the replicates when DIC w as used. The mean v alue of the information criterion w as around 4.1 (2.4 for DIC 2 ) under the Gaussian mo del, whereas is was around 12.4 (3.7 for DIC 2 ) under the Laplace mo del. P opulation genetic mo dels F or eac h simulated data set and each mo del considered afterwards, w e p erformed 10,000 simulations under sp ecified prior distributions (100,000 for the human data). W e ran ABC analyses using an acceptance rate of 10% (1% for the h uman data). T o compute DIC 1 w e additionally created n =1,000 replicates from the p osterior predictive distribution. F or DIC 2 , we used m = 200 and n = 200 replicates. Demographic models. W e generated coalescent sim ulations under selec- tiv ely neutral mo dels of micro-evolution for 3 distinct demographic scenarios: a sudden decline in p opulation size (b ottlenec k without recov ery), a constant p opulation size, an exp onen tially gro wing p opulation size. In these data, fift y diploid individuals were genotyped at 20 non recombining lo ci. The data were sim ulated as DNA sequences under an infinitely many-sites mo del using the computer program ms (Hudson 2002). F or each of the three mo dels, we simulated one hundred replicates of the data with fixed parameter v alues. In ms , the parameters are expressed in units of the current population size, N 0 . In our simulations, the normalized m utation rate w as equal to θ = 2 N 0 µ = 3. In the b ottlenec k model, the population size shrunk to a fraction x = 1 / 4 of its ancestral v alue, and this even t o ccurred t = 0 . 2 N 0 generations in the past. In the expanding p opulation mo del, the expansion rate w as set to α = 2. The prior distribution on the mutation rate, θ , was uniformly distributed o ver (0 , 15) for all mo dels. In the b ottlenec k mo del, the date of the b ottlenec k ev ent (in unit of N 0 ) was uniformly distributed ov er (0 , 1), and log 10 x was Bottlenec k Constan t size Expansion Bottlenec k ? 13.66 (7.72) 12.83 (7.99) 18.36 (9.82) 10.08 (8.80) 10.59 (6.08) 17.04 (9.71) Constan t size 40.06 (10.93) 2.83 (0.18) 3.15 (0.30) 30.24 (14.71) 2.71 (0.17) 2.95 (0.39) Expansion 17.48 (4.59) 3.65 (0.64) 3.36 (0.23) 11.40 (4.12) 3.58 (0.69) 2.87 (0.17) T able 1: Comp arisons of demo gr aphic mo dels using DIC 1 and DIC 2 . The r ows c orr esp ond to the mo dels use d for simulating the data, and the c olumns c orr e- sp ond to the mo dels under which infer enc e was p erforme d. The values r epr esent the me an and standar d deviation of DICs c ompute d over 100 indep endent r epli- c ates for e ach mo del. ? : V alues under the b ottlene ck mo del wer e c ompute d with the me dian of the p osterior devianc e inste ad of their me an, b e c ause the me dian is less sensitive to lar ge deviations. uniformly distributed ov er (0 , 1 . 5). In the expansion mo del log 10 α was also uniformly distributed ov er (0 , 1 . 5). ABC analyses were p erformed using the follo wing summary statistics: the T a jima’s estimator π , computed as the mean n umber of differences b et ween pairs of sequences, T a jima’s D (T a jima 1989), and F ay and W u’s H statistic (F a y and W u 2000). The three statistics were a veraged ov er the 20 lo ci. W e applied ABC analyses and deviance information criteria to p opulation genetic data simulated under a b ottleneck, a constant p opulation size and an expansion model (100 data sets for eac h demographic mo del). T able 1 rep orts congruen t results for DIC 1 and DIC 2 , and Figure 2 rep orts the outcome of model selection for the three mo dels. Although DIC 1 is generally greater than DIC 2 , the t wo measures pro duced highly correlated results (Figure 3). In these examples, both criteria agreed in their ev aluation of mo dels. When the data were simulated under the b ottle- nec k mo del, rep orted estimates were obtained with the median of the p osterior deviance instead of their mean (The mean provided highly v ariable results). The preferred mo del was the b ottleneck mo del in 61/100 replicates. When the data were simulated under the constant p opulation size mo del, the preferred mo del was the constant size mo del in 81/100 replicates. When the data were sim ulated under the expanding p opulation size model, the preferred mo del was 0% 10% 20% 30% 40% 50% 60% 70% 80% 90% 100% Bottleneck Constan t si ze Expansion Expansion Constan t size Bottleneck Figure 2: Demo gr aphic sc enarios. Mo del choic e using the devianc e information criterion, DIC 2 , when a sp e cific sc enario is assume d. Se e the text for the defini- tion of mo dels. The fr e quencies wer e c ompute d over 100 indep endent r eplic ates fr om e ach mo del. The same r esults wer e obtaine d with DIC 1 . the expanding p opulation mo del in 89/100 replicates. Overall, mo dels that did not generate the data were selected in a small but non-neglectible n umber of replicates (23%). F or data simulated under the b ottleneck mo del, the low er p erformances can b e explained by the relativ ely recent date of b ottlenec k even t and by the choice of diffuse prior distributions. Both factors contribute to the difficult y of distinguishing b et ween a bottleneck and a constan t size mo del. In addition there is great v ariabilit y in the simulated summary statistics, and this can explain why the b ottlenec k and constant p opulation size mo dels w ere diffi- cult to tease apart. T o gain insight on mo del choice, we examined the results obtained for a particular replicate in further details. The replicate was obtained from the b ottlenec k mo del, where the effective mutation rate, the time of the b ottleneck ev ent and the sev erity of the bottleneck 1 /x w ere set to the v alues (3, .2, 4). The observ ed summary statistics were equal to π = 8 . 58, D = 1 . 32 and H = 9 . 42. Under the bottleneck mo del, the p oint estimates of the effectiv e m utation rate (p osterior mean = 2.90, .95 CI = [1.34, 4.36]), the time of the b ottlenec k even t (p osterior mean = 0.35, .95 CI = [0.04, 0.62]) and the severit y of the b ottlenec k 3.0 3.5 4.0 4.5 5.0 5.5 3.0 3.5 4.0 4.5 5.0 5.5 DIC2 DIC1 ● ● ● ● ● ● ● ● ● ● ● ● ● ● ● ● ● ● ● ● ● ● ● ● ● ● ● ● ● ● ● ● ● ● ● ● ● ● ● ● ● ● ● ● ● 2.5 3.0 3.5 4.0 4.5 3.0 3.5 4.0 4.5 5.0 DIC2 ● ● ● ● ● ● ● ● ● ● ● ● ● ● ● ● ● ● ● ● ● ● ● ● ● ● ● ● ● ● ● ● ● ● ● ● ● ● ● ● ● ● ● ● ● A B Figure 3: Corr elation b etwe en DIC 1 and DIC 2 . A) Infer enc e under a p opulation exp ansion mo del for data simulate d under a c onstant p opulation size mo del. B) Infer enc e under a c onstant p opulation size mo del for data simulate d under an exp anding p opulation mo del. (p osterior mean = 5.01, .95 CI = [2.18, 47.81]) were close to the v alues used in the sim ulation. DIC 2 w as equal to 14.13 (median estimate), whereas it was equal to 17.83 under the constan t p opulation size mo del. In this case the DIC sligh tly fa vored the model that generated the data. Under the b ottleneck mo del, the observed v alues of the summary statistics were indeed within the tails of the p osterior predictive distributions whereas they were outside the tails in the constan t size p opulation mo del (Figure 4). W e also inv estigated why in some case DIC failed to select the mo del from which the data were sim ulated. F or one bottleneck data set, the observ ed summary statistics were equal to π = 6 . 77, D = 0 . 56 and log H = 1 . 71. DIC 2 w as equal to 10.11 (median estimate) under the b ottlenec k mo del, whereas it w as equal to 6.08 under the constan t p opulation size mo del. Under b oth mo dels, the observed v alues of the summary statistics were within the tails of the posterior predictiv e distributions, but the p osterior distributions had larger tails under the b ottlenec k mo del than under the constant size mo del, and DIC fa vored the most parcimonious mo del (constan t p opulation size). This shows that in some cases the data do not con tain enough information to discriminate b et ween mo dels, and highlights the difficult y of making mo del inference under coalescen t mo dels. Isolation with migration. Next w e generated coalescen t sim ulations under 3 distinct mo dels of p opulation structure: div ergence of tw o subp opulations, di- v ergence with unidirectional gene flow from subp opulation 1 to subp opulation 2, and divergence with migration b etw een tw o subp opulations. Fift y diploid individuals in each p opulation were genotyped at 100 non recombining lo ci. F or each of the three mo dels, w e simulated one hundred replicates of the data with fixed parameter v alues. F or these mo dels, the parameters are expressed in Frequency 4 5 6 7 8 9 0 50 100 150 200 Frequency −0.5 0.0 0.5 1.0 0 50 100 150 Frequency 0.5 1.0 1.5 2.0 0 50 100 150 Frequency 0 50 100 150 0 100 200 300 400 500 600 Frequency 0 1 2 3 0 20 40 60 80 100 120 Frequency −2 0 2 4 0 50 100 150 200 250 Posterior predictive distributions (Bottleneck model) Posterior predictive distributions (Constant size model) Diversity T ajima's D log(Fay and W u's H) log(Fay and Wu's H) T ajima's D Diversity Figure 4: Posterior pr e dictive distributions of π , T ajima’s D and the lo garithm of F ay and Wu’s H . The observe d summary statistics wer e simulate d under a b ottlene ck mo del, and wer e e qual to π = 9 . 77 , D = 1 . 40 and H = 9 . 98 . Infer enc es wer e p erforme d under a b ottlene ck mo del and a c onstant p opulation size mo del. The vertic al b ars c orr esp ond to the observe d summary statistics. Isolation Asymetric Migration Migration Isolation 2.97 (.15) 3.37 (.25) 4.67 (.71) 2.67 (.12) 3.18 (.39) 4.15 (.81) Asymetric 3.13 (.25) 2.79 (.19) 4.10 (.31) Migration 2.84 (.23) 2.65 (.20) 3.41 (.33) Migration 3.02 (.12) 3.02 (.20) 3.82 (.25) 2.73 (.11) 2.85 (.19) 3.25 (.20) T able 2: Comp ar aison of isolation with migr ation mo dels. The r ows c orr esp ond to the mo dels use d for simulating the data, and the c olumns c orr esp ond to the mo dels under which infer enc e was p erforme d. The values r epr esent the me an and standar d deviation of DIC 1 and DIC 2 c ompute d over 100 indep endent r eplic ates for e ach mo del. units of the curren t subp opulation size, N 0 . In our simulations, the normalized m utation rate was equal to θ = 2 N 0 µ = 4. In eac h mo del, the tw o subp opu- lations had equal population size (b oth were equal to N 0 ). F or the divergence mo del, the split o ccurred 0 . 7 N 0 generations ago. In the div ergence with mi- gration mo del, the normalized migration rates were equal to m 1 N 0 = 40 and m 2 N 0 = 30, whereas in the unidirectional gene flow mo del, we to ok m 1 N 0 = 40 and m 2 N 0 = 0. When running ABC inferences, subpopulations sizes were parameterized as ν 1 N 0 and ν 2 N 0 resp ectiv ely , and we used uniform prior distributions on (0 , 3) b oth for ν 1 and ν 2 . In all mo dels, the div ergence time was uniformly dis- tributed ov er (0 , N 0 ). Normalized migration rates were uniformly distributed o ver (0 , 100). In addition to the three statistics π , D and H used in demo- graphic mo dels, we also computed an F ST statistic for each data set according to Hudson’s estimator (Hudson et al 1992). The statistics were av eraged o ver the 100 lo ci. W e applied ABC analyses to 300 data sets sim ulated under the abov e models of p opulation structure and gene flow b et ween t wo subp opulations. T able 2 rep orts congruen t results for DIC 1 and DIC 2 , and Figure 5 describ es the results of mo del selection for the three mo dels of p opulation structure. As for the simulations of demographic scenarios, DIC 1 and DIC 2 pro duced highly correlated results, and agreed in their ev aluation of mo dels. When the data were simulated under the divergence mo del, the preferred mo del was the 0% 10% 20% 30% 40% 50% 60% 70% 80% 90% 100% Divergence Unidirectional gene flow Bidirectional gene flow Unidirectional gene flow Divergence Figure 5: Population structur e and migr ation sc enarios (100 r eplic ates). Mo del choic e using the devianc e information criterion, DIC 1 , when a p articular sc e- nario is assume d. Se e text for the definition of mo dels. The fr e quencies wer e c ompute d over 100 indep endent r eplic ates fr om e ach mo del. div ergence mo del in 98/100 replicates. When the data were simulated under a mo del with unidirectional migration, the preferred mo del was the mo del with asymetric migration in 92/100 replicates. When the data w ere sim ulated under the migration mo del, DIC fav ored either a divergence model (49/100 replicates) or a mo del with asymetric migration (51/100), but it never chose the mo del mo del that generated the data. As previously , DICs fa vored explanatory mo d- els that required the smallest n umber of parameters. A typical example of p osterior predictive chec ks for data simulated under the bi-directional migra- tion mo del is displa yed in Figure 6. F or the 3 mo dels, the observed summary statistics w ere b et ween the tails of their p osterior predictive distributions. The summary statistics used in this example were not informativ e enough to distin- guish b et ween gene flow and divergence (Nielsen and W akeley 2001, Hey and Mac hado 2003). The fact that DIC did not select the mo del that generated the data should not b e considered as an error. The correct interpretation is that the three mo dels were equally go od at repro ducing the observ ed statistics, and DIC v alues confirmed that we could not make an y strong decision in this case. Frequency 1 2 3 4 5 0 100 250 Frequency −0.4 0.0 0.4 0 100 250 −1.5 0.0 0 100 250 −1.0 0.5 2.0 0 100 250 Frequency 2 3 4 5 0 100 250 −0.3 0.1 0 100 250 −1.0 0.0 0 100 250 0.0 1.0 0 100 200 Frequency 1 3 5 0 100 200 −0.3 0.0 0.3 0 100 250 −1.0 0.0 0 100 250 −1.5 0.5 2.0 0 200 500 Divergence model (DIC = 2.24) Asymetric migration model (DIC = 2.26) Bidirectional migration model (DIC = 2.62) Diversity Fst T ajima D log(H) Diversity Fst T ajima D log(H) Diversity Fst T ajima D log(H) Figure 6: Posterior pr e dictive che cks for thr e e isolation with migr ation mo d- els. Data wer e simulate d under the bidir e ctional migr ation mo del (thir d mo del). The summary statistics wer e within the tails of the p osterior pr e dictive distribu- tions under al l mo dels. The vertic al b ars c orr esp ond to the observe d summary statistics. Human data analysis In this section, we used the deviance information criterion to question the re- placemen t of Neanderthals by mo dern human using mo dern human DNA. Ge- netic data based on resequencing from nonco ding regions were utilized to dis- criminate b et ween mo dels of divergence incorp orating v arious levels of admix- ture b etw een the tw o sp ecies (Lav al et al 2010). W e used sequence v ariation surv eyed in DNA samples from 213 healthy donors. The panel included 118 sub-Saharan African individuals, 47 Europ ean individuals, and 48 East-Asian individuals. F ollo wing La v al et al (2010), we re-analyzed 20 autosomal regions (27 kb p er individual, mean sequence length p er region of 1.33 kb) that met cri- teria of selectiv e neutrality . The regions were selected to b e independent from eac h other, residing at least 200 kb apart from any known or predicted gene or spliced expressed sequence tag, and not to in link age disequilibrium with any kno wn or predicted gene. T o run an ABC analysis, we used a coalescent-based algorithm implemen ted in SIMCOAL 2 (Lav al et al 2004), we generated synthetic data that consisted of 20 indep endent DNA sequences of 1.4 kb each. The mutation and the recom- bination rates of each region were drawn from gamma distributions (T able 3). The ev olutionary scenarios assumed an early diffusion of archaic hominids out of Africa ∼ 1.25 and ∼ 2.25 million years ago and an African exo dus of mo dern h umans b etw een ∼ 40,000-100,000 years ago (F agundes et al 2007). By tuning the replacement rate, δ , we considered v arious levels of introgression of archaic genetic material into the mo dern human gene p ool. Nineteen mo dels differing in their prior distributions on δ were considered. In these mo dels, each prior distribution was uniform ov er an interv al of length 0.1, from 0 < δ < 0 . 1 to 0 . 9 < δ < 1. Each interv al was deduced from the previous one by a translation of h = 0 . 05. Our ob jectiv e was to discriminate among models with lo w, medium or high lev els of admixture. Under equilibrium assumptions, the human effective p opulation size has b een estimated at ∼ 10,000 individuals on the basis of human-c himpanzee divergence and intra-specific link age disequilibrium levels (Harp ending et al 1998). T o give p opulation size a degree of freedom and to match with a consensus estimate of human p opulations, w e defined a gamma prior distribution with a mean of 10,000 individuals and a .95 confidence interv al of 3,000 to 21,000 individuals (T able 3). In all mo dels we considered a constant size for the African, Asian and Europ ean mo dern populations (Lav al et al 2010). F or eac h genomic region, we sp ecifically computed global and pairwise F ST , based on haplotype frequencies, the num b er of haplotypes, K , the num b er of p olymorphisms, S , the nucleotide diversit y , π , and T a jimas D , the exp ected heterozygosit y . W e also computed the v ariance b et ween regions for π and D . The summary statistics w ere calculated by merging all p opulation samples (ex- cept for p opulation differentiation indices) in order to minimize the effects of recen t demographic even ts related to the continen tal p opulations. Considering 19 mo dels with distinct prior distributions for the replacement rate of Neanderthals b y mo dern humans, we found a decreasing trend b oth in the P arameter mean min max prior DNA parameters Mutation rate µ 2.5 × 10 − 8 1.3 × 10 − 8 5.05 × 10 − 8 G Recom bination rate ρ 10 − 8 0 . 1 × 10 − 8 1 . 5 × 10 − 8 G Demographic parameters Ancestral p opulation size N 10000 500 40000 G Time of exo dus from Africa T E 1.88 × 10 6 1.25 × 10 6 2.5 × 10 6 U Time of Europ ean-Asian split T E − E A 25010 12520 37500 U Migration rate m 2 × 10 − 4 10 − 6 4 × 10 − 3 ND African p opulation size N A 10000 500 40000 U Europ ean population size N E 10000 500 40000 U East-Asian p opulation size N E A 10000 500 40000 U T able 3: Description of the prior distributions of simulate d p ar ameters. U and G denote Uniformly and Gamma distribute d distributions, ND (for not dr awn). Times ar e expr esse d in numb er of ye ars (gener ation times of 25 ye ars). The mo dern migr ation r ates, m , is the pr op ortion of migr ants after the Out-of-Afric a exo dus. The mutation r ate, µ , is expr esse d in p er gener ation p er b ase, and the r e c ombination r ate, ρ , is expr esse d in p er gener ation p er p air of adjac ent b ases. exp ected deviance ¯ D 1 and in DIC 1 . F or high v alues of the replacement rate, δ , ¯ D 1 and DIC 1 w ere close to eac h other (Figure 7). These indices fav ored mo dels exhibiting high v alues of the parameter δ and lo w levels of genetic introgression of the h uman genetic p o ol by Neanderthal genes (Green et al 2010). Conclusion Mo del selection using ABC algorithms is notoriously difficult (Csill ´ ery et al 2010b), and it has b een the topic of an in tense debate in evolutionary genetics (T empleton 2009, Beaumon t et al 2010, Rob ert et al 2011). As w e ha ve shown in this study , some appro ximations of model probabilities computed by coun ting replicates from each mo del falling at a distance smaller than a given v alue, , to the observ ed data can potentially lead to systematic errors in ABC, es pecially when is not small. Using small acceptance rates implies, ho wev er, that gigantic n umbers of sim ulations are p erformed, esp ecially when more than ten summary statistics are used. Our purp ose here was not to argue that any mo del choice previously p er- formed in ABC studies on the basis of appro ximate model probabilities is unreli- able. Indeed, inconsistencies in mo del predictions ma y still b e detected b y using standard p osterior predictive model chec king pro cedures. In addition we do not argue that regression adjustments are problematic, and the results obtained [0 , 0 . 1] [0 . 2,0 . 3] [0 . 4,0 . 5] [0 . 6,0 . 7] [0 . 8,0 . 9] 10 20 30 40 Replacementrateintervals ● ● ● ● ● ● ● ● ● ● ● ● ● ● ● ● ● ● ● ● ExpectedDeviance DIC Figure 7: R eplac ement of Ne anderthals by mo dern humans. Exp e ct e d Devianc e, ¯ D 1 , and DIC 1 for mo dels with differ ent prior distributions on the r eplac ement r ate, δ . The prior distributions ar e uniform over intervals of length 0.1. Each interval is de duc e d by tr anslation of h = 0 . 05 fr om the pr evious one. under our simulation mo dels should motiv ate users to apply these corrections systematically . Regression adjustments can correct the p osterior v alues obtained from the rejection algorithm, but they hav e no effect on p osterior mo del probabilities. T o o vercome this p otential issue, we argue that mo del selection should b e done for the statistical distributions that corresp ond to the transformed mo del, and w e prop ose an approach based on the ev aluation of p osterior predictive quanti- ties. Our solution is based on the formulation of an appro ximate deviance, and b ypasses the estimation of p osterior mo del probabilities. Our simulation study sho wed that the concepts of approximate deviance provide reasonable answers to the mo del choice issue in the p opulation genetic examples tested, which are represen tative of this field (Beaumon t 2010, Nielsen and W akeley 2001). Finally w e emphasize that since the computation of DIC is based on posterior predictiv e distributions, this approac h applies to any type of ABC algorithm. References [1] Ak aike H (1974) A new lo ok at the statistical mo del identification. IEEE T rans Automat Control 19: 716 - 723. [2] Bazin E, Dawson KJ, Beaumon t MA (2010) Lik eliho od-free inference of p opulation structure and lo cal adaptation in a Bay esian hierarchical mo del. Genetics 185: 587-602. [3] Beaumon t MA, Zhang W, Balding DJ (2002) Appro ximate Bay esian com- putation in p opulation genetics. Genetics 162: 2025 - 2035. [4] Beaumon t MA (2008) Joint determination of topology , divergence time, and immigration in p opulation trees. In Simulation, Genetics, and Human Pre- history (Matsumura, S., F orster, P . and Renfrew, C., eds) McDonald Insti- tute for Arc haeological Research. [5] Beaumon t MA, Cornuet JM, Marin JM, Rob ert CP (2009) Adaptiv e ap- pro ximate Bay esian computation. Biometrik a 96: 983-990. [6] Beaumon t MA, Nielsen R, Rob ert CP , Hey J, Gaggiotti OE, et al (2010) In defence of mo del-based inference in phylogeograph y . Molecular Ecology 19: 436 - 446. [7] Beaumon t MA (2010) Appro ximate Ba yesian Computation in Ev olution and Ecology . Ann ual Review of Ecology , Ev olution, and Systematics 41: 379-406. [8] Bortot P , Coles SG, Sisson SA (2007) Inference for stereological extremes. J Am Stat Asso c 102: 84 - 92. [9] Blum MGB, F ran¸ cois O (2010) Non-linear regression mo dels for Appro xi- mate Ba yesian Computation. Statistics and Computing 20:63 - 73. [10] Burnham KP , DR Anderson (2002) Mo del selection and multimodel in- ference: a practical information-theoretic approac h. 2nd Edition. Springer- V erlag, New Y ork, New Y ork, USA. [11] Carstens BC, Stoute HN, Reid NM (2009) An information-theoretical ap- proac h to phylogeograph y . Molecular Ecology 18: 4270 - 4282 [12] Celeux G, F F orb es, CP Rob ert, DM Titterington (2006) Deviance infor- mation criteria for missing data models (with Discussion). Ba yesian Analysis 1: 651-706. [13] Corn uet JM, Santos F, Beaumont MA, Rob ert CP , Marin JM, Balding DJ, Guillemaud T, Estoup A (2008) Inferring p opulation history with DIY ABC: a user-friendly approach to appro ximate Ba yesian computation. Bioin- formatics 24:2713-2719. [14] Csill ´ ery K, Blum MGB, Gaggiotti OE, F ran¸ cois O (2010) Approximate Ba yesian Computation in practice. T rends in Ecology and Ev olution 25: 410-418. [15] Csill ´ ery K, Blum MGB, Gaggiotti OE, F ran¸ cois O (2010b) Inv alid argu- men ts against ABC: A reply to AR T empleton. T rends in Ecology and Ev o- lution 25: 490-491. [16] F agundes NJ, Ray N, Beaumont M, Neuensch wander S, Salzano FM, et al (2007) Statistical ev aluation of alternativ e mo dels of human evolution. Pro c Natl Acad Sci USA 104: 17614 - 17619. [17] F a y JC, CI W u (2000) Hitchhiking under positive Darwinian selection. Genetics 155: 1405 - 1413. [18] F ran¸ cois O, MGB Blum, M Jakobsson, N Rosenberg (2008) Demographic history of Europ ean p opulations of Ar abidopsis thaliana . PLoS Genetics 4: e1000075. [19] Gelman A, JB Carlin, HS Stern, DB Rubin (2004) Ba yesian Data Analysis (2nd edn), Chapman and Hall, New Y ork. [20] Green R, Krause J, Briggs A W, Maricic T, Stenzel T (2010) A draft se- quence of the Neandertal genome. Science 328:710 - 722. [21] Grelaud A, CP Rob ert, JM Marin, F Ro dolphe and JF T aly (2009) ABC lik eliho o d-free metho ds for mo del choice in Gibbs random fields. Bay esian Analysis 4: 317-336. [22] Harpending HC, Batzer MA, Gurven M, Jorde LB, Rogers AR, et al. (1998) Genetic traces of ancient demography . Pro c Natl Acad Sci USA 95: 1961 - 1967. [23] Hey J, Mac hado CA (2003) The study of structured p opulations: a difficult and divided science has new hop e. Nature Reviews Genetics 4: 535-543. [24] Hudson RR, Slatkin M, Maddison WP (1992) Estimation of levels of gene flo w from DNA sequence data. Genetics 132: 583-589. [25] Hudson RR (2002) Generating samples under a W right-Fisher neutral mo del. Bioinformatics 18:337-338. [26] Johnson JB, Omland KS (2004) Mo del selection in ecology and evolution. T rends in Ecology and Evolution 19: 101 - 108. [27] Jeffreys H (1961) The Theory of Probability . Oxford Univ ersity Press, Ox- ford UK. [28] La v al G, Excoffier L (2004) SIMCOAL 2.0 A program to simulate genomic div ersity o ver large recombining regions in a sub divided p opulation with a complex history . Bioinformatics 20: 2485 - 2487. [29] La v al G, P atin E, Barreiro LB, Quintana-Murci L (2010) F ormulating a historical and demographic mo del of recent human evolution based on rese- quencing data from nonco ding regions. PLoS ONE 5(4): e10284. [30] Leuen b erger C, W egmann D (2010) Bay esian computation and mo del se- lection without lik eliho o ds. Genetics 184: 243-252. [31] Lopes J, Beaumont MA (2010) ABC: A useful Bay esian to ol for the analysis of p opulation data. Infection, Genetics and Evolution 10: 825-832. [32] Marjoram P , Molitor J, Plagnol V, T av ar´ e S (2003) Marko v ch ain Monte Carlo without lik eliho o ds. Pro c Natl Acad Sci USA 100: 15324 - 15328. [33] Marjoram P , T av ar ´ e S (2006) Mo dern computational approac hes for analysing molecular genetic v ariation data. Nature Review Genetics 7: 759 - 770. [34] Nielsen R, W akeley J (2001) Distinguishing migration from isolation: A Mark ov chain Monte Carlo approac h. Genetics 2001 158: 885-896. [35] P atin E, La v al G, Barreiro LB, Salas A, Semino O, et al. (2009) Inferring the demographic history of African farmers and Pygmy hun ter gatherers using a m ultilo cus resequencing data set. PLoS Genet 5: e1000448. [36] Pritc hard JK, Seielstad MT, Perez-Lezaun A, F eldman MW (1999) Pop- ulation growth of human Y c hromosomes: a study of Y c hromosome mi- crosatellites. Mol Biol Ev ol 16: 1791 - 1798. [37] R Developmen t Core T eam (2010) R: A language and environmen t for sta- tistical computing. R F oundation for Statistical Computing, Vienna, Aus- tria. [38] Ratmann O, Andrieu C, Wiuf C, Richardson S (2009) Model criticism based on lik eliho o d-free inference. Pro c Natl Acad Sci USA 106: 10576-10581. [39] Ripley BD (2004) Selecting amongst large classes of mo dels. In Metho ds and Mo dels in Statistics: In Honour of Professor John Nelder, FRS (Adams, N., Crowder, M, Hand, D.J. and Stephens, D., eds), pp. 155-170 Imp erial College Press. [40] Robert CP , Cornuet J-M, Marin J-M, Pillai NS (2011) Lack of confidence in appro ximate Ba yesian computational (ABC) mo del c hoice. [41] Sisson SA, F an Y, T anak a MM (2007) Sequen tial Monte Carlo without lik eliho o ds. Pro c Natl Acad Sci USA 104: 1760 - 1765. [42] Spiegelhalter DJ, Best NG, Carlin BP , v an der Linde A (2002) Bay esian measures of mo del complexity and fit. J R Stat So c Ser B 64: 583 - 639. [43] T a v ar ´ e S (2004) Ancestral inference in p opulation genetics. In: cole d’t de Probabilits de Saint-Flour XXXI 2001, Lecture Notes in Mathematics. Edited b y Cantoni O, T av ar´ e S, Zeitouni O, eds) Berlin: Springer-V erlag. [44] T a jima F (1989) Statistical metho d for testing the neutral m utation hy- p othesis by DNA p olymorphism. Genetics 123: 585 - 595. [45] T empleton AR (2009) Statistical hypothesis testing in in trasp ecific phylo- geograph y: NCP A versus ABC. Molecular Ecology 18: 319 - 331. [46] Thorn ton KR, Andolfatto P (2006) Appro ximate Bay esian inference re- v eals evidence for a recent, severe, b ottlenec k in a Netherlands p opulation of Dr osophila melano gaster . Genetics 172: 1607-1619. [47] Thorn ton KR (2009) Automating approximate Bay esian computation by lo cal linear regression. BMC Genetics 10:35. [48] T oni T, W elch D, Strelko wa N, Ipsen A, Stumpf MP (2009) Appro ximate Ba yesian computation scheme for parameter inference and mo del selection in dynamical systems. J R So c Interface 6: 187 - 202. [49] T oni T, Stumpf MP (2010) Simulation-based model selection for dynamical systems in systems and p opulation biology . Bioinformatics 26:104-110. [50] W egmann D, Leuenberger C, Excoffier L (2009) Efficient approximate Ba yesian computation coupled with Marko v Chain Monte Carlo without lik eliho o d. Genetics 182: 1207-1218. [51] Wilkinson R (2008) Appro ximate Ba yesian computation (ABC) gives exact results under the assumption of mo del error. arXiv:0811.3355v1 [stat.CO].
Original Paper
Loading high-quality paper...
Comments & Academic Discussion
Loading comments...
Leave a Comment