A statistical analysis of multiple temperature proxies: Are reconstructions of surface temperatures over the last 1000 years reliable?
Predicting historic temperatures based on tree rings, ice cores, and other natural proxies is a difficult endeavor. The relationship between proxies and temperature is weak and the number of proxies is far larger than the number of target data points…
Authors: Blakeley B. McShane, Abraham J. Wyner
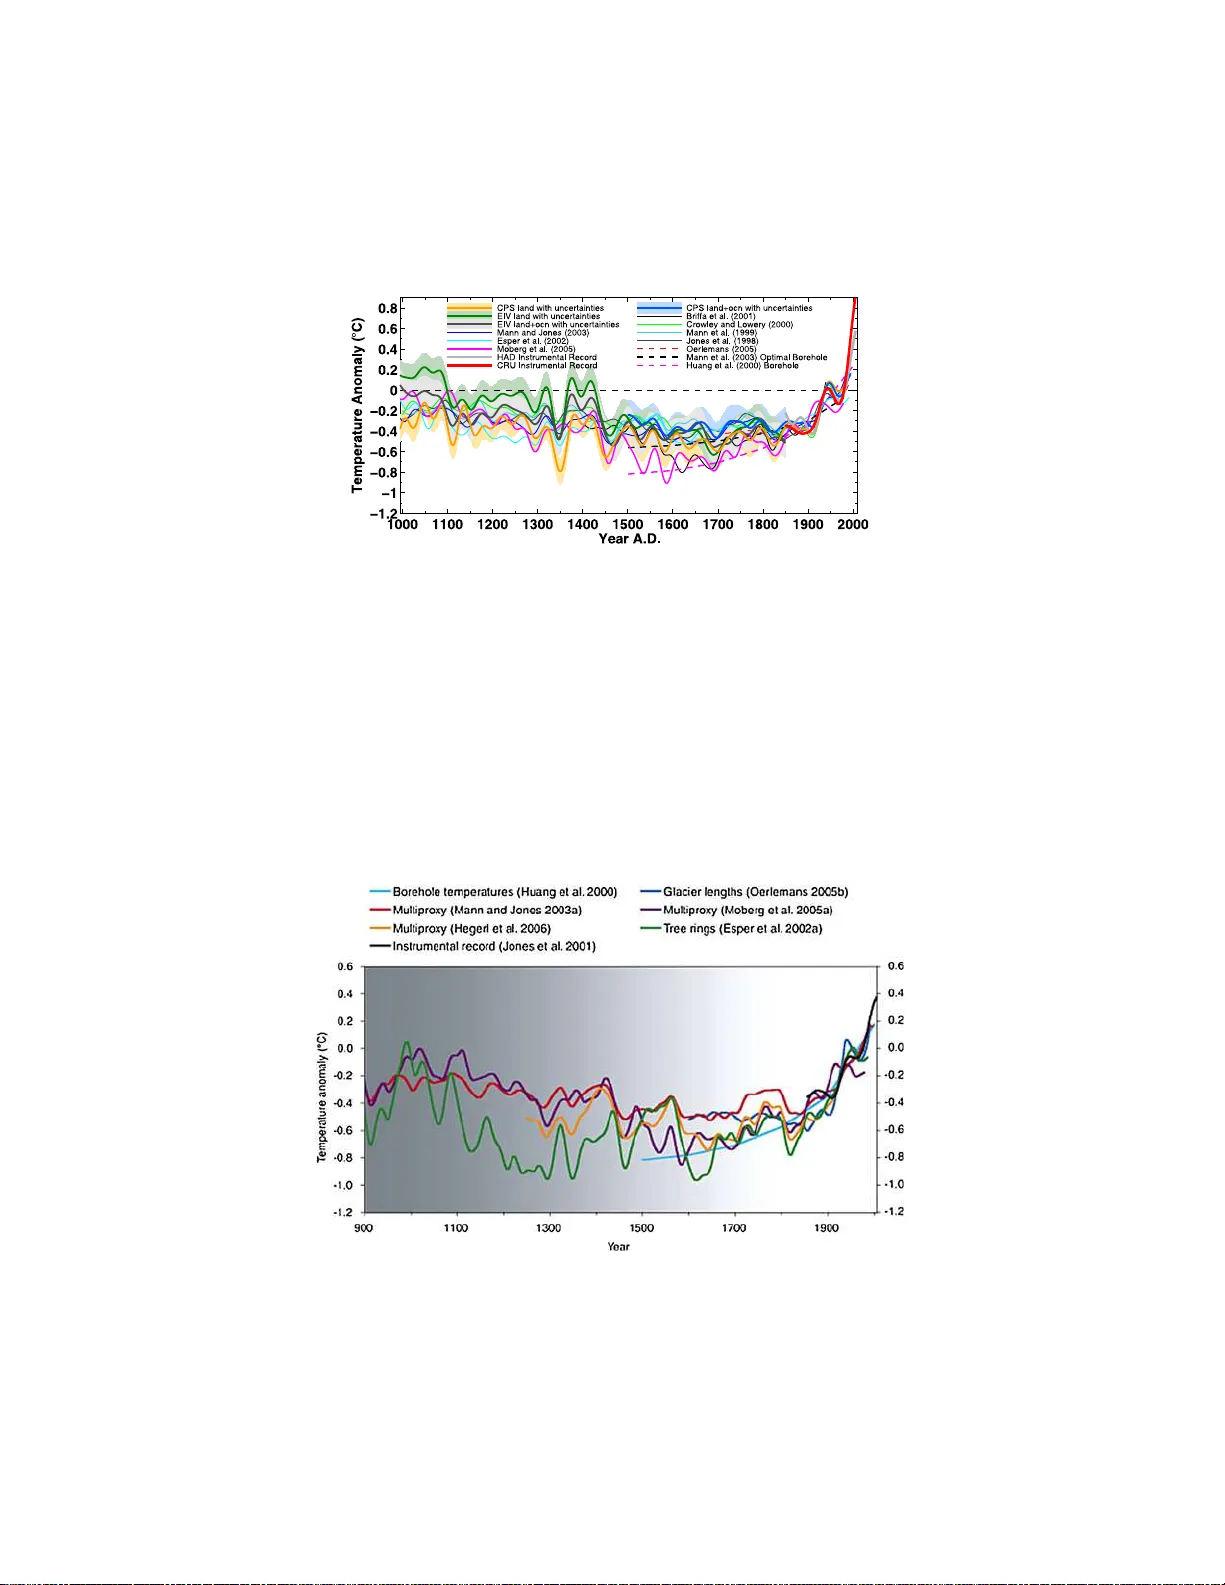
The Annals of Applie d Statistics 2011, V ol. 5, No. 1, 5–44 DOI: 10.1214 /10-A OAS398 c Institute of Mathematical Statistics , 2 011 A ST A TISTICAL ANAL YS IS OF MUL TIP LE TEMPERA TURE PR OXIES: ARE RECONSTRUCTIONS OF SURF A C E TEMPERA TURES O VER THE LAS T 1 000 YEA RS RELIABLE? 1 By Blakeley B. McSha ne and Abraham J. Wyner Northwestern University and the Unive rsity of P e nnsylvania Predicting historic temp eratures based on tree rings, ice cores, and other n atural proxies is a difficult endeav or. The relationship b etw een proxies and temp erature is weak and t h e number of pro xies is far larger than th e num b er of target data p oints. F u rthermore, the data contain complex spatial and temp oral dep endence structures whic h are not easily captu red with simple mo dels. In th is pap er, we assess the reliability of suc h reconstructions and their statistical significance against v arious null mod els. W e fin d that the pro x ies do not predict temp erature significan tly better than ran- dom series generated indep endently of temp erature. F u rthermore, v arious mo del sp ecifications that p erform similarly at predicting tem- p erature produ ce extremely differen t historical back casts. Finally , the proxies seem un able to forecast th e high levels of and sharp run-up in temp erature in the 1990s either in-sample or from contiguous holdout blocks, thus casting doubt on th eir ability to predict such phenomena if in fact they o ccurred sev eral hundred years ago. W e prop ose our o wn reconstruction of Northern H emisphere av- erage annual land temp erature o ver the last millennium, assess its reliabilit y , and compare it to those from the climate science litera- ture. Our model provides a similar reconstruction but has much wider standard errors, reflecting th e w eak signal and large un certain ty en- countered in this setting. 1. In tro d uction. P aleo climatology is the s tu dy of climate and climate chan- ge o v er the scale of the en tire history of earth. A particular area of fo cus is Received January 2010; revised A u gust 2010. 1 Discussed in 10.1214 /10-A OAS398I , 10.1214/10-A OAS398M , 10.1214 /10-A OAS398C , 10. 1214/10 -AO AS 398L , 10.1 214/10 -AO A S 398G , 10.1214 /10-A OAS398D , 10.1214/10-A OAS398H , 10.1214/1 0-AO AS 398B , 10.1214 /10-A OAS398K , 10.1214/10-A OAS398E , 10.1214/10 -AO AS 398F , 10.1214 /10-A OAS398J , 10. 1214/10 - AO AS 409 ; rejoi nder at 10.1214/10-A OAS398 REJ . Key wor ds and phr ases. Climate change, global warming, paleo climatolog y , temp era- ture reconstruction, mo del val idation, cross-v alidation, time series. This is a n elec tr onic reprint of the or ig inal ar ticle published by the Institute of Mathematical Statistics in The Annals of Applie d Statistics , 2011, V ol. 5, No. 1, 5–44 . This r eprint differs from the o riginal in pag ination and t ypo graphic detail. 1 2 B. B. MCSHAN E AND A. J. WYNER temp erature. Since reliable temp erature records t ypically exist for only the last 150 years or f ew er, p aleoclimatologists us e measuremen ts from tree rin gs, ice sheets, and other natural phenomena to estimate p ast temp erature. The k ey idea is to use v arious artifacts of historical p erio ds whic h were strongly influenced by temp erature and whic h sur viv e to the present . F or example, An tarctic ice cores con tain ancien t bu bbles of air whic h can b e dated qu ite accurately . The temp eratur e of that air can b e approximate d by measuring the ratio of ma jor ions and isotop es of o x y gen and h ydr ogen. S imilarly , tree rings measured from old gro wth forests can b e dated to annual resolution, and features can b e extracted which are kno wn to b e related to temp era- ture. The “pro xy r ecord” is comprised of th ese and man y other t yp es of data, including b oreholes, corals, sp eleothems, and lak e sediments [see Bradley ( 1999 ) for detailed descriptions]. Th e basic statisti cal problem is quite easy to explain. Scientists extract, scale, and calibrate the d ata. Th en, a training set consisting of the part of the p ro xy record wh ic h ov erlaps the mo d ern instrumental p erio d (i.e., the past 150 ye ars) is constructed and used to build a mo del. Finally , the mo d el, which maps the proxy record to a sur - face temp erature, is used to back cast or “reconstruct” historical temp era- tures. This effort to reconstruct our planet’s climate history has b ecome link ed to the topic of Ant hrop ogenic Global W arming (AGW ). On the on e hand , this is p eculiar since paleo climatolo gical reconstructions can pro vide evi- dence only for the dete ction of global w arming and ev en then they consti- tute only one su c h source of eviden ce. Th e principal sources of evid en ce for the detection of global wa rming and in particular the attribution of it to an thr op ogenic f actors come from basic science as w ell as General C ircula- tion Mo dels (GCMs) that ha ve b een tun ed to data accum ulated during the instrumental p erio d [IPCC ( 2007 )]. T hese mo d els sho w that carb on d io x- ide, when release d in to the atmosphere in su fficien t concen tration, can force temp erature increases. On the other hand , the effort of world go vernmen ts to pass legislation to cut carb on to pr e-industrial leve ls cannot pr o ceed without the consen t of the go v ern ed and historical reconstructions f rom paleoclimatological mo dels ha ve indeed prov en p ersuasive and effectiv e at winnin g the hearts and minds of the p opulace. C on s ider Figure 1 whic h was featured p r ominen tly in the In tergo v ern men tal P anel on Climate Change r ep ort [IPCC ( 2001 )] in the summary for p olicy mak ers. 1 The sharp u p w ard slop e of the graph in the 1 Figure 1 app eared in IPCC ( 2001 ) and is due to Mann, Bradley and Hughes ( 1999 ) whic h is in turn based on th e analysis of multiple p roxies pioneered by Mann, Bradley and Hughes ( 1998 ). Figure 2 is a “spaghetti graph” of multiple reconstructions app earing in Mann et al. ( 2008 ). Figure 3 app eared in NRC ( 2006 ). A ST A TISTICAL ANA L YS IS OF MUL TIPLE TEMPERA TUR E PRO X IES 3 Fig. 1. Multipr oxy r e c onstruction of Northern H emi spher e surfac e temp er atur e varia- tions over the p ast mil lennium (blue), along with 40 -ye ar aver age (black), a me asur e of the statistic al unc ertainty asso ci ate d with the r e c onstruct ion (gr ay), and instrumental sur- fac e temp er atur e (r e d), b ase d on the work by Mann, Br ad l ey and Hughes ( 1999 ). This figur e has sometimes b e en r ef err e d to as the “ho ckey stick.” Sour c e: IPCC ( 2001 ). late 20th cen tur y is visually striking, easy to compr ehend, and lik ely to alarm. T he IPC C r ep ort go es ev en further: Uncertainties increase in more distant times and are alwa ys muc h larger than in the instrumental record due to the use of relatively sparse p ro x y data. Nevertheless the rate and duration of w arming of th e 20th century has been muc h greater than in an y of the p revious nine centuries. Similarly , i t is likely that the 1990s h a v e b e en the warmest decade an d 1998 the warmest year of th e millenni um. [Emphasis added] Quotations like the ab ov e and graphs like those in Figures 1 – 3 are featured prominentl y n ot only in official do cumen ts lik e the IPCC rep ort but also in widely view ed television programs [BBC ( 200 8 )], in film [Gore ( 2006 )], and in m us eum exp ositions [Rothstein ( 2008 )], alarming b oth the p opu lace and p olicy mak ers. It is not necessary to kn o w v ery muc h ab out the un derlying metho ds to see that graphs suc h as Figure 1 are pr oblematic as descriptiv e d evices. First, the su p erp osition of the in strument al record (red) creates a strong but en tirely misleading con trast. The blue h istorical reconstru ction is n ecessarily smo other with less ov erall v ariation than the red instrumenta l record since the reconstruction is, in a broad sense, a weighte d aver age of al l global temp erature histories conditional on the observ ed p ro xy record. Second, the blue curve closely matc hes the red curv e d uring th e p erio d 1902 AD to 1980 4 B. B. MCSHAN E AND A. J. WYNER Fig. 2. V arious r e c onstructions of Northern Hemi spher e temp er atur es over the last 100 0 ye ars with 95 % c onfidenc e intervals. Sour c e: Mann et al. ( 2008 ). AD b ecause this p erio d has serve d as the training data and therefore the blue curve is calibrated to the r ed during it (note also the red curv e is p lotted from 1902 AD to 1998 AD). Th is sets up the err oneous visual exp ectati on that the r econstructions are more accurate than they really are. A careful view er would kno w to temp er suc h exp ectations by pa ying close atten tion to the reconstruction error bars giv en by th e wide gra y regions. How ev er, ev en these are misleading b ecause these are, in fact, p ointwise confidence in terv als and n ot confidence curves for the ent ire sample p ath of surface Fig. 3. Smo othe d r e c onstruct i ons of lar ge-sc ale (Northern Hemispher e me an or glob al me an) surfac e temp er atur e variations fr om six differ ent r ese ar ch te ams ar e shown along with the instrumental r e c or d of glob al me an surfac e temp er atur e. Each curve p ortr ays a somewhat differ ent hi story of temp er atur e variations and is subje ct to a somewhat differ ent set of unc ertainties that gener al ly i ncr e ase going b ackwar d in time (as indi c ate d by the gr ay shading). Sour c e: NRC ( 2006 ). A ST A TISTICAL ANA L YS IS OF MUL TIPLE TEMPERA TUR E PRO X IES 5 temp erature. F urthermore, the gra y regions themselve s fail to accoun t for mo del uncertain ty . 2. Con trov ersy . With so muc h at stak e b oth fin an cially and ecolog ically , it is not surprising that these analyses ha ve pro vok ed seve ral con trov ersies. While some h a ve recen tly eru p ted in the p op u lar press [Jolis ( 2009 ), Johnson ( 2009 ), Johnson and Naik ( 2009 )], w e ro ot our discu s sion of these con tro- v ersies and their h istory as th ey unf olded in the academic and scien tific literature. The firs t ma jor con tro v ersy eru pted w hen McInt yre and McKitric k (M&M) successfully replicated the Mann, Bradley and Hughes ( 1998 ) study [McIn- t yre and McKitrick ( 2003 , 2005a , 2005 b )]. M&M observed that the original Mann, Brad ley an d Hughes ( 1998 ) stu d y (i) used only one p rincipal com- p onent of the pr o xy record and (ii) calculated the pr incipal comp onen ts in a “skew”-c en tered fashion suc h that th ey w er e cen tered b y the mean of the pro x y data o ve r the in s trument al p erio d (instead of the more standard tec h- nique of cente ring by the mean of the en tire d ata record). Given that the pro x y series is itself auto-correlated, this scaling has the effect of pro d uc- ing a first p rincipal comp onen t whic h is ho ck ey-stic k shap ed [McIn tyre and McKitric k ( 2003 )] and, th u s, ho c k ey-stic k sh ap ed temp erature reconstruc- tions. T hat is, the ve ry metho d used in Mann, Bradley and Hu ghes ( 1998 ) guaran tees the s h ap e of Figure 1 . M&M made a fur ther con tribution b y ap- plying the Mann, Bradley and Hughes ( 1998 ) r econstruction metho dology to p rincipal comp onen ts computed in the standard fashion. The resulting reconstruction sh o wed a rise in temp eratur e in the mediev al p erio d, th us eliminating the h o c ke y stic k shap e. Mann and his colleag u es vigorously r esp onded to M&M to justify the ho c key stick [Mann, Bradley and Hughes ( 2004 )]. T h ey argued that on e should not limit on eself to a single principal comp onen t as in Mann, Bradley and Hughes ( 1998 ), bu t, r ather, one should select the num b er of p r incipal comp onen ts retained through cross-v alidation on two blo cks of heldout in- strumenta l temp erature records (i.e., the fi rst 50 y ears of the instrumental p erio d and the last 50 y ears). When this pro cedure is follo wed, four prin - cipal comp onen ts are retained, and the ho c key stic k re-emerges ev en when the PCs are calculated in the stand ard fashion. Since the ho ck ey stic k is the shap e selected by v alidation, climate scien tists argue it is therefore the correct one. 2 The furor reac hed such a lev el that Congress to ok u p the matter in 2006. 2 Climate scientists call such reconstructions “more skilled.” Statisticians would say they hav e lo wer out-of-sample root mean square error. W e t ak e u p t h is sub ject in detail in Section 3 . 6 B. B. MCSHAN E AND A. J. WYNER The C hairman of the Committee on Energy and C ommerce and that of the Sub committee on Ov ersigh t and I nv estigations formed an ad ho c com- mittee of statisticians to review the fi ndings of M&M. Th eir Congressional rep ort [W egman, Scott and Said ( 2006 )] confir med M&M’s finding regarding sk ew-cente red principal comp onen ts (this fi nding w as ye t again confirmed b y the National Researc h Council [NR C ( 2006 )]). In h is Congressional testimony [W egman ( 2006 )], committee c hairman Edwa rd W egman excoriated Mann , Bradley and Hughes ( 2004 ) for use of additional pr incipal comp onents b ey ond the first after it was sho wn that their metho d led to s purious r esults: In th e MBH orig inal, the h ocke y stick emerged in PC1 from the bristlecone/ fo x tail pines. I f one cen ters the data prop erly th e ho c key stick d oes not emerge until PC4. Th u s, a sub stan tial change in strategy is required in t h e MBH re- construction in ord er to achiev e the ho ck ey stick, a strategy which w as specif- ically esc h ewed in MBH. . . a cardin al ru le of statistical inference is th at the metho d of analysis must b e decided b efore looking at the data. The rules and strategy of analysis cannot b e changed in order to ob t ain the desired result. Such a strategy carries no statistical in t egrity and cann ot be used as a basis for draw ing sound inferential conclusions. Mic hael Mann, in his rebuttal testimon y b efore Congress, adm itted to h a ving made some q u estionable c hoices in his early work. Bu t, he s tr ongly asserted that none of th ese earlier pr oblems are still relev an t b ecause his original findings ha ve b een confirmed again and again in subsequ en t p eer reviewe d literature by large n umb ers of highly qualified climate s cientists using v astly expanded data records [e.g., Mann and Ruth erford ( 2002 ), Luterbac her et al. ( 2004 ), Mann et al. ( 2005 , 2007 , 2008 ), Ru therford et al. ( 2005 ), W ahl and Amman ( 2006 ), W ahl, Ritson and Amman ( 2006 ), Li, Nyc hk a and Amman ( 2007 )] ev en if criticisms do exist [e.g., von Storc h et al. ( 2004 )]. The d egree of con tr o v ersy asso ciated with this endea vo r can p erh aps b e b etter u ndersto o d by r ecalling W egman’s assertion that there are very few mainstream statisticia n s w orking on climate reconstructions [W egman, Scott and Said ( 2006 )]. Th is is p articularly surpr ising not only b ecause th e task is highly statistical b ut also b ecause it is extremely difficult. The data is spatially and temp orally auto correlated. It is massive ly in complete. It is not easily or accurately mo deled b y simple autoregressiv e pro cesses. The signal is v ery weak an d the num b er of co v ariates greatly outn umb ers th e n u m b er of indep endent observ ations of instrumenta l temp erature. Mu ch of the analysis in this pap er explores some of the difficulties asso ciated with mo del selectio n and prediction in just suc h cont exts. W e are not in terested at this stage in engaging the issues of data qualit y . T o wit, h enceforth and A ST A TISTICAL ANA L YS IS OF MUL TIPLE TEMPERA TUR E PRO X IES 7 for the remainder of the pap er, we w ork en tirely with the data fr om Mann et al. ( 2008 ). 3 This is b y far the most comprehensiv e p ublicly a v ailable d atabase of tem- p eratures and pr oxies collec ted to date. It conta in s 1209 climate pr oxies (with some going b ac k as far as 8855 BC and some conti n u ing up till 2003 AD). It also con tains a database of eight global ann u al temp erature aggre- gates dating 1850–2006 AD (expressed as d eviatio ns or “anomalies” from the 1961 –1990 AD a v erage 4 ). Finally , there is a d atabase of 1732 local an- n u al temp eratures dating 1850–2006 AD (also exp ressed as anomalies from the 1961–19 90 AD a verage ). 5 All thr ee of these d atasets ha v e b een s ub- stan tially pr o cessed includ ing smo othing and imp u tation of m issing data [Mann et al. ( 2008 )]. Wh ile these p resen t interesting p roblems, they are not the fo cus of our inquiry . W e assume that the data selection, collect ion, and pr o cessing p erformed b y climate scient ists meets the standards of their discipline. Without taking a p osition on these data qualit y issues, w e thus tak e the dataset as giv en. W e further make the assumptions of linearit y and stationarit y of the r elationship b etw een temp erature and pr o xies, an as- sumption emplo ye d throughout the climate science literature [NR C ( 2006 )] noting that “the s tationarit y of the relationship do es not requir e station- arit y of the series th emselv es” [NR C ( 2006 )]. Eve n with these sub stan tial assumptions, the p aleoclimatologica l r econstructiv e endea v or is a ve ry diffi- cult one and w e fo cu s on the su bstan tiv e mo deling problems encount ered in this setting. Our pap er structur e and ma jor r esults are as follo ws. W e first d iscuss the strength of the pro xy signal in this p ≫ n con text (i.e., when the num b er of co v ariates or parameters, p , is muc h larger than the n u m b er of datap oin ts, n ) by comparing the p erformance, in term s of holdout RMSE, of the pr o xies against several alternativ es. Su c h an exercise is imp ortant b ecause, when p ≫ n , there is a sizeable risk of o verfitting and in-sample p erformance is often a p o or b enc hmark for out-of-sample p erformance. W e will sh o w that the proxy record easily do es b etter at pr edicting out-of-sample global temp erature than simple r apidly-mixing stationary p ro cesses generated ind ep endently of 3 In the sequel, w e provide a link to The Annals of Applie d Statistics arc hive whic h hosts the data and code we used for this pap er. The Mann et al. ( 2008 ) data can b e found at http://www.meteo.psu.edu/ ~ mann/supplemen ts/ Multiprox yMeans07/ . How ever, we urge caution because this w ebsite is p eriodically up dated and therefore ma y not match the data we used even th ough at one time it did. F or the purp oses of this p aper, p lease follo w our link to The Annals of Applie d Statistics archiv e. 4 F or details, see http://www.cru.uea.ac.uk/cru/data/temperature /. 5 The Mann et al. ( 2008 ) original begins with the HadCRUT3v local temp erature data giv en in the previous link. T emperatures are given on a five degree longitude by five degree latitude grid. This would imply 2592 cells in the global grid. Mann et al. ( 2008 ) disqu alified 860 such cells b ecause they con tained less th an 10% of the ann ual data thus leaving 1732. 8 B. B. MCSHAN E AND A. J. WYNER the true temp erature record. On the other hand, th e p ro xies do not fare so w ell w hen compared to p redictions made by more complex pr o cesses also generated indep end ently of an y climate signal. That is, randomly generated sequences are as “predictiv e” of holdout temp eratures as the pro xies. Next, we sho w th at v arious mo dels for p redicting temp erature can p er- form similarly in term s of cross-v alidated out-of-sample R MS E but ha v e v ery differen t historical temp erature bac k casts. Some of these bac kc asts lo ok lik e ho c key stic ks while others do n ot. Thus, cross-v alidation is inadequate on its o wn for mod el and bac kc ast selectio n. Finally , w e construct and fit a full probabilit y mo del for the relationship b et ween the 1000-y ear-old pro x y database and Northern Hemisp here av erage temp erature, pro v id ing app ropriate p athwise standard errors whic h accoun t for parameter uncertaint y . While our m o del offers su pp ort to the conclusion that the 1990s were the w armest decade of the last millennium, it do es not predict temp erature as we ll as exp ected ev en in-sample. The mo del do es muc h wo rse on cont iguous 30-y ear holdout blo c ks. Thus, w e remark in conclusion that natural pro xies are sev erely limited in their abilit y to predict a ve rage temp eratures and temp erature gradients. All data and co de used in this p ap er are pr o vided in the supp lemen tary materials [McShane and Wyner ( 2011 )]. 3. Mo del ev aluation. 3.1. Intr o duction. A critical difficult y for paleo climatolo gical reconstruc- tion is that the temp erature signal in the p ro xy record is sur prisingly w eak. That is, v ery few, if an y , of the ind ividual natural pro x ies, at least those that are uncon taminated by the do cumen tary record, are able to explain an appreciable amoun t of the annual v ariation in the lo cal instrumental tem- p erature records. Neve rtheless, the pro xy record is quite large, creating an additional c h allenge: there are many m ore pr o xies th an there are years in the instru men tal temp erature record. In this setting, it is easy for a mo d el to o v erfit the comparativ ely short instrum ental r ecord and therefore mo d el ev aluatio n is esp eciall y imp ortan t. Th u s, the main goals of th is section are t wofol d. First, w e end ea v or to ju d ge regression-based metho ds f or the sp e- cific task of predicting blo c ks of temp eratur es in the instru men tal p eriod . Second, w e stud y sp ecifically ho w the determin ation of statistical signifi- cance v aries un der differen t sp ecificati ons of th e n u ll distribution. Because the n u mb er of pr o xies is muc h greater than the n um b er of ye ars for whic h we ha ve temp erature data, it is una voidable that some t yp e of dimensionalit y r eduction is necessary ev en if there is no pr incipled w ay to ac hiev e this. As men tioned ab ov e, early stud ies [ Mann, Bradley and Hughes ( 1998 , 199 9 )] used p rincipal comp on ents analysis for this pu rp ose. Alterna- tiv ely , the num b er of p ro xies can b e lo we red th r ough a threshold scr eenin g A ST A TISTICAL ANA L YS IS OF MUL TIPLE TEMPERA TUR E PRO X IES 9 pro cess [Mann et al. ( 2008 )] wh ereb y eac h p ro xy sequence is correlated with its closest lo cal temp erature series and only those pr o xies wh ose correlation exceeds a given thr eshold are retained for mo del building. Th is is a rea- sonable approac h, but, for it to offer serious p r otectio n from ov erfitting the temp erature sequence, it is necessary to detect “spurious correlations.” The problem of spu r ious correlation arises w hen one tak es the correla- tion of t wo series wh ic h are themselve s highly auto corr elated and is well studied in the time series and econometrics literature [Y ule ( 192 6 ), Granger and Newb old ( 1974 ), Ph illips ( 1986 )]. Wh en t wo ind ep endent time s eries are nonstationary (e.g., random w alk), locally n onstationary (e.g., r egime switc hin g), or strongly auto correlated, then th e distr ib ution of the empiri- cal correlation co efficient is su rprisingly v ariable and is fr equen tly large in absolute v alue (see Figure 4 ). F u rthermore, standard mo del statistics (e.g., t -statistics) are inaccurate and can only b e corrected wh en the un derlying sto c hastic pr o cesses are b oth kno wn and mo d eled (and this can only b e done for sp ecial cases). As can b e seen in Figures 5 and 6 , b oth the in strumenta l temp erature record as we ll as man y of the pr o xy sequ ences are not app r opriately mo deled b y lo w order statio nary autoregressive pro cesses. Th e dep enden ce structur e in the data is clearly complex and quite eviden t from the graphs. More quan titativ ely , w e observe that the sample first-order auto correlation of the CR U Northern Hemisphere annual m ean land temp erature series is nearly 0.6 (with signifi can t p artial auto correlations out to lag four). Among the pro x y sequences, a f u ll one-third ha ve empirical lag one auto correlations of at least 0.5 (see Figure 7 ). Th u s, standard correlation co efficien t test statistics are not reliable measures of significance for screening pro xies against lo cal or global temp eratur es series. A final more subtle and salien t concern is that, Fig. 4. Simulate d sample c orr elation c o efficient distribution of two indep endent r andom walks. One thousand indep endent p ai rs of r andom walks e ach of length 149 wer e sample d to gener ate the ab ove histo gr am. 10 B. B. MCSHAN E AND A. J. WYNER Fig. 5. CRU Northern Hemispher e annual m e an land temp er atur e, CRU Southern Hemi- spher e annual me an land temp er atur e, and four lo c al temp er atur es the grids of which c on- tain (i) Spitsb er gen island in the Svalb ar d ar chip el ago in the Art ic, (ii) the north p ortion of the Om sk oblast in southweste rn Si b eria, (iii) A ttu Island, the w esternmost island i n the Aleut ian islands ar cip elago, and (iv) Baysuat in the Aktob e Pr ovinc e, Kazakhstan. The x-axis gives the ye ar and the y-axis gives the temp er atur e anomaly fr om 1961–1990 AD aver age in de gr e es Celsius. if the screenin g pro cess inv olv es the en tire instrumenta l temp erature record, it corrup ts the mo d el v alidation p ro cess: no subsequence of th e temp erature series can b e truly consid ered out-of-sample. T o solv e the problem of spu rious correlation, climate scient ists ha v e used the tec hnique of out-of-sample v alidation on a reserv ed holdout blo c k of data. The p erform ance of an y giv en r econstruction can then b e b enc hm arked and compared to the p erformance of v arious null mo dels. This will b e our approac h as wel l. Ho wev er, w e extend their v alidation exercises b y (i) ex- panding the class of n u ll mo dels and (ii) considering int erp olated holdout blo c ks as w ell as extrap olated ones. 3.2. P r eliminary evaluation. In this su b section, w e discuss our v alida- tion sc heme and compare the predictiv e p erformance of the pro xies against t wo simple mo dels whic h use only temp er atur e itself for forecasting, the in-sample mean and ARMA mo dels. W e u se as our resp ons e y t the CR U Northern Hemispher e annual mean land temp erature. X = { x tj } is a cen- A ST A TISTICAL ANA L YS IS OF MUL TIPLE TEMPERA TUR E PRO X IES 11 Fig. 6. Six pr oxy time series plotte d during the i nstrumental p erio d: sp ele othems in Sc ot- land, monso ons in India, lake se dim ent i n Ecuador; tr e e rings in Montana, dry/wet vari- ation on the Y el low River, and lake se diments in Finl and. tered and s caled matrix of 1138 of the 1209 pro xies, exclud ing the 71 Lutannt series found in Luterbacher et al. ( 2004 ). 6 W e use the y ears 1850–1998 AD for these tests b ecause v ery few pro xies are a v ailable after 1998 AD. 7 T o assess the strength of the relationship b et we en the natural proxie s and temp erature, w e cross-v alidate the data. T his is a standard approac h , bu t our situation is at ypical since the temp erature sequence is highly auto corre- lated. T o mitigate this p roblem, we follo w the appr oac h of climate scien tists in our i ni tial approac h and fit the instrumenta l temp erature record using only pr o xy cov ariates. Nev er th eless, th e errors and th e pro xies are temp o- rally correlated whic h implies that the u s ual metho d of selecting r andom holdout sets will not pro vide an effectiv e ev aluation of our m o del. Climate scien tists ha ve instead applied “blo c k” v alidation, holding out t w o con tigu- ous b lo c ks of instrumental temp eratures: a “fron t” b lo ck consisting of the 6 These Lu tannt “proxies ” are actually reconstructions calibrated to local temp eratures in Europe and thus are not true n atural pro xies. The pro xy database ma y contain other nonnatural proxies t hough we do not believe it do es. The qu alitative con clusions reac h ed in this section hold up, how ever, ev en when all 1209 proxies are u sed. 7 Only 103 of the 1209 p ro x ies are a v ailable in 1999 AD, 90 in 2000 AD, eight in 2001 AD, five in 2002 AD, and t h ree in 2003 AD. 12 B. B. MCSHAN E AND A. J. WYNER Fig. 7. Sample lag one auto c orr elation c o efficient for the 1209 pr oxies during the instru- mental p erio d. first 50 years of the instrum ental r ecord and a “bac k” blo c k consisting of the last 50 y ears. On the one hand, th is approac h makes sense s in ce ou r u ltimate task is to extrap olate our d ata bac kward in time and only the first and last b lo cks can b e us ed for this purp ose sp ecifical ly . O n the other hand , limiting the v ali- dation exercise to these tw o blo c k s is problematic b ecause b oth blo cks ha ve v ery d r amatic and obvio u s features: the temp eratures in the initial blo ck are fairly constant and are the coldest in the instrumental record, whereas th e temp eratures in the fi nal blo c k are rapidly increasing an d are the wa rmest in th e instru men tal record. Th us, v alidation conducted on these t wo b lo cks will prima facie fav or pro cedures whic h pro ject th e local lev el and gradien t of the temp erature near the b oun dary of the in-sample p erio d. How ev er, while suc h pro cedures p erform w ell on the front and b ac k blo cks, they are not as comp etitiv e on in terior b lo c ks. F ur th ermore, they cannot b e used for plausible historical reconstructions! A fi nal serious problem with v alidating on only the fron t and bac k blo c ks is that the extreme c h aracteristics of these blo c ks are w idely kno w n; it can only b e sp eculated as to what exten t the collect ion, scaling, and p ro cessing of the pr oxy d ata as well as mo deling c hoices hav e b een affected b y this kno w ledge. Our app roac h is to consecutive ly select all p ossible cont iguous blo c ks for holding out. F or example, we take a giv en con tiguous 30-y ear blo c k f rom the 149-y ear instrumental temp erature record (e.g., 1900 –1929 AD) and hold it out. Using only the remaining 119 y ears (e.g, 1850–18 99 AD and 1930 –1998 AD), we tune and fi t our mo d el. Finally , w e then use th e fitted mo del to obtain pr edictions for eac h of the 30 y ears in the holdout blo ck and then calculate the RMSE on this blo ck. W e then rep eat the pro cedu re outlined in the previous paragraph o v er all 120 p ossible contig uous holdout blo c ks in order to approximate the A ST A TISTICAL ANA L YS IS OF MUL TIPLE TEMPERA TUR E PRO X IES 13 distribution of the holdout RMSE that is exp ected using th is pr o cedure. 8 W e note this test only giv es a s en se of the ability of the pr o xies to p redict the instrumental temp er atur e r e c or d and it s ays little ab ou t the abilit y of the proxi es to pr ed ict temp erature sev er al h u ndred or thousand y ears bac k. Climate scien tists ha ve argued, ho wev er, that th is long-term extrap olation is scientifical ly legitimate [Mann, Bradley and Hu ghes ( 1998 ), NR C ( 2006 )]. Throughout this section, we assess the strength of the pr o xy signal by building mo dels for temp er atur e using the Lasso [Tibshirani ( 1996 )]. T he Lasso is a p enalized least squares metho d w hic h selects ˆ β Lasso = arg min β ( n X i =1 y i − β 0 − p X j = 1 x ij β j ! 2 + λ p X i =1 | β i | ) . As can b e seen, the in tercept β 0 is n ot p enalized. T ypically (and in th is pap er), the m atrix of pred ictors X is cen tered and scaled, and λ is c hosen b y cross-v alidation. Due to the L 1 p enalt y , the Lasso tends to c h o ose sparse ˆ β Lasso , th us serving as a v ariable selec tion metho dology and alleviat ing th e p ≫ n p roblem. F urthermore, since the Lasso tends to s elect only a few of a set of correlated pred ictors, it also helps reduce the p r oblem of spatial correlation among the pro xies. W e select the Lasso tuning parameter λ by p erforming ten rep etitions of fiv e-fold cross-v alidation on th e 119 in-sample y ears and choosing the v alue λ = ˆ λ whic h provides the b est RMSE. W e then fit the Lasso to the f u ll 119-y ear in -sample dataset using λ = ˆ λ to obtain ˆ β Lasso . Finally , w e can use ˆ β Lasso to obtain predictions for eac h of the 30 y ears in the h oldout blo c k an d then calculate the RMSE on this blo c k. W e chose the Lasso b ecause it is a reasonable pro cedure th at h as pro v en p o w erfu l, fast, and p opu lar, and it p erforms comparably we ll in a p ≫ n con text. Thus, w e b eliev e it should provide predictions wh ic h are as goo d or b etter than other metho d s that w e hav e tried (evidence for this is p resen ted in Figure 12 ). F urthermore, w e are as muc h inte rested in how the p ro xies fare as predictors when v arying the holdout blo c k and null distribution (see Sections 3.3 and 3.4 ) as we are in p erformance. In fact, all analyses in this 8 W e performed tw o v ariations of this pro cedure. In the fi rst va riation, we contin u ed to hold out 30 years; how ever, we calculated the RMSE for only the middle 20 yea rs of the 30-yea r holdout block, lea v in g out th e first five and last five years of eac h block in order to reduce the correla tion b etw een holdout blocks. In the second v ariation, w e rep eated this proced ure using 60-year holdout blo cks. In b oth cases, all qualitative conclusions remained the same. Considering smaller holdout blo cks such as 15 years could b e an interesting extension. How ever, o ver such short interv als, th e global temp erature series itself pro v ides substantial signal even without the use of pro xies. F urth ermore, given the small size of the dataset and lac k of indep endence b etw een 15-, 30-, and 60-y ear holdout blo cks, this migh t raise concerns about o verfitting and ov er-interpreting the data. 14 B. B. MCSHAN E AND A. J. WYNER section ha ve b een rep eated u sing mo deling pro cedures other than the L asso and qualitat iv ely all results remain more or less the same. As an initial test, we compare the holdout R MS E u s ing the proxies to t wo simple mo dels wh ic h only mak e u se of temp erature data, the in -sample mean and ARMA m o dels. First, the pr o xy mo del and th e in-sample mean seem to p erf orm fairly similarly , with the proxy-based mo d el b eating the sample mean on only 57% of holdout blo c ks. A p ossible reason the sample mean p erforms comparably well is that the in strumenta l temp erature record has a great d eal of annual v ariation whic h is apparently uncaptur ed by the pro x y record. I n such settings, a biased lo w-v ariance predictor (suc h as the in-sample mean) can often ha v e a lo w er out-of-sample RMSE than a less biased but more v ariable predictor. Finally , we observ e that th e p erform ance on d ifferen t v alidation blo c ks are not in dep endent, an issu e wh ich we return to in Section 3.4 . W e also compared the holdout RMS E of the pro xies to another more sophisticated mo del whic h , like the in-sample mean, only mak es use of tem- p erature data and mak es no reference to proxy data. F or eac h holdout blo c k, w e fit v arious ARMA( p , q ) mo dels; we let p and q r ange from zero to five and chose the v alues which giv e the b est AIC. W e then use this mo del to forecast the temp erature on the holdout b lo ck. This mod el b eats the pr o xy mo del 86% of the time. In Figure 8 , we fo cus on one particular h oldout blo c k, the last 30 years of the series. 9 The in -sample mean and the ARMA mo del completely miss the rising trend of the last 30 years; in fact, b oth mo dels are essen tially useless for bac k casting and forecasting since their long-term pred iction is equal to the in-sample mean. On the other hand, the record of 1138 pro xies do es app ear to capture the rising trend in temp er atur es (in the sequel, w e will assess the statistical s ignificance of this). F urthermore, th e differences in temp erature and the differences in the p ro xy forecast are significan tly correlated ( p = 0 . 021), with the same sign in 21 out of the 29 y ears ( p = 0 . 026). 3.3. V alidatio n against pseudo-pr oxies. Because b oth the in-sample mean and the ARMA mo del alw a y s forecast the mean in the long-term, they are not particularly u seful mo dels for the scien tific end eav or of temp erature reconstruction. F urthermore, the fact that the Lasso-selecte d linear com bi- nation of the pro xies b eats the in-sample mean on 57% of holdout blo cks and the ARMA mod el on 14% of holdout blo c ks is difficult to interpret without solid b enc h marks of p erformance. 9 In this and all sub sequent figures, smo oths are created b y using t he loess function in R with the span set to 0.33. A ST A TISTICAL ANA L YS IS OF MUL TIPLE TEMPERA TUR E PRO X IES 15 Fig. 8. CRU Northern Hemispher e annual me an land temp er atur e is given by the thin black line and a smo othe d version i s given by the thick black line. The for e c ast pr o duc e d by applying the L asso to the pr oxies is given by the thin r e d li ne and a smo othe d version is given by the thick r e d line. The i n-sample me an i s given by the horizontal blue li ne. The for e c ast pr o duc e d by ARMA mo deling is given by the thin gr e en l ine and a smo othe d version i s given by the thick gr e en line. The L asso and ARMA mo dels and the me an ar e fit on 1850–1968 AD and for e c ast on 1969–1998 AD. One w a y to provide b enc hmarks is to rep eat the Lasso pro cedure outlined ab o ve u sing 1138 “pseud o-pr o xies” in lieu of the 113 8 real pro xies. That is, replace the n atural proxie s of temp erature b y an alternate set of time series. An y function of the proxie s, with their resultant temp erature reconstruction, can b e v alidated by comparin g th e abilit y of the proxie s to predict out-of- sample instrument al temp eratures to the abilit y of th e pseud o-pro xies. The use of pseudo-proxies is quite common in the climate science liter- ature where pseudo-proxies are often built by addin g an AR1 time series (“red noise”) to n atural pr o xies, lo cal temp eratures, or sim u lated temp er- atures generated from General Circulation Mo dels [Mann and Rutherford ( 2002 ), W ahl and Amman ( 2006 )]. These pseudo-proxi es determine whether a give n reconstruction is “skillful” (i.e., statisticall y significan t). Skill is demonstrated with resp ect to a class of pseu do-pro xies when the true pro xies outp erform the p seudo-pro xies with high p robabilit y (probabilities are ap- pro x im ated by simulatio n). In our study , we use an ev en we aker b en chmark than th ose in the climate science literature: our p seudo-pro xies are random n u m b ers generated c ompletely indep endently of the temp erature series. The simplest class of p seudo-pro xies we consider are Gaussian White Noise. Th at is, we app ly the Lasso p ro cedure outlined ab o v e to a 149 × 1138 matrix of standard norm al random v ariables. F ormally , let ε t i . i . d . ∼ N (0 , 1) , t = 16 B. B. MCSHAN E AND A. J. WYNER 1 , 2 , . . . . Then, our White Noise pseud o-pro xies are defin ed as X t ≡ ε t and w e generate 1138 su c h series, eac h of length 149. W e also consider three classes of AR1 or “red n oise” pseu do-pro xies since they are common in the climate literature [Mann , Bradley and Hughes ( 1998 ), v on Storch et al. ( 2004 ), Mann et al. ( 200 8 )]. Again, if ε t i . i . d . ∼ N (0 , 1), then an AR1 pseudo-proxy is defi n ed as X t ≡ φX t − 1 + ε t . Two of the cla sses are AR1 with the φ co efficien t set in tu rn to 0.25 and 0.4 [these are the a v- erage sample pr o xy auto correlations rep orted in Mann, Bradley and Hu gh es ( 1998 ) and Mann et al. ( 2008 ), resp.]. The third class is more complicated. First, we fit an AR1 m o del to eac h of the 1138 p ro xies and calculat e the sam- ple AR1 coefficients ˆ φ 1 , . . . , ˆ φ 1138 . Then, we generate an AR1 series setting φ = ˆ φ i for eac h of these 113 8 estimated co efficien ts. W e term this the empiri- cal AR1 pr o cess. This approac h is similar to that of McIn tyre and McKitric k ( 2005 a , 2005 c ) who use the full empirical autocorrelation f unction to gener- ate trend-less pseu d o-pro xies. W e also consider Bro wn ian motion pseudo-proxies formed by taking the cum u lativ e sums of N (0 , 1) random v ariables. That is, if ε t i . i . d . ∼ N (0 , 1), then a Br ownian m otion ps eudo-pro xy is d efined as X t ≡ P t j = 1 ε j = X t − 1 + ε t . White Noise and Brownian motion can b e thought of as sp ecial cases of AR1 pseud o-pro xies. In fact, they are the extr ema of AR1 pro cesses: White Noise is AR1 with the φ co efficien t set to zero and Bro wnian motion is AR1 with th e φ coefficien t set to one. Before d iscussing the results of these sim ulations, it is wo r th emphasizing wh y this exercise is necessary . That is, wh y can’t one ev aluate the mo del using standard regression diagnostics (e.g., F -statistics, t -statistics, etc.)? One cannot b ecause of t wo pr oblems mentioned ab ov e: (i) the p ≫ n prob lem and (ii) the fact that proxy and temp erature auto correlation causes spurious correlation and therefore in v alid m o del statistics (e.g., t -statistics). Th e first problem has to b e dealt with via dimensionalit y reduction; the s econd can only b e solve d when the underlying pro cesses are kn o wn (and th en only in sp ecial cases). Giv en that w e d o not kn o w the true u n derlying dyn amics, the nonp ara- metric, p rediction-based appr oac h used here is v aluable. W e pro vide a v ari- et y of b en c hmark p s eudo-pro xy series and obtain holdout RMS E distribu- tions. Sin ce these pseud o-pro xies are generate d indep endently of the temp er- ature series, we kno w they cannot b e truly p redictiv e of it. Hence, the real pro x ies—if they con tain linear signal on temp eratures—should outp erform our p seudo-pro xies, at least with h igh pr obabilit y . F or an y giv en class of pseud o-pro xy , w e can estimate the probabilit y that a randomly generated pseu do-pro xy sequ en ce outp erforms the true pro xy record for pr edicting temp eratures in a giv en holdout blo ck. A ma j or focu s of our in vestiga tion is the sensitivit y of this outp erformance “ p -v alue” to A ST A TISTICAL ANA L YS IS OF MUL TIPLE TEMPERA TUR E PRO X IES 17 Fig. 9. Cr oss-validate d RMSE on 30 -ye ar holdout blo cks f or various mo dels fit to pr oxi es and pseudo-pr oxies. The pr o c e dur es use d to gener ate the Pr oxy, Inter c ept, and ARM A b oxplots ar e discusse d in Se ction 3.2 . The pr o c e dur es use d to gener ate the White Noise, AR1, and Br ownian motion b oxplots ar e discusse d in Se ction 3.3 . The pr o c e dur e use d to gener ate the Grid Pr oxy b oxplot is discusse d in Se ction 3.6 . v arious factors. W e pro ceed in t wo d irections. W e first consid er the lev el and v ariabilit y in h oldout RMSE for our v arious classes of ps eu do-pro xies marginally o ver all 120 holdout blo c ks . S econd, sin ce these 120 h oldout blo c ks are highly correlated with one another, w e study ho w th e h oldout RMSE v aries from blo c k to blo ck in Section 3.4 . W e p resen t our results in Figure 9 , with the RMSE b o xp lot for the proxies giv en first. As can b e s een, the pr o xies ha v e a sligh tly w orse median R MS E than the intercept-o n ly mo d el (i.e., the in -sample mean) bu t the distribu- tion is narr o wer. On the other hand, the ARMA mo del is sup erior to b oth. When the Lasso is used on White Noise pseudo-proxies, the p erformance is similar to the interce pt-only mo del b ecause the Lasso is choosing a very parsimonious mo del. The proxie s seem to outp erform the AR1(0.25 ) and AR1(0.4) mo dels, with b oth a b etter median and a lo wer v ariance. While this is encourag- ing, it is also raises a concern: AR1(0.25) and AR1(0.4) are the mo dels frequent ly used as “n ull b enc hmarks” in the climate science literature and they seem to p erform worse than b oth the in tercept-only and White Noise b enc hmarks. Th is suggests that climate scien tists are using a p articularly w eak null b enc hmark to test their m o dels. T hat the null mo dels ma y b e to o 18 B. B. MCSHAN E AND A. J. WYNER w eak and the asso ciated standard errors in pap ers suc h as Mann, Bradley and Hughes ( 1998 ) are not wide enou gh has already b een p oin ted out in the climate literature [vo n Storc h et al. ( 2004 )]. While there w as some con tro- v ersy su rround in g the result of this pap er [W ahl, Ritson and Amman ( 2006 )], its conclusions hav e b een corrob orated [v on S torc h and Zorita ( 2005 ), von Storc h et al. ( 2006 ), Lee, Z wiers and Ts ao ( 2008 ), Chr istiansen, Sc hmith and Thejll ( 2009 )]. Finally , the empirical AR1 pro cess and Bro wnian motion b oth sub stan- tially outp erform the pro xies. Th ey eac h ha ve a lo wer a verag e holdout RMSE and lo wer v ariabilit y than that ac h iev ed b y the pr oxies. This is extremely imp ortant since these t wo classes of time series are generated c ompletely indep e ndently of the temp erature data. They hav e no long term pr edictiv e abilit y , and they cannot b e used to r econstru ct historical temp eratures. Y et, they significan tly outp erform the pr o xies at 30-y ear holdout prediction! In other w ords, our mo del p erforms b etter when using highly auto corre- lated noise rather than proxi es to “pred ict” temp erature. The real p ro xies are less predictiv e th an our “fake ” data. While the Lasso-generate d recon- structions u sing the pro xies are highly statistically significan t compared to simple null mo d els, th ey do not ac h iev e statistical significance against so- phisticated n ull mo dels. W e are not th e first to observe th is effect. It was sho w n, in McIn t yre and McKitric k ( 2005a , 2005c ), that r andom sequences with complex lo cal dep enden ce stru ctures can predict temp er atur es. Their approac h has b een roundly d ismissed in the climate science literature: T o generate “random” n oise series, MM05c apply the full autoregressiv e struc- ture of the real w orld proxy series. In this w ay , they in fact train their sto c hastic engine with significant (if not d ominan t) low frequ en cy climate signal rather than purely nonclimatic noise and its p ersistence. [Emphasis in original] Ammann and W ahl ( 2007 ) Broadly , there are t wo comp onents to any climate signal. The first comp o- nen t is the lo cal time dep end ence made man if est b y the strong auto correla- tion structur e observ ed in the temp erature series itself. It is easily observ ed that short term fu ture temp eratures can b e pred icted by estimates of the lo cal mean and its first deriv ativ es [Green, Armstrong and So on ( 2009 )]. Hence, a pro cedu re that fits sequences w ith complex lo cal dep endencies to the instrumental temp erature record will reco ver the abilit y of the temp er- ature record to self-predict in the short run. The second comp onen t—long-term changes in the temp erature series— can, on the other hand , only b e p redicted by m eaningful co v ariates. The auto correlation stru cture of the temp erature series d o es not allo w for self- prediction in the long ru n. Thus, p seudo-pro xies lik e ours, wh ic h inh erit th eir abilit y at sh ort-term pr ediction by b orrowing the d ep endence stru cture of A ST A TISTICAL ANA L YS IS OF MUL TIPLE TEMPERA TUR E PRO X IES 19 the instru men tal temp erature ser ies, ha ve n o more p ow er to r econstru ct temp erature than the in s trument al record itself (whic h is entirely sensible since these pseudo-pro xies are generated indep enden tly of the temp er atur e series). Ammann and W ahl ( 2007 ) claim that significance thresholds set b y Mon te Carlo sim ulations that use pseu d o-pro xies con taining “short term climate signal” (i.e., complex time dep endence stru ctur es) are in v alid: Such thresholds thus enh ance th e d anger of committing T y p e I I errors (inap- propriate fail ure to reject a n ull h y p othesis of no climatic information for a reconstruction). W e agree that these thresholds decrease p ow er. Still, these thresh olds are the correct w a y to p reserv e the significance lev el. T h e pro xy record has to b e ev aluated in terms of its inn ate abilit y to reconstruct historical temp er- atures (i.e., as opp osed to its abilit y to “mimic” the lo cal time dep end ence structure of the temp erature series). Ammann and W ahl ( 2007 ) wr on gly at- tribute r econstructiv e skill to the pro xy record wh ic h is in fact attributable to the temp erature record itself. Thus, climate scient ists are ov eroptimistic: the 149-y ear instru men tal record has significan t lo cal time dep endence and therefore far fewer indep enden t degrees of freedom. 3.4. Interp olation versus extr ap olation. In our an alysis, w e expanded our set of holdout b lo c ks to include all con tiguous 30-ye ar b lo c ks. Th e b enefits of this are t wofol d. First, th is expansion increases our sample size from tw o (the front and bac k blo c ks) to 120 (b ecause th ere are 118 p ossible in terior blo c ks). Second, b y expanding the set of holdout blocks, w e mitigate the p o- ten tial effects of data sno op in g since salien t characte r istics of the fi rst and last b lo c ks are widely kno w n. On the other hand, this expansion imp oses difficulties. Th e RMSEs of ov erlapping blo c ks are highly dep endent. F ur- thermore, since temp eratures are auto correlated, the RMSEs of neigh b oring nono verlapping blo cks are also dep endent. T h u s, there is little n ew informa- tion in eac h blo ck. 10 W e explore this graph ically by plotting the RMSE of eac h holdout blo c k against the fi r st yea r of th e blo ck in Figure 10 . W e b egin our discussion by comparing RMSE of the Lasso mo del fitted to the pro xies to RMSE of the in-samp le mean and the RMSE of the ARMA mo del in upp er left panel of Figure 10 . As can b e seen, the ARMA mo del either dominates or is comp etitiv e on ev ery holdout blo c k. The pro xies, on the other h and, can matc h the p erformance of th e ARMA mo del only on 10 As noted in a previous fo otnote, w e considered a v ariation of our pro cedure where we main tained 30-year holdout b locks but only calculated the R MSE on the mid dle 20 yea rs of th e blo ck, thus redu cing the d ep endence b etw een ov erlapping and nearby b lo cks. All qualitative conclusions remained the same. 20 B. B. MCSHAN E AND A. J. WYNER Fig. 10. Holdout RMSE by first ye ar of holdout blo ck. In al l p anels, the L asso-sele cte d line ar c ombination of the pr oxies is given in r e d. In the upp er-left p anel, the in-sample me an is given i n blue and the ARMA mo del in gr e en. In the upp er-r ight p anel, the aver age for the White Noise pseudo-pr oxy is given in black. In the mi dd le-left p anel, the aver age for the AR1(0 . 25) pseudo-pr oxy is given in black. In the midd le-right p anel, the aver age for the A R1(0 . 4) pseudo-pr oxy i s given in black. In the lower-left p anel, the aver age for the Empiric al A R 1 pseudo-pr oxy is given in black. I n the lower-right p anel, the aver age for the Br ownian motion pseudo-pr oxy i s given in bl ack. Confidenc e intervals for the pseu- do-pr oxies ar e given in gr ay and ar e forme d by taking 100 samples of the pseudo-pr oxy matrix for e ach holdout bl o ck. the first 20 or so h oldout blo cks, but on other blo c ks, they p erform qu ite a bit w orse. More interesti ng is the examination of the p erformance of the pseudo- pro x ies, as sho w n in the remaining five panels of Figure 10 . In these graphs, w e compare the RMS E of the pro xies on eac h holdout blo c k to the RMS E A ST A TISTICAL ANA L YS IS OF MUL TIPLE TEMPERA TUR E PRO X IES 21 of the pseud o-pro xies. W e also pro vide confidence interv als for the ps eu do- pro x ies at eac h blo c k by simula ting 100 draws of the pseu do-pro xy matrix and rep eating our fi tting pr o cedure to eac h draw. As can b e seen in th e upp er-righ t panel, the proxi es sho w statistically significan t impro v ement o ver White Noise for many of th e early h oldout blo c ks as w ell as many of the later on es. Ho w ever, there are blo cks, particularly in the m iddle, where they p erform significan tly wo rse. When the AR1(0.25) and AR1(0.4) ps eudo-pro xies preferred by climate scien tists are used, the a verage RMSE on eac h is comparable to that giv en b y Wh ite Noise b ut the v ariation is consid erably higher as sho wn b y the middle t wo panels of Figure 10 . Hence, the pro x ies p erf orm statistically significan tly b etter on v ery few holdout b lo cks, particularly those near the b eginning of the series and those near the end. This is a curious fact b ecause the “front” holdout blo ck and the “bac k” holdout b lo c k are the only tw o whic h climate scien tists use to v alidate their mo dels. Insofar as this fr on t and bac k p erf orm ance is anomalous, th ey ma y b e ov erconfiden t in th eir results. Finally , we consider the AR1 Empirical and Bro wn ian motion pseu do- pro x ies in the lo we r t wo panels of Figure 10 . F or almost all h oldout blo cks, these pseudo-pro xies hav e an av erage RMSE th at is as lo w or lo w er than that of the p ro xies. F urther, for no blo ck is the p er f ormance of true pro xies statistica lly significan tly b etter than that of either of these pseud o-pr o xies. Hence, w e cannot reject the null hyp othesis that the true pro xies “predict” equiv alen tly to h ighly correlated and/or nonstationary sequences of random noise that are indep end en t of temp eratur e. A little reflection is in order. By cross-v alidating on in terior blo c ks, we are ab le to greatly expand th e v alidation test set. Ho wev er, reconstructing in terior blo cks is an in terp olation of th e training sequence and p aleoclima- tologic al reconstruction requires extrap olati on as opp osed to in terp olation. Pseudo-pro xy reconstru ctions can only extrap olate a climate trend accu- rately for a very short p erio d and then only insofar as the lo cal dep endence structure in the pseud o-pro xies matc hes the lo cal d ep endence str u cture in the temp erature series. That is, forecasts f r om randomly generated series can extrap olate successfully only by c hance and for ve ry s h ort p eriod s. On the other h and, Bro wn ian m otions and other pseud o-pro xies w ith strong lo cal dep enden cies are quite su ited to interp olation since their in- sample f orecasts are fitted to app r o ximately m atc h the the training s equence datap oin ts that are adjacen t to the in itial and fi nal p oin ts of a test blo c k. Nev ertheless, true pro xies also ha ve str on g local d ep endence structure since they are temp erature sur r ogates an d therefore sh ould similarly matc h th ese datap oin ts of the training sequence. F urthermore, unlike pseudo-proxie s, true pro xies are not indep endent of temp erature (in fact, the scient ific pre- sumption is that they are pr e dictive of it). Therefore, proxy int erp olations on in terior holdout blo c ks sh ould b e exp ected to outp erform pseud o-pro xy forecasts not withstandin g th e ab o ve. 22 B. B. MCSHAN E AND A. J. WYNER T able 1 Per c ent of pseudo-pr oxies sele cte d by the L asso Pseudo-proxy Percen t selected White Noise 37.8% AR1(0.25) 43.5% AR1(0.4) 47.9% Empirical A R1 53.0% Bro wnian Motion 27.9% 3.5. V ariable sele ction: T rue pr oxies versus pseudo-pr oxies. While the use of noise v ariables su c h as the p seudo-pro x ies is not u nkno wn in s tatistics, suc h v ariables ha v e t yp ically b een u sed to augment a matrix of co v ariates rather than to replace it. F or example, W u, Bo os and Stefanski ( 2007 ) aug- men t a matrix of co v ariates with noise v ariables in order to tune v ariable selection metho d ologie s. Though that is not our fo cu s, we make use of a similar approac h in order to assess the the degree of signal in the pro xies. W e first augmen t the in-sample matrix of p ro xies with a m atrix of pseu d o- pro x ies of the same size (i.e., replacing the 119 × 1138 pr o xy matrix with a matrix of size 119 × 2276 wh ic h consists of the original p ro xies plus pseud o- pro x ies). Then, we rep eat th e Lasso cross-v alidation describ ed in Section 3.2 , calculate the p ercen t of v ariables s electe d by the Lasso whic h are p seudo- pro x ies, and a v erage o v er all 120 p ossible blocks. If the signal in the pro xies dominates that in the pseudo-proxie s, then this p ercent should b e relativ ely close to zero. T able 1 sho ws this is far from the case . In general, the pseud o-pro xies are selected ab out as often as th e true proxies. That is, the L asso do es n ot find that the true proxi es h a v e su bstan tially more signal than the pseudo-pr o xies. 3.6. P r oxies and lo c al temp er atur es. W e p erformed an additional test whic h accounts for the fact that p ro xies are lo cal in n ature (e.g ., tree rings in Mon tana) and therefore m igh t b e b etter predictors of lo cal temp eratures than global temp eratures. Climate scien tists generally accept the notion of “teleco n nection” (i.e., that p r o xies lo cal to one place can b e predictiv e of climate in another p ossibly distan t place). Hence, w e do not us e a distance restriction in this test. Rather, we p erf orm the follo wing pro cedu re. Again, let y t b e the CRU Northern Hemisphere ann ual mean land tem- p erature wh ere t indexes eac h ye ar from 1850–1998 AD, and let X = { x tj } b e the cente r ed and scaled matrix of 1138 pro xies from 1850–19 98 AD w h ere t indexes the y ear and j indexes eac h pro xy . F urther, let Z = { z tj } to b e the matrix of the 173 2 cen tered and scaled local annual temp eratures from A ST A TISTICAL ANA L YS IS OF MUL TIPLE TEMPERA TUR E PRO X IES 23 1850– 1998 AD where again t indexes the y ear and j indexes eac h local tem- p erature. As b efore, w e tak e a 30- y ear con tiguous blo c k and reserv e it as a h oldout sample. Our pro cedure has t wo steps: 1. Using the 119 in-sample y ears, we p erform ten rep etitions of five-fo ld cross-v alidatio n as describ ed in Section 3.2 . In this case, h o wev er, instead of usin g the pro xies X to p r edict y , w e use the lo cal temp eratures Z . As b efore, this pro cedure giv es us an optimal v alue for the tuning parameter ˆ λ whic h we can use on all 119 observ ations of y and Z to obtain ˆ β Lasso . 2. No w, f or eac h j suc h that ˆ β Lasso j 6 = 0 , w e create a Lasso mo del for z · j . That is, we p erform ten rep etitions of fiv e-fold cross-v alidatio n as in Section 3.2 but using X to predict z · j . Again, this pr o cedure giv es us an optimal v alue for the tu ning p arameter ˆ λ j whic h we can use on all 119 observ atio ns of z · j and X to obtain ˆ β Lasso , ( j ) . Similarly , we can p r edict on th e holdout blo c k usin g a tw o-stage pro ce- dure. F or eac h j suc h that ˆ β Lasso j 6 = 0, we apply ˆ β Lasso , ( j ) to X to obtain ˆ z · j in the 30 holdout ye ars. Then, we apply ˆ β Lasso to the collect ion of ˆ z · j in order to obtain ˆ y t in the 30 holdout ye ars. Finally , w e calculate the RMSE on the h oldout blo c k and rep eat this pr o cedure ov er all 120 p ossible holdout blo c ks. As in Section 3.2 , this pro cedur e uses the Lasso to mitigate the p ≫ n problem. F urthermore, since the Lasso is u nlik ely to select correlated pre- dictors, it also atten uates the pr ob lem of spatial correlation among the lo cal temp eratures and proxies. But, this pro cedur e has the adv antag e of relating pro x ies to lo cal temp eratures, a feature whic h could b e adv an tageous if these relationships are more conspicuous and endur ing than those b et w een pro xies and the CRU global av erage temp erature. The same is also p oten tially true mutatis mutandis of th e r elationship b etw een the lo cal temp eratures and CR U. The results of this test are giv en by the second b oxplot in Figure 9 . As can b e seen, this metho d seems to p erform somewhat b etter than the pure global metho d. How ev er, it do es not b eat the empirical AR1 pr o cess or Bro wnian motion. Th at is, random series that are indep enden t of global temp erature are as effectiv e or more effectiv e than the p ro xies at p redicting global annual temp eratures in the instrumental p eriod . Again, the pro x ies are not statistica lly significan t when compared to soph isticated null mo dels. 3.7. D i scussion of mo del evaluation. W e can think of fou r p ossible ex- planatory factors for w hat we ha ve obs erv ed. Firs t, it is p ossible that the pro x ies are in f act to o w eakly connected to global ann u al temp erature to offer a s u bstan tially predictiv e (as w ell as reconstructiv e) mo del o ver the 24 B. B. MCSHAN E AND A. J. WYNER ma jorit y of the instrum en tal p erio d. T his is not to suggest that pro x ies are unable to detect large v ariations in global temp erature (suc h as those that distinguish our curren t climate fr om an ice age). Rather, we suggest it is p ossible that natural pr o xies cannot r eliably detect the small and largely unpr ed ictable c hanges in ann ual temp erature that ha ve b een observed ov er the ma jorit y of th e instrumenta l p erio d . In con trast, we h a ve p reviously sho w n that the pro xy r ecord has some abilit y to pr edict the final 30-y ear blo c k, wh ere temp eratures hav e increased most significan tly , b etter than c hance would suggest. A second exp lanation is that the Lasso migh t b e a p o or pr o cedure to apply to these data. Th is seems imp lausible b oth b ecause the Lasso has b een used su ccessfully in a v ariet y of p ≫ n con texts and b ecause w e re- p eated the analyses in this section using mo deling strategies other than the Lasso and obtained the same general results. On the other hand , climate scien tists ha ve basically u sed three differen t s tatistic al app roac hes: (i) scal- ing and a v eraging (so-called “Composite Plus Scale” or CPS) [NR C ( 2006 )], (ii) principal comp onen t regression [NR C ( 2006 )], an d (iii) “Errors in V ari- ables” (EIV) r egression [Sc hn eider ( 2001 ), Mann et al. ( 2007 )]. Th e EIV approac h is considered the most reliable and p o w erf ul. The approac h treats forecasting (or reconstruction) from a missing data p ersp ectiv e us ing the Exp ectation–Maximiza tion algorithm to “fi ll-in” blo c k s of missing v alues. The E M core utilizes an EIV generalized linear regression whic h addresses the p ≫ n problem u sing r egularization in th e form of a ridge r egression-lik e total sum of squares constrain t (this is called “RegEM” in the climate liter- ature [Mann et al. ( 2007 )]). All of these app roac hes are intrinsically linear, lik e Lasso regression, although the iterativ e RegEM can pro du ce n onlinear functions of the co v ariates. F undamentall y , there are only theoretical p erfor- mance guaran tees for i.i.d. observ atio ns, while our d ata is clearly correlate d across time. The EM algorithm in particular lac ks a su bstan tive literature on accuracy and p erformance w ith ou t sp ecific assumptions on the n ature of missing d ata. Thus, it not obvio us wh y the Lasso regression sh ould b e sub- stan tive ly wo r se than these metho ds. Nev ertheless, in sub sequen t sections w e will study a v ariet y of differen t and impr ov ed mod el v ariations to confirm this. A third explanation is th at our class of comp etitiv e predictors (i.e., the pseudo-proxie s) may v ery w ell pro vide unju stifiably difficult b enchmarks as claimed b y Amm an n and W ahl ( 2007 ) and discussed in Section 3.3 . Climate scien tists ha ve calibrated their p erf orm ance u sing either (i) wea k AR1 pro- cesses of the kind demonstrated ab o v e as p seudo-pro xies or (ii) by add ing w eak AR1 p r o cesses to lo cal temp eratures, other p r o xies, or the outpu t from global climate sim ulation mo dels. In fact, w e ha ve shown that the the pro x y record outp erform s the former. On the other hand, we ak AR1 pro- cesses underp erform eve n white noise! F urth ermore, it is hard to argue that a A ST A TISTICAL ANA L YS IS OF MUL TIPLE TEMPERA TUR E PRO X IES 25 pro cedure is truly skillful if it cannot consistentl y outp erform noise, no mat- ter ho w artfu lly stru ctured. In fact, Figure 6 revea ls that the p ro xy series con tain very complicated and highly auto correlated time series structur es whic h indicates that our complex pseud o-pro xy comp etitors are not en tirely unreasonable. Finally , p erhaps the proxy signal can b e enhanced by smo othing v arious time series b efore mo deling. S m o othing seems to b e a standard app roac h for the analysis of climate series and is accompanied b y a large b od y of literature [ Mann ( 200 4 , 2008 )]. Still, from a statistica l p ers p ectiv e, smo othing time series raises additional q u estions and p roblems. At the m ost basic lev el, on e has to figure out wh ich series should b e smo othed: temp eratures, pro xies, or b oth. Or , p erh aps, only the forecasts should b e smo othed in ord er to r educe the forecast v ariance. A fur ther problem with smoothin g pro cedures is that there are many metho ds and asso ciated tunin g parameters and there are no clear data-indep endent and hyp othesis-indep endent metho d s of select ing among the v arious options. The instrum en tal temp erature r ecord is also v ery w ell kno wn so there is no wa y to do this in a “blind ” fashion. F urthermore, smo othing d ata exacerbates all of the statistica l significance issues already present due to auto correlation: tw o smo othed series will exhib it artificially high correlations and b oth standard errors and p -v alues require corrections (whic h are again only kno w n u nder certain restrictiv e conditions). 4. T esting other predictiv e metho ds. 4.1. Cr oss-validate d RMSE. In this section, we pur sue alternativ e pr o- cedures, including r egression approac hes more directly similar to tec hniques used b y climate scien tists. W e shall see, working with a similar d ataset, that v arious fi tting metho ds can h a ve b oth (i) v ery similar contig uous 30- y ear cross-v alidated instrumenta l p erio d RMSE distributions and (ii) very differen t h istorical bac k casts. Again, w e u se as our resp onse the CRU Northern Hemisphere annual mean land temp eratur e from 1850–19 98 AD and augment it with the 1732 lo cal temp erature series wh en required. Ho wev er, since we are ultimately in terested in large -scale reconstructions, we limit ourselv es in th is section to only those 93 p ro xies for whic h we ha v e data going bac k o v er 1000 y ears. 11 Hence, our in-sample dataset consists of the CR U global aggregate , the 1732 lo cal temp eratures, and th e 93 pr o xies f rom 1850–1 998 AD and w e apply 11 There are technically 95 p ro x ies dating bac k this far but three of them (t iljan- der 2003 darksum, tiljander 2003 lightsum, and tiljander 2003 thicknessmm) are h ighly correlated with one another. Hence, we omit th e latter tw o. Again, qualitativ ely , results hold up whether one uses the red uced set of 93 or the full set of 95 p ro x ies. How ever, u sing the full set can cause numerical instability issues. 26 B. B. MCSHAN E AND A. J. WYNER Fig. 1 1. Cr oss-validate d RMSE on 30 -ye ar holdout blo cks for various mo del sp e cific a- tions: i nter c ept only and r e gr ession on the first one, five, ten, and 20 princip al c omp onents of the pr oxies. the cross-v alidation pr o cedure discu s sed in S ection 3.2 to it. W e can then examine back casts on the 998– 1849 AD p eriod for whic h only the p ro xies are a v ailable. W e exp ect that our pr ediction accuracy du ring the instru men tal p erio d will deca y s omewh at since our set of pro xies is so muc h smaller. Ho w- ev er, th e p roblem of millennial reconstructions is m u c h more interesti ng b oth statistica lly and scientifica lly . It is w ell kn o wn and generally agreed that the sev eral h undred y ears b efore the in d ustrial rev olution were a comparativ ely co ol “Little Ice Age” [Matthes ( 1939 ), Lamb ( 1990 )]. What happ ened in the early Mediev al p eriod is muc h more contro v ersial and uncertain [Ladur ie ( 1971 ), IPCC ( 2001 )]. W e no w examine h o w well the pro xies pr edict u nder alternativ e mo del sp ecifications. In the first set of studies, w e examine RMSE distr ib utions using an in tercept-only mo del and ordinary least squares regression on the first one, five, ten, and 20 principal comp onents calculat ed from the full 1001 × 93 pr o xy matrix. Ou r results are shown in Figure 11 . As can b e seen, all of these metho ds p erform comparably , w ith five and ten pr incipal comp onen t mod els p erhaps p erf orm ing sligh tly b etter than the others. In a second s et of v alidations, we consider v arious v ariable selection metho d- ologie s and apply them to b oth the raw pro x ies and the pr incipal comp onents of the pro xies. The m etho ds consid ered are the Lasso and step wise regres- sion d esigned to optimize AIC and BIC , resp ectiv ely . W e plot our results A ST A TISTICAL ANA L YS IS OF MUL TIPLE TEMPERA TUR E PRO X IES 27 Fig. 1 2. Cr oss-validate d RMSE on 30 -ye ar holdout blo cks for various mo del sp e cific a- tions: r e gr ession on the first ten princip al c omp onents of the pr oxies, the L asso appli e d to the pr oxies and the princip al c omp onents of the pr oxies, stepwise r e gr ession to m axi- mize AIC applie d to the pr oxies and the princip al c omp onents of the pr oxies, and step wise r e gr ession to maximi ze BIC applie d to the pr oxies and the princip al c omp onents of the pr oxies. in Figure 12 and include the b o x p lot of the ten principal comp onen t mo del from Figur e 11 for easy reference. As can b e seen, the stepwise mo dels p er- form fairly similarly with one another. The Lasso p erforms slightl y b etter and predicts ab out as w ell as the ten principal comp on ent mo d el. As a final consideration, w e emplo y a metho d similar to that used in the original Mann, Bradley and Hughes ( 1998 ) pap er. This metho d tak es ac- coun t of the fact that lo cal pr o xies migh t b e b etter p r edictors of lo cal tem- p eratures than they are of global aggregate temp eratures. F or this metho d, w e again us e the first p prin cipal comp onents of th e pr oxy matrix but w e also use the first g prin cipal comp onents of the 14 9 × 1732 lo cal temp erature matrix. W e regress the CR U global aggregate on the g pr incipal comp onen ts of lo cal temp erature matrix, and then we regress eac h of the g lo cal tem- p erature principal comp onen ts on the p pro xy p rincipal comp onents. W e can then use the historical proxy prin cipal comp onents to bac kc ast the lo- cal temp erature pr incipal comp onen ts th er eby enablin g us to bac kcast the global a v erage temp erature. 28 B. B. MCSHAN E AND A. J. WYNER Fig. 1 3. Cr oss-validate d RMSE on 30 -ye ar holdout blo cks for various mo del sp e cific a- tions: r e gr ession on the first ten princip al c omp onents of the pr oxies and various two-stage mo dels wher e glob al temp er atur e is r e gr esse d on princip al c omp onents of lo c al temp er atur es which ar e the n r e gr esse d on princip al c omp onents of pr oxies. W e p lot our resu lts in Figure 13 and again include the b o xplot of ten principal comp onents from Figure 11 for easy reference. As b efore, there is simply not that m uch v ariation in h oldout RMSE across the v arious mo del sp ecifications. No m etho d is a clea r winner. 4.2. T emp er atur e r e c onstructions. Each mo d el discussed in S ection 4.1 can form a historical bac k cast. This bac k cast is simply the mo d el’s estimate ˆ y k ( x t ) of th e Northern Hemisphere av erage temp erature in a yea r t calcu- lated by inp uting the proxy co v ariates x t in the same yea r. T he mo del index is k whic h v aries o ve r all 27 mo dels from Section 4.1 (i.e., those featured in Figures 11 – 13 ). W e p lot these bac kca s ts in Figure 14 in gra y and show the CR U a v erage in blac k. As can b e seen, while these mo dels all p erform similarly in terms of cross-v alidated RMSE, they h a ve w ildly different im- plications ab out climate history . According to some of them (e.g., th e ten p ro xy principal comp onen t mo del giv en in green or the t wo-stag e m o del featuring fiv e lo cal temp erature pr in- cipal comp onents and five pro xy principal comp onents giv en in blue), the recen t run-up in temp eratur es is not that abnormal, and similarly high tem- p eratures w ould hav e b een seen o ver the last millenniu m. Interestingly , the A ST A TISTICAL ANA L YS IS OF MUL TIPLE TEMPERA TUR E PRO X IES 29 Fig. 14. Backc asts to 1000 AD fr om the various mo dels c onsider e d in this se ction ar e plotte d i n gr ay. CRU Northern Hemi spher e annual me an land temp er atur e is given by the thin black li ne with a smo othe d version given by the thick black line. Thr e e for e c asts ar e fe atur e d: r e gr ession on one pr oxy princip al c omp onent (r e d), r e gr ession on ten pr oxy princip al c omp onents (gr e en), and the two-sta ge mo del fe aturing five lo c al temp er atur e princip al c omp onents and five pr oxy princip al c omp onents (blue). blue bac kca st seems to feature b oth a Mediev al W arm P erio d and a Little Ice Age whereas the green one sho ws only increasing temp eratures going bac k in time. Ho we v er, other bac kc asts (e.g., the single pr oxy principal comp onen t re- gression featured in red ) are in fact h o c key stic ks wh ic h corresp ond qu ite w ell to bac kc asts such as those in Mann , Bradley and Hughes ( 1999 ). If they are correct, mo dern temp eratures are indeed comparativ ely quite alarming since suc h temper atur es are muc h wa r mer than what th e back casts indicate w as observed o v er the past millenniu m. Figure 14 rev eals an imp ortan t concern: mo d els that p erform similarly at predicting the instrumental temp erature series (as revea led b y Figures 11 – 13 ) tell v er y differen t stories ab out the past. T h u s, insofar as one judges mo dels by cross-v alidated predictiv e abilit y , one seems to hav e no reason to prefer the red bac kcast in Figure 14 to the green eve n th ough the f ormer suggests that recen t temp eratures are muc h warmer than those observed o ve r the past 1000 y ears while the latter suggests they are not. A final p oint to n ote is th at th e bac k casts plotted in Figure 14 are th e ra w b ack casts themselv es with no accoun ting for bac kc ast standard errors. In the next section, w e tak e on the problem of sp ecifying a fu ll probabilit y mo del whic h will allo w us to provide accurate, path w ise standard errors. 30 B. B. MCSHAN E AND A. J. WYNER 5. Ba yesian reconstruction and v alidation. 5.1. M o del sp e cific ation. In the previous section, we s h o wed that a v a- riet y of d ifferen t mo dels p erform fairly similarly in terms of cross-v alidated RMSE wh ile pro ducing v ery different temp erature reconstructions. In this section, w e fo cus and expand on the mo del whic h uses the fi rst ten p rinci- pal comp onent s of the proxy record to predict Northern Hemisphere C R U. W e c hose this forecast for sev eral reasons. First, it p erformed relativ ely well compared to all of the others (see Figures 11 – 13 ). Second, PC regression has a relativ ely long history in the science of p aleoclimatologica l reconstructions [ Mann, Bradley and Hughes ( 1998 , 1999 ), NR C ( 2006 )]. Finally , wh en u sing OLS regression, p rincipal comp onen ts u p to and including the ten th w ere statistica lly significant. While the t -statistics and their asso ciated p -v alues themselv es are un interpretable due to the complex time series and error structures, these traditional b en c hmarks can serve as guidep osts. Ho we v er, there is at least one serious p roblem with this mo del as it stands: the residuals demonstrate significant auto correlation not captured b y the auto correlation in the pr o xies. Accordingly , we fit a v ariet y of autoregressiv e mo dels to C R U time series. With an AR2 mo del, the resid u als sho wed v ery little au to correlation. So that we accoun t for b oth parameter uncertain ty as we ll as r esidual un- certain t y , we estimate our mo d el using Ba y esian pro cedures. Our lik eliho o d is giv en b y y t = β 0 + 10 X i =1 β i x t,i + β 11 y t +1 + β 12 y t +2 + ε t , ε t ∼ N (0 , σ 2 ) . In our equation, y t represent s the CRU Northern Hemisphere annual land temp erature in y ear t and x t,i is the v alue of principal comp onent i in ye ar t . W e n ote that the sub s cripts on the righ t-hand side of the regression equation emplo y pluses rather than the u sual minuses b ecause we are in terested in bac kca s ts rather than forecasts. In addition to this, w e use the v er y weakly informativ e p r iors ~ β ∼ N ( ~ 0 , 1000 · I ) , σ ∼ Un if (0 , 100) , where ~ β is the 13 dimens ional v ector ( β 0 , β 1 , . . . , β 12 ) T , ~ 0 is a vecto r of 13 zeros, and I is the 13 dimensional ident it y matrix. Th is pr ior is sufficientl y noninformativ e that the p osterior mean of ~ β is, within roun ding error, equal to the maximum lik eliho o d estimate. F urthermore, the prior on σ is effec- tiv ely noninformativ e as y t is alw a ys b et ween ± 1 and therefore no p osterior dra w comes an yw here n ear the b ound ary of 100. A ST A TISTICAL ANA L YS IS OF MUL TIPLE TEMPERA TUR E PRO X IES 31 It is imp ortan t to consider ho w our mo del account s for the p erils of tem- p erature r econstruction discussed ab o v e. Firs t and foremost, w e deal with the pr oblem of we ak signal b y buildin g a simple mo d el ( AR 2 + PC10) in order to a v oid ov erfitting. Ou r fully Ba ye s ian mo d el, which accoun ts f or pa- rameter uncertain t y , also helps atten uate some of th e problems caused b y w eak signal. Dimensionalit y redu ction is dealt with via prin cipal comp o- nen ts. PCs hav e t wo additional b enefits. First, they are wel l-studied in the climate science literature and are u sed in climate scient ists’ reconstructions. Second, the orthogonalit y of principal comp onen ts will diminish the p erni- cious effects of s p atial correlatio n among the proxies. Finally , we addr ess th e temp oral correlation of the temp eratur e s eries with the AR2 comp onen t of our m o del. 5.2. Comp arison to other mo dels. An app roac h that is b roadly s im i- lar to the ab o v e has recen tly app eared in the climate literature [Li, Ny- c hk a and Amman ( 2007 )] for p urp oses similar to ours, namely , quantify- ing the uncertain t y of a reconstruction. In fact, Li, Nyc h k a an d Amm an ( 2007 ) is highly u n u sual in the climate literature in that its authors are primarily statisticians. Using a dataset of 14 proxies f rom Mann, Bradley and Hughes ( 1999 ), Li, Nyc hk a and Amman ( 2007 ) confirm s the findings of Mann, Bradley and Hughes ( 1998 , 1999 ) but attempts to tak e forecast error, parameter uncertain t y , and temp oral correlatio n int o accoun t. They pro v id e to y data and co de for their mo del h ere: http://www.image.ucar. edu/ ~ boli/researc h. h tml Nev ertheless, sev eral imp ortan t distinctions b et w een their mo d el and our s exist. First, Li, Nychk a and Amman ( 2007 ) make use of a dataset o ver ten y ears old [Mann, Bradley and Hugh es ( 1999 )] whic h con tains only 14 prox- ies dating bac k to 1000 AD and has instrumental r ecords dating 1850–1980 AD. On th e other h and, w e make use of th e latest multi-pro xy database [Mann et al. ( 2008 )] wh ich con tains 93 pro xies dating bac k to 1000 AD an d has instru men tal records dating 1850–1 998 AD. F urthermore, Li, Nyc hk a and Amman ( 2007 ) assum e an AR2 stru cture on the errors from the mod el where w e assume the mo del is AR2 with co v ariates. Finally , and p erhaps most imp ortant ly , Li, Nyc hk a and Amman ( 2007 ) estimate their mo del via generalized least squares and therefore use (i) the parametric b o otstrap in or- der to accoun t for parameter estimation uncertaint y and (ii) cross-v alidati on to accoun t o verfitting the in-sample p erio d (i.e., to inflate their estimate of the err or v ariance σ ). O n the other hand, b y estimating our mo del in a fully Ba y esian fashion, w e can account for these within our probability mo del. Th us, our pro cedure can b e thought of as formalizing the approac h of Li, Nyc hk a and Amman ( 2007 ) and it pro vides practically similar results when applied to the same set of co v ariates (generalized least squares also pro d u ced 32 B. B. MCSHAN E AND A. J. WYNER practically in distinguishable forecasts an d bac kca sts though ob viously nar- ro wer standard errors). A t th e time of this manuscript’s submission, the same authors w ere work- ing on a fully Ba y esian mo d el w hic h deserv es men tion [subsequently pub- lished as Li, Nychk a and Amman ( 2010 )]. In this pap er, they in tegrate d ata from thr ee t yp es of proxi es m easur ed at different timescales (tree r in gs, b oreholes, and p ollen) as w ell as data fr om climate forcings (solar irradi- ance, v olcanism, and greenhouse gases) which are considered to b e external driv ers of climate. F ur thermore, they accoun t for auto correlated error in b oth the pro xies and forcings as well as auto correlation in th e d eviations of temp erature fr om the mo d el. While the m etho dology and use of forcing data are certainly inno v ativ e, the fo cus of Li, Nyc hk a and Amman ( 2010 ) is not on r econstru ction p er se ; r ather, they are in terested in v alidating their mo deling approac h taking as “truth” the output of a h igh-r esolution state- of-the-art climate simulatio n [Amman et al. ( 2007 )]. Consequent ly , all data used in the pap er is synthetic and they concen trate on metho dological is- sues, “defer[ring] any reconstructions based on actual observ ations an d their geoph ysical int erpretation to a subsequent pap er” [Li, Nyc hk a and Amman ( 2010 )]. Finally , Tingley and Huyb ers ( 2010a , 201 0b ) ha v e d ev elop ed a hierarc h i- cal Ba y esian mo del to reconstruct the full temp erature fi eld. They fit the mo del to exp erimen tal datasets f ormed b y “corrupting a num b er of the [tem- p erature] time series to mimic proxy observ ations” [Tingley and Hu y b ers ( 2010a )]. Usin g these datasets, they conduct what is in essence a frequentist ev aluatio n of their Bay esian mo del [Tingley and Huyb ers ( 2010a )] and then compare its p erformance to that of the w ell-known RegEM algorithm [Tin - gley and Huyb ers ( 2010b )]. Like L i, Nyc hk a and Amman ( 2010 ), how ev er, they do not u se their m o del to pr o duce temp eratur e reconstructions f r om actual pro xy observ ations. 5.3. M o del r e c onstruction. W e create a fu ll temp erature bac kca st b y first initializing our mo d el with the CRU temp eratures for 1999 AD and 2000 AD. W e then p erform a “one-step-b ehin d” bac kc ast, plugging these v alues along with the ten prin cipal comp onen t v alues for 1998 AD into the equation y t = β 0 + P 10 i =1 β i x t,i + β 11 y t +1 + β 12 y t +2 to get a bac k casted v alue for 1998 AD (using the p osterior mean of ~ β as a plug-in estimator). Sim ilarly , w e use th e CRU temp erature for 1999 AD, th is back casted v alue f or 1998 AD, and the ten p rincipal comp on ent v alues for 1997 AD to get a back casted v alue for 1997 AD. Finally , w e th en iterate this pro cess one y ear at a time, using the t wo most r ecen t bac k casted v alues as well as the curr en t principal comp onen t v alues, to get a bac kc ast for eac h of the last 1000 years. W e plot th e in-sample p ortion of this bac kcast (185 0–199 8 AD) in Figure 15 . Not su rprisingly , the mo del tracks CR U r easonably well b ecause it is A ST A TISTICAL ANA L YS IS OF MUL TIPLE TEMPERA TUR E PRO X IES 33 Fig. 15. I n-sample Backc ast fr om Bayesian Mo del of Se ction 5 . CR U Northern Hemi- spher e annual me an land temp er atur e i s given by the thin black li ne and a smo othe d version is given by the thick black l ine. The b ackc ast is given by the thin r e d line and a smo othe d version is given by the thick r e d line. The mo del is fit on 1850–1998 AD. in-sample. Ho wev er, d esp ite th e fact that the bac k cast is b oth in-sample and initialized with the high true temp eratures from 1999 AD and 2000 AD, it s till cannot capture either the high level of or the s harp ru n-up in temp eratures of the 1990s: it is sub stan tially biased lo w. That the mo del cannot capture run-up even in-sample do es not p ortend w ell for its abilit y to captur e s im ilar lev els an d run-up s if they exist out-of-sample. A b enefit of our fully Ba y esian mo del is that it allo ws us to assess the error due to b oth (i) residu al v ariance (i.e., ε t ) and (ii) parameter uncertain t y . F urthermore, we can do this in a f ully path wise fashion. T o assess the er r or due to residual v ariance, we use the one-step-b ehind bac k casting pro cedure outlined ab o v e with t wo exceptions. First, at eac h step, we dr a w an error from a N (0 , σ 2 ) distribution and add it to our bac kcast. Th ese errors then propagate thr ough the f ull path of bac k cast. Second, w e p erf orm th e bac kcast allo wing σ to v ary o ver our samples from the p osterior distribution. T o assess the error due to the un certain t y in ~ β , w e p erform the original one-step-b ehind bac kca st [i.e., without dra w ing an error from th e N (0 , σ 2 ) distribution]. Ho wev er, r ather than using the p osterior mean of ~ β , w e p er- form th e bac k cast for eac h of our samples from the p osterior distribution of ~ β . Finally , to get a sense of the fu ll uncertain ty in our bac kcast, we can com bine b oth of the metho d s outlined ab o v e. T hat is, for eac h draw from the p osterior of ~ β and σ , w e p erform the one-step-b eh ind back cast dra wing 34 B. B. MCSHAN E AND A. J. WYNER Fig. 16. Backc ast fr om Bayesian Mo del of Se ction 5 . C R U Northern Hemispher e annual me an land temp er atur e is given by the thin black li ne and a smo othe d version is given by the thick black line. The f or e c ast is given by the thin r e d line and a smo othe d version is given by the thick r e d li ne. The mo del is fit on 1850–1998 AD and b ackc asts 998–1849 AD. The cyan r e gion indic ates unc ertainty due to ε t , the gr e en r e gion indic ates unc ertainty due to ~ β , and the gr ay r e gion indic ates total unc ertainty. errors from the N (0 , σ 2 ) distribu tion. This giv es one cur v e f or eac h p osterior dra w , eac h representing a dr a w of the f u ll temp erature series conditional on the d ata and th e mo d el. T ak en together, they form an appro ximation to the full p osterior d istribution of the temp erature s eries. W e decomp ose the uncertain ty of our m o del’s bac kcast by plotting the curv es drawn using eac h of the methods ou tlined in the p revious three p ara- graphs in Figure 16 . As can b e seen, in th e mo dern instrumental p erio d the residual v ariance (in cy an) dominates the u ncertain ty in the bac k cast. Ho w- ev er, the v ariance due to ~ β uncertain ty (in green) propagates through time and b ecomes th e dominant p ortion of the ov erall error for earlier p erio d s. The primary conclusion is that failure to acco unt for parameter uncertaint y results in ov erly confiden t mo del predictions. As far as w e can tell, no effort at paleo climatologi cal global temp erature reconstruction of the past 1000 y ears has used a fu lly Ba y esian probabilit y mo del to incorp orate parameter uncertain t y in to the bac k cast estimates [in fact, the aforemen tioned Li, Nyc hk a and Amman ( 2007 ) pap er is the only pap er we know of that ev en b egins to accoun t for un certain t y in some of the p arameters; see Haslett et al. ( 2006 ) for a Ba ye sian mo del used for reconstructing the lo cal pr ehistoric climate in Glendalough, Ireland]. The widely used appr oac h in th e climate literature is to estimate uncertaint y using residuals (usually from a holdout p erio d). Climate scient ist generally rep ort less accurate reconstructions in more distant time p erio d s, but this A ST A TISTICAL ANA L YS IS OF MUL TIPLE TEMPERA TUR E PRO X IES 35 Fig. 17. This figur e mo di fies Figur e 3 fr om M ann et al. ( 2008 ). We tak e that figur e and sup erimp ose the b ackc ast fr om Bayesian mo del of Se ction 5 . The b ackc ast is given by the thin yel low li ne, the smo othe d b ackc ast by a thick yel low line, and the b ackc ast err or in gr ay. is du e to the fact that there are few er pro xies that extend fu rther bac k in to time and therefore larger v alidation residu als. 5.4. Comp arison to other r e c onstructions and p osterior c alculations. What is most in teresting is comparing our bac kca st to those from Mann et al. ( 2008 ) as done in Figure 17 . W e see that our mod el gives a b ac k cast whic h is v ery similar to those in the literature, particularly from 1300 AD to the present . In fact, our bac kcast ve ry closely traces the Mann et al. ( 2008 ) EIV land bac k cast, considered b y climate scien tists to b e among the most skilled. Though our mo del pro vides sligh tly w armer back casts for the y ears 1000– 1300 AD, w e note it falls within or just outside the un certain t y bands of the Mann et al. ( 2008 ) EI V land bac kcast even in th at p erio d . Hence, our bac kca s t matc hes th eir bac kca sts reasonably w ell. The m a j or difference b et wee n our m o del and those of climate s cientists, ho wev er, can b e seen in the lar ge width of our un certain t y bands. Because they are p ath wise and account for the uncertain ty in the parameters (as outlined in Section 5.3 ), they are m uch larger than those pro vided b y climate scien tists. In f act, our uncertain ty band s are so wide th at they env e lop all of the other bac kc asts in the literature. Given their amp le width, it is difficult to say that r ecen t warming is an extraordinary ev ent compared to the last 1000 yea rs. F or example, according to our un certain t y bands, it is p ossible that it wa s as w arm in the y ear 1200 AD as it is to d a y . In con trast, th e reconstructions pro duced in Mann et al. ( 2008 ) are completely p oint wise. Another adv an tage of our metho d is that it allo ws us to calculate p oste- rior probabilities of v arious scenarios of in terest by simulati on of alte r nativ e sample paths. F or example, 1998 is generally consid ered to b e the warmest 36 B. B. MCSHAN E AND A. J. WYNER y ear on record in the North er n Hemisphere. Using our mo del, w e calculate that th ere is a 36% p osterior probabilit y th at 1998 w as th e wa rmest y ear o v er the past thousand. If w e consider rolling decades, 1997–2 006 is the warmest on r ecord; our mo d el giv es an 80% chance that it was the warmest in the past 1000 yea rs. Finally , if we lo ok at rolling 30-y ear blo cks, the p osterior probabilit y that the last 30 ye ars (again, the wa rmest on record) w ere the w arm est o ver the past thousand is 38%. Similarly , w e can lo ok at p osterior probabilities of th e r un-up in (or deriv a- tiv e of ) temp eratures in add ition to th e lev els. F or this p u rp ose, w e defined the “deriv ativ e” as the differen ce b et w een the v alue of the lo ess smo oth of the temp erature series (or reconstruction series) in ye ar t and ye ar t − k . F or k = 10 , k = 30, and k = 60, w e estimate a zero p osterior probabilit y that the past 1000 years cont ained ru n-ups larger than those we ha v e ex- p erienced o ver the past ten, 30, and 60 years (agai n, th e largest su ch ru n- ups on record). This s uggests that the temp er atur e deriv ativ es encounte red o ve r recent history are unpr eceden ted in the millenniu m . While this do es seem alarming, we shou ld temp er our alarm somewhat b y consider in g aga in Figure 15 and th e fact that the pro xies seem unable to capture the sharp run-up in temp erature of the 1990 s . That is, our p osterior probabilities are based on d eriv ativ es f rom our mo del’s proxy-based reconstructions and we are comparin g these deriv ativ es to deriv ativ es of the actual temp erature series; insofar as the pro xies cannot capture sharp run -ups, our mo d el’s re- constructions w ill not b e able to either and ther efore will tend to un derstate the probabilit y of s u c h run-up s. 5.5. M o del validation. Th ough our mo del giv es forecasts and bac k casts that are broadly comparable to those p ro vided by climate scienti sts, ou r approac h suggests that there is substantial u ncertain t y ab out th e abilit y of the m o del to fit and pr edict new data. Climate scien tists estimate out- of-sample uncertain t y u sing only t w o holdout blo c ks: one at the b eginning of the instrumental p erio d and one at the end. W e pursue that strategy here. First, w e fit on 1880– 1998 AD and attempt to bac kc ast 1850–187 9 AD. Then, we fit on 1850–19 68 AD and forecast 1969–199 8 AD. These blo c ks are arguably the most interesting and imp ortan t b ecause they are n ot “tied” at t wo end p oin ts. Thus, they genuinely reflect the most imp ortan t mo deling task: reconstruction. Figure 18 illustrates that the m o del seems to p erform reasonably well on the first holdout b lo c k. Ou r reconstruction r egresses partly b ac k to wa rd the in-sample mean. Compared to the actual temp erature s eries, it is biased a bit upw ard. On the other hand, th e mo del is far more in accurate on the second holdout blo c k , the mo dern p erio d. Our reconstruction, happ ily , do es n ot mo ve to ward the in-sample mean and ev en r ises substantiv ely at first. Still, it seems there is simply not enough signal in the pro xies to d etect either the A ST A TISTICAL ANA L YS IS OF MUL TIPLE TEMPERA TUR E PRO X IES 37 Fig. 1 8. Pr e dictions fr om the Bayesian mo del of Se ction 5 when the first 30 ye ars of instrumental data ar e held out (top) and when the last 30 ye ars of i nstrumenta l data ar e held out ( b ott om) . CRU is given in black and the mo del pr e dictions in r e d. The r aw data and pr e dictions ar e given by the thin l ines and lo ess smo oths ar e given by the thick li nes. Unc ertainty b ands ar e indic ate d by the gr ay r e gion. high levels of or the sh arp run -up in temp erature seen in the 1990s. This is disturbin g: if a mo del cannot pr edict the occur rence of a sharp ru n -up in an out-of-sample blo ck which is con tiguous with the in-sample training set, then it seems highly unlikely that it has p o wer to detect su c h lev els or run-ups in the more d istan t past. It is even more discour aging when one recalls Figure 15 : the mo d el cannot capture the sharp run -up ev en i n-sample . In sum , these results suggest that the 93 sequences that comprise the 100 0-y ear-old pro xy record simply lac k p o wer to detect a sharp increase in temp erature. 12 As ment ioned earlier, scien tists hav e collected a large b o dy of evidence whic h su ggests that there was a Mediev al W arm P erio d (MWP) at least in 12 On the other h and, p erhaps our mo del is u nable to d etect th e high level of and sharp run- u p in recent temp eratures b ecause anthrop ogenic factors hav e, for example, caused a regime change in the relatio n b etw een temp eratures and pro x ies. While th is is certainly a consistent line of reasoning, it is also fraugh t with p eril for, once one admits th e p ossibilit y of regime changes in the instru mental p eriod , it raises th e q uestion of wheth er such changes exist elsewhere ov er th e past 1000 years . F u rthermore, it implies that up t o half of the alrea dy short in strumental record is corrupted by anthrop ogenic facto rs, thus undermining paleo climatology as a statistical enterpris e. 38 B. B. MCSHAN E AND A. J. WYNER T able 2 Per c ent of time various nul l mo dels outp erform the Bayesian mo del of Se ction 5 Pseudo-proxy First blo c k p -v alue Last block p -v alue White Noise 0.0% 0.0% AR1(0.25) 0.1% 0.0% AR1(0.4) 0.1% 0.0% Empirical AR1 24.1% 20.6% Bro wnian Motion 16.4% 32.2% p ortions of the Northern Hemisphere. The MWP is b eliev ed to h a v e o ccurred c. 800–1300 AD (it w as follo wed b y the Little Ice Age). It is widely h op ed that m ulti-pro xy mo dels h av e the p o we r to d etect (i) ho w w arm the Mediev al W arm Pe rio d was, (ii) h o w sh arply temp eratures increased dur ing it, and (iii) to compare these t wo f eatures to th e past decade’s high temp eratures and sharp run-up. Since our mo del cannot detect the recen t temp erature c hange, detection of dramatic c hanges hundreds of y ears ago seems out of the question. This is not to sa y that the proxy record is unrelated to temp eratur es. W e can compare our mo del’s RMSE in these tw o holdout p eriod s to v arious null mo dels whic h w e kn o w hav e no signal. That is, we can p erform a test similar to that of Sectio n 3.4 . On eac h holdout blo ck, w e generate a 149 × 93 matrix of pseudo-pro x ies from eac h of the six null mo d els known to b e in d ep endent of the temp erature series. Th en, analogously to our mo d el, w e tak e th e first ten pr incipal comp onen ts of these pseudo-pro xies, regress the in-sample temp erature on the ten in-sample principal comp onen ts, and compu te the RMSE on the holdout blo c k. W e p erf orm this p ro cedure 1000 times for eac h holdout blo c k and then calculate the p ercen tage of time that the mo del fi t to the pseud o-pro xies b eats our mo del. Our m o del, with an RMSE of 0.26 on the first holdout blo ck and an RMSE of 0.36 on the second handily outp er f orms the relativ ely u nsophisticated white n oise an d w eak AR1 pro cess pseu do-pro xies (see T able 2 ). Again, this is not su rprising. These pseud o-pro xies cann ot capture th e local dep endence in the instrumenta l r ecord, s o they regress sharply to the in-sample mean. On the other hand, the Empirical AR1 pro cesses and Bro wnian motion hav e more complex local stru cture so they pr ovide resp ectable comp etition to our mo del. These mo d els capture only the local dep endence in the temp erature record: in the long term, forecasts based off the AR1 pro cesses will slide slo wly bac k to the in-sample mean and forecasts based off Brownian motion will wander aimlessly . T ake n toget her, it follo ws that our m o del is at b est w eakly significan t relativ e to th e Empirical AR1 p r o cess or Bro wn ian motion on either holdout blo c k. A ST A TISTICAL ANA L YS IS OF MUL TIPLE TEMPERA TUR E PRO X IES 39 In tandem, Figure 18 and T able 2 should mak e us v ery cautious ab out using our mo del to extrap olat e, ev en with wide standard errors. T he second panel of Figure 18 demons trates that these standard errors are too narro w ev en for v ery temp orally short forecasts. While w e are able to replicate the significance tests in Mann, Bradley and Hu ghes ( 1998 ), our T able 2 s h o ws that our mo del do es not p ass “statistical signifi cance” thresh olds against sa vvy null mo dels. Ultimately , wh at these tests essen tially sh o w is th at the 1000- y ear-old pro x y record has little p o we r giv en the limited temp erature record. 6. Conclusion. Researc h on m u lti-pro xy temp erature reconstructions of the earth’s temp erature is no w en tering its second d ecade. While th e liter- ature is large, there has b een v ery little collab oration with unive rsit y-leve l, professional s tatisticians [W egman, Scott and Said ( 2006 ), W egman ( 2006 )]. Our pap er is an effort to apply some mo dern statistical m etho ds to th ese problems. While our results agree with the climate scien tists find in gs in some resp ects, our metho ds of estimating mo d el uncertaint y and accuracy are in sharp disagreemen t. On the one hand , we conclude unequiv o cally that the evidence for a “long- handled” ho c key stic k (where the shaft of the h o c ke y stic k extend s to the y ear 1000 AD) is lac king in th e d ata. Th e fun damen tal problem is that there is a limited amoun t of pr o xy data wh ic h d ates b ac k to 1000 AD; what is av ailable is weakly predictiv e of global annual temp erature. Our bac kca s tin g metho ds, which track qu ite closely th e metho ds app lied most recen tly in Mann ( 2008 ) to th e same d ata, are unable to catc h the sharp run up in temp eratures recorded in the 1990s, ev en in -samp le. As can b e seen in Figure 15 , our estimate of the run up in temp erature in the 1990s h as a muc h smaller slop e than the actual temp erature series. F urthermore, the lo we r frame of Figure 18 clearly rev eals that the proxy mo del is not at all able to track the high gradien t segmen t. Cons equen tly , the long flat handle of the ho c k ey stick is b est un dersto o d to b e a feature of regression and less a reflection of our kno wledge of the truth. Nev erth eless, the temp eratur es of the last few decades hav e b een relativ ely w arm compared to man y of the 1000- y ear temp erature curv es sampled from th e p osterior d istribution of our mo del. Our main con tribution is our efforts to seriously grapple with the u ncer- tain t y inv olv ed in paleo climatologic al reconstru ctions. Regression of high- dimensional time series is alw a ys a complex pr ob lem with many traps. In our case, the p articular chall enges include (i) a short sequence of training data, (ii) more predictors than observ ations, (iii) a v ery w eak signal, and (iv) resp onse and predictor v ariables wh ich are b oth strongly auto correlated. The final p oin t is particularly trou b lesome: since the d ata is n ot easily mo d eled 40 B. B. MCSHAN E AND A. J. WYNER b y a simp le autoregressiv e p ro cess, it f ollo ws that the num b er of truly ind e- p endent observ atio ns (i.e., the effectiv e sample size) ma y b e just to o s mall for accurate reconstruction. Climate scien tists hav e greatly u nderestimated the uncertaint y of pro xy- based r econstructions and hence ha ve b een o verco n fident in their mo d els. W e ha ve sh o wn that time dep endence in the temp erature series is suffi- cien tly strong to p ermit complex sequences of rand om n u m b ers to forecast out-of-sample reasonably w ell fairly frequen tly (see Figures 9 and 10 ). F ur - thermore, ev en p ro xy-based mod els with appro ximately the same amoun t of reconstructiv e skill (Figures 11 – 13 ), p r o duce strikingly dissimilar historical bac kca s ts (Figure 14 ); some of these lo ok lik e ho c key stic ks bu t most do not. Natural climate v ariabilit y is not well un dersto o d and is probably quite large. It is not clear that the p ro xies currently used to predict temp erature are ev en p redictiv e of it at the scale of sev eral decades let alone o v er man y cen turies. Nonetheless, paleo climatolig ical reconstructions constitute only one source of evidence in the A GW debate. Our w ork stands entirel y on the sh oulders of those en vironmen tal sci- en tists who lab ored u n told yea rs to assem b le the v ast n et wo r k of natural pro x ies. Although we assume the reliabilit y of their data for our pur p oses here, there still r emains a consider ab le num b er of outstanding questions that can only b e answ ered with a fr ee and op en inquiry and a great deal of replication. Ac kn o wledgment s . W e th an k Ed itor Mic hael Stein, t w o anonymous ref- erees, and Tilmann Gneiting for th eir helpfu l suggestions on our manuscript. W e also thank ou r colleagues Larry Bro wn and Dean F oster for man y h elpful con versat ions. SUPPLEMENT AR Y MA T ERIAL Co de rep ository for “A statistical analysis of m u ltiple temp erature prox- ies: A re reconstructions of surf ace temp eratures o ver the last 1000 years reliable?” (DOI: 10.121 4/10-A OAS398SUPP ; .zip). This rep ository arc h iv es all data and co de used for “A statistica l analysis of multiple temp erature pro x ies: Are r econstructions of s urface temp eratures o ver the last 1000 yea rs reliable?” In particular, it con tains cod e to mak e all figures and tables f ea- tured in the pap er. REFERENCES Amman, C. M. , Joos, F. , Otto-Bliesner, B. L. and Tomas, R. (2007). Solar influen ce on climate during the past millennium: Results from transient sim ulations with the NCAR climate system model. Pr o c. Natl. A c ad. Sci. USA 104 3713–3718 . Ammann, C. and W a hl, E. ( 2007). The imp ortance of th e geoph ysical con text in statis- tical ev aluations of climate reconstruction pro cedures. Cl imatic Change 85 71–88. A ST A TISTICAL ANA L YS IS OF MUL TIPLE TEMPERA TUR E PRO X IES 41 BBC (2008). Earth: The Climate Wars . British Broadcasting Company , Sep t em b er 14. Bradley, R. S. (1999). Pale o climatolo gy: R e c onstruct i ng Cl imates of the Quaternary , 2nd ed. Academic Press, San Diego. Christiansen, B. , Schmith, T. and Thejll, P. ( 2009). A surrogate emsem ble study of climate reconstruction meth ods: S tochasticit y and robustness. Journal of Climate 22 951–976 . Gore, A. (2006). An I nc onvenient T ruth . Lawrence Bender Pro ductions. Granger, C. W. J. and Newbold, P. (1974). Spu rious regressions in econometrics. Journal of Ec onometr ics 2 111– 120. Green, K. C. , Armstrong, J. S. and Soon, W. (2009). V alidity of climate c hange forecasting for pu blic p olicy decision-making. International Journal of F or e c asting 25 826–832 . Haslett, J. , Whiley, M. , Bha tt achar y a, S. , Sal ter-To wnshe nd, M. , Wil- son, S. P. , Allen, J. R. M. , Huntley, B . and Mitchell, F. J. G. (2006). Bay esian palaeoclimate reconstruction. J. R oy. Statist. So c. Ser. A 169 395– 438. MR2236914 IPCC (2001). Climate Change 2001: The Scientific Basis . Cambridge Univ. Press, Cam- bridge. IPCC (2007). Cl imate Change 2007: The Physic al Scienc e Basis. Contribution of W orking Group I t o the F ourth Assessmen t Rep ort of the Intergo vernmental P anel on Climate Change. Johnson, K. (2009). Climate emails stoke debate. Wal l Str e et Journal . Novem b er 23, page A3. Johnson, K. and N aik, G. (2009). Lawma kers prob e climate emails. Wal l Str e et Journal . Nov ember 24, p age A8. Jolis, A. (2009). R evenge of the climate la y men. Wal l Str e et Journal . Nove mber 18. Ladurie, E. L. (1971). Ti mes of F e ast, Times of F amine: A History of Clim ate Sinc e the Y e ar 1000 . D oubleday , New Y ork. Lamb, H. H. (1990). Cl imate: Past, Pr esent and F utur e . Routledge, New Y ork. Lee, T. , Zwiers, F. W. and T sa o, M. (2008). Ev aluation of p ro x y-based millennial reconstruction metho ds. Climate Dynamics 31 263 –281. Li, B. , Nychka, D. W. and Amman, C. M . (2007). The ‘ho c key stick’ and th e 1990s: A statistical p ersp ective on reconstruct in g h emispheric temp eratures. T el lus 59A 591–598. Li, B. , Nychka, D . W. and A mman, C. M. (2010). The v alue of multi-pro xy reconstructin of past climate. J. Amer. Statist. Asso c. 105 883–8 95. Luterbacher, J. , Di eterich, D. , Xoplaki, E. , G r osjean, M. and W anner, H. (2004). Europ ean seasonal and annual temp erature v ariability , trends, and extremes since 1500. Scienc e 202 1499–1503. Mann, M. E. ( 2004). On smoothing p otentially non- stationary climate time serie s. Ge o- physic al R ese ar ch L etters 31 . Mann, M. E. ( 2008). Smo othing of climate time series rev isited. Ge ophysic al R ese ar ch L etters 35 . Mann, M. E. , Brad ley, R. E. an d Hu ghes, M. K. (1998). Global-scale temperature patterns and climate forcing o ver the past six cen t u ries. Natur e 392 779–787. Mann, M. E. , Bradley, R. E. and Hughes, M. K. (1999). Northern hemisphere tem- p eratures during the past millennium: Inferences, uncertainties, and limitations. Ge o- physic al R ese ar ch L etters 26 759–762. Mann, M. E. , Bradley, R. E. and Hughes, M. K. (2004). Corrigendum: Global-scale temp erature patterns an d climate forcing ov er the past six cen turies. Natur e 430 105 . Mann, M. E. and Rutherf ord, S. (2002). Climate reconstruction using pseudoproxies. Ge ophysic al R ese ar ch L etters 29 1501. 42 B. B. MCSHAN E AND A. J. WYNER Mann, M. E. , Rutherfo rd, S. , W ahl, E. and Am mann, C. (2005). T esting the fidelit y of metho ds used in proxy-based reconstructions of past climate. Journal of Climate 18 4097–41 07. Mann, M. E. , Rutherf ord, S. , W ahl, E. and Ammann , C. (2007). Robustn ess of pro xy- based climate fi eld reconstruction metho ds. Journal of Ge ophysic al R ese ar ch 112 . Mann, M. E. , Zhang, Z. , Hughes, M. K. , B radley, R. S. , Miller, S. K. , Ruther- fo rd , S. and N i, F. (2008). Proxy-based reconstru ct ions of hemispheric and global surface t emp erature v ariations ove r the past tw o millenia . Pr o c. Natl. A c ad. Sci. USA 105 13252–132 57. Ma tthes, F. E. (1939). Rep ort of the committee on glaciers . T r ansactions of the Amer- ic an Ge ophysic al Union 20 518–523. McIntyre, S. and McKitrick, R. (2003). Corrections to th e Mann et al. (1998) pro xy base and north ern hemispheric av erage temp erature series. Ener gy and Envir onment 14 751–771 . McIntyre, S. and McKitrick, R. (2005a). Hockey sticks, principal comp onents, and spurious significance. Ge ophysic al R ese ar ch L etters 32 . McIntyre, S. and McKitri ck, R . (2005b). The M&M critique of th e MBH98 an d north- ern hemisphere climate ind ex: Up date and implications. Ener gy and Envir onment 16 69–100. McIntyre, S. and McKitri ck, R. (2005c). Reply to comment b y Hu yb ers on “Hock ey stic k s, principal components, and spurious significance.” Ge ophysic al R ese ar ch L etters 32 L20713. McShane, B. B. and Wyner, A. J. (2011). Sup plement to: “A statistical analysis of multiple temp erature proxies: Are reconstructions of su rface temp eratures o ver the last 1000 years reliable? ” DOI: 10.1214 /10-A OAS398SUPP . Na tional Re search C ouncil (2006). Surface temp erature reconstructions. National Academic Press, W ashington, DC. Phillips, P. C. B. (1986). Und erstanding spurious regressions in econometrics. J. Ec ono- metrics 33 311–340. MR0867979 Ro thstein, E. ( 2008). Apo calypse now, via diorama. The New Y ork Tim es . Octob er 17, page C27. Rutherf ord, S. , Mann, M. E. , Osborn, T. J. , Bradley, R. S. , Briff a, K. R. , Hughes, M. K. and Jones, P. D. (2005). Pro xy -based northern hemispheric surface reconstructions: Sensitivity to metho d, p red ictor netw ork, target season, and target domain. Journal of Climate 18 2308–2329 . Schneide r, T. (2001). Analysis of incomplete climate data: Estimation of mean v alues and co vari ance matrices and imputation of missing val ues. Journal of Cl i mate 14 853–871. Tibshirani, R. (1996). R egression shrink age and selec tion via the lass o. J. R oy. Statist. So c. Ser. B 58 267–288. MR1379242 Tingley, M. and Huybers, P. (2010a). A Bay esian algori thm for reconstructing climate anomalies in sp ace and time. Part I: Development and applications to paleo climate reconstruction problems. Journa l of Climate 23 2759–278 1. Tingley, M. and Huybers, P. (2010 b). Bay esian algorithm for reconstructing climate anomalies in space and time. Pa rt I I: Comparison with the regularized exp ectation– maximization algorithm. Journal of Climate 23 2782–2800. vo n Stor ch, H. E. and Zorit a , E. (2005). Comment on “Ho c key sticks, p rincipal com- p onents, and spu rious significance,” by S. McInt yre and R. McKitrick. Ge ophysic al R ese ar ch L etters 32 . vo n Stor ch, H. E. , Zorit a, E. , Jones, J. M. , Dimitriev, Y. , Gonzalez-Rouco, F. and Tett, S. (2004). Reconstructin g past climate from noisy data. Scienc e 306 679–682. A ST A TISTICAL ANA L YS IS OF MUL TIPLE TEMPERA TUR E PRO X IES 43 vo n Stor ch, H. E. , Zorit a, E. , Jones, J. M. , Dimitriev, Y. , Gonzalez-Rouco, F. and Tett, S. (2006). Resp onse to comment on “Reconstructing past climate from noisy data.” Scienc e 213 529. W ahl, E. R. and Am man, C. M. (2006). R obustness of the Mann , Bradley , Hu gh es reconstruction of the Northern Hemisphere surface temp eratures: Examination of crit- icisms based on the nature and pro cessing of proxy climate evidence. Climatic Change 85 33–69. W ahl, E. R. , Ri tson, D. M. and Amm an, C . M. (2006). On “Reconstruction past climate from n oisy data.” Scienc e 312 592b. Wegman, E. J. (2006). Resp onse of Dr. Edwa rd W egman to questions p osed by the honorable Bart St u pak in connection with testimony to th e sub committee on ov er- sigh t and investig ations. Av ailable at http://www.uoguelp h.ca/ ~ rmckitri/research/ StupakResp onse. pdf . Wegman, E. J. , S cott, D. W. and Sai d, Y . H. (2006). Ad Ho c committee rep ort on t h e ‘ho ck ey stick’ global climate reconstruction. A v ailable at http://republi cans. energycomm erce. house.gov/108/home/07142006_Wegman_Report.pdf . Wu, Y. , B oos, D. D. and Stef anski, L. A. (2007). Controlling v ariable selection by the addition of pseudo va riables. J. Amer. Statist. Asso c. 102 235–243 . MR2345541 Yule, G. U. (1926). Why do we sometimes get n onsense correlations b etw een time series? A study in sampling and the nature of time series. J. R oy. Statist . So c. 89 1–64. Kellogg School of Management Nor thwestern University Leverone Ha ll 2001 Sheridan Road Ev an ston, Illinois 60208 USA E-mail: b-mcshane@k ell ogg.north western.edu URL: ht tp://www.bl ak emcshane.com Dep ar tment of St a tistics The Whar ton School University of Pennsyl v ania 400 Jon M. Huntsman Hall 3730 W alnut Street Philadelphia, Pennsyl v ania 191 04 USA E-mail: a jw@wharton.up enn.edu URL: ht tp://www.adiwyner.com
Original Paper
Loading high-quality paper...
Comments & Academic Discussion
Loading comments...
Leave a Comment