Band-phase-randomized Surrogates to assess nonlinearity in non-stationary time series
Testing for nonlinearity is one of the most important preprocessing steps in nonlinear time series analysis. Typically, this is done by means of the linear surrogate data methods. But it is a known fact that the validity of the results heavily depend…
Authors: Diego Guarin, Edilson Delgado, Alvaro Orozco
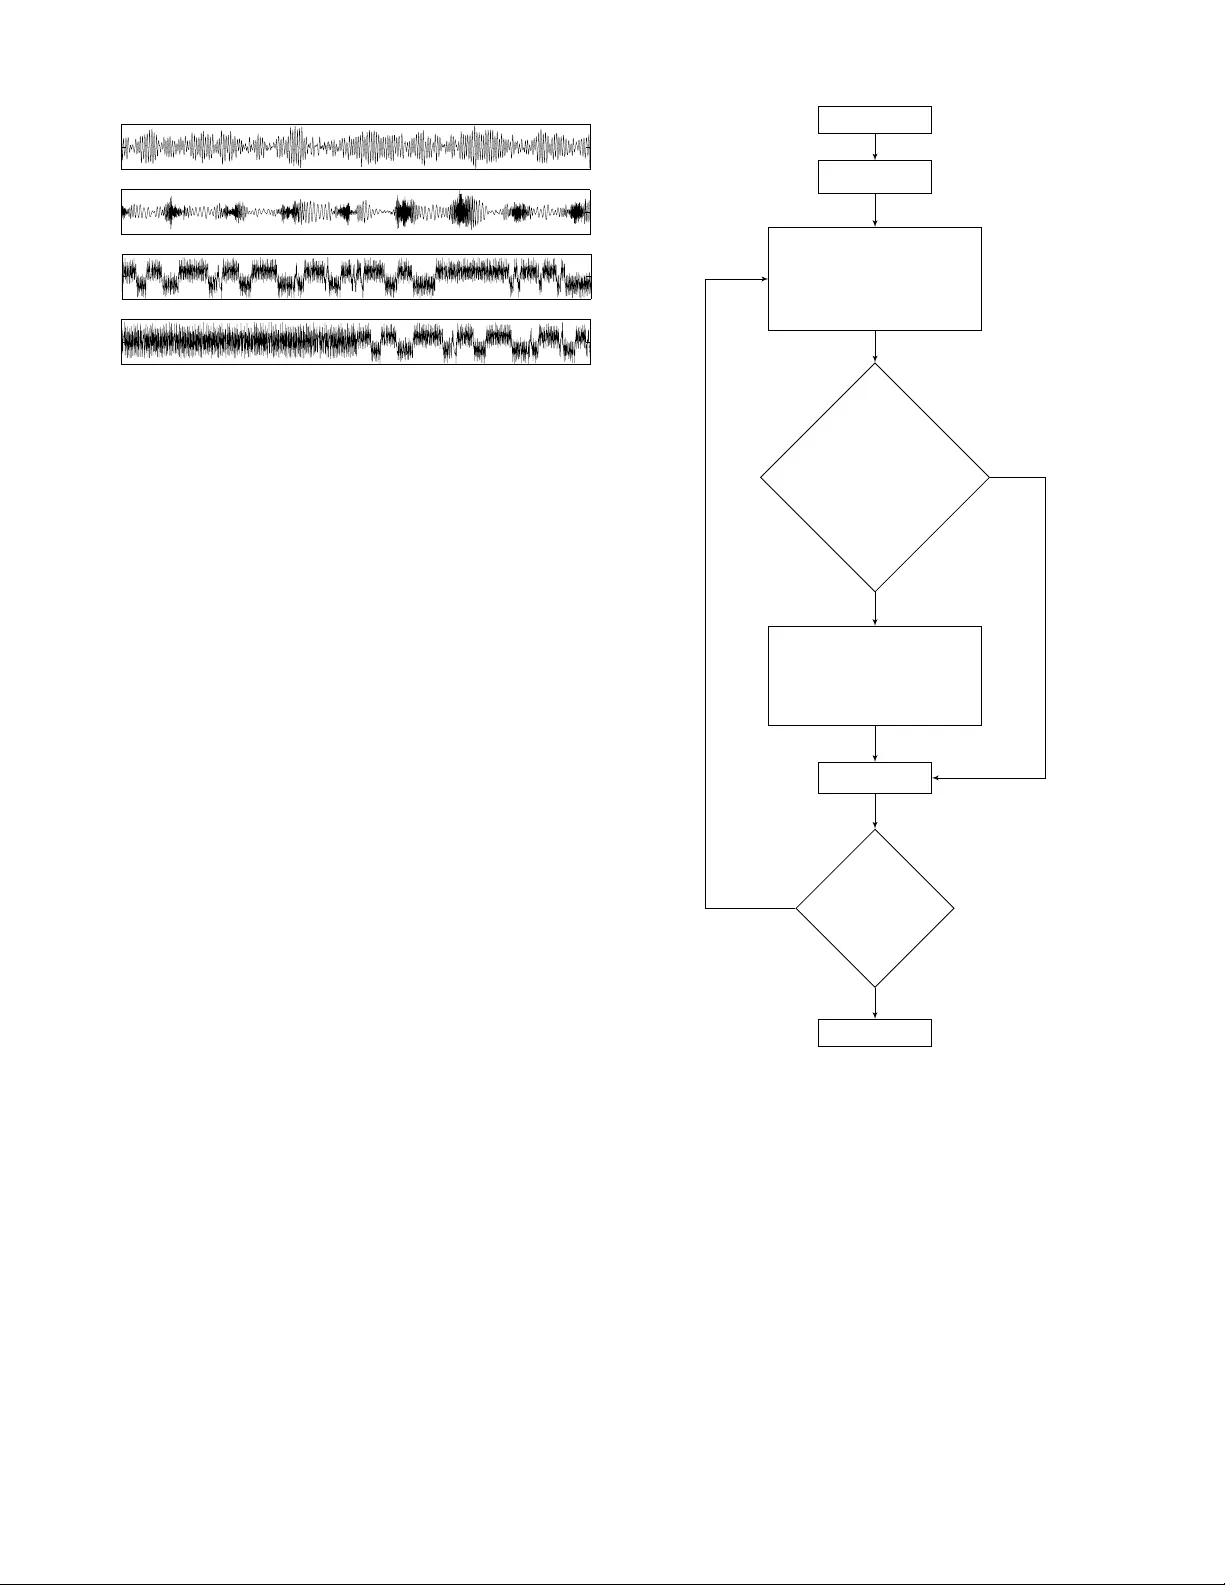
IEEE TRANSACTIONS ON BIOMEDICAL ENGINEERING, V OL. ?, NO. ?, J ANUAR Y 2011 1 Band-phase-randomized Surrogates to assess nonlinearity in non-stationary time series Diego Guar ´ ın ∗ , Stude nt Member , IEEE, Edilson D elgado, Member , IEEE, an d ´ Alvaro Orozco. Abstract —T e sting for nonlin earity is one of the most important preproc essing steps in nonlin ear time series analysis. T ypically , this is done by means of the linear surrog ate data methods. But it is a known fact that the va lidity of the results hea vily depends on the stationarity of the time series. Since most physiological signals are non-stationary , it is easy to falsely detect nonlinearity using the linear surr ogate data methods. In this document, we propose a methodology to extend the pr ocedure fo r generating constrained surrogate time series in order to assess nonlinearity in n on-stationary data. The method is b ased on the b and-phase-randomized surrogates, which consists (contrary to the li near surr ogate data methods) in randomizing only a portion of the Fourier phases in the high frequency band . Analysis of simulated time series showed that in comparison to the linear surrogate data method, our method is abl e to discriminate between linear stationarity , linear non-stationary and nonlinear t ime series. When applying our methodology to heart rate va riability (HR V) time series that present sp ikes and other kinds of nonstationarities, we where able to obtain surrogate time series that look l ike the data and preserv es lin ear correla tions, something that is not possib le to do with th e existing surrogate data m ethods. Index T erms —Computational methods in statisti cal physics and n onlinear dynamics, hypothesis t esting, surrogate d ata, heart rate variability . I . I N T R O D U C T I O N T he surrogate data m ethod, initially intro duced by J. Theiler et al. [1] is n ow adays one of the most po pular tests used in non linear time series analysis to inv estigate the existence of non linear dynam ics un derlying exper imental data. The approach is to f ormulate a null hy pothesis f or a specific pr ocess class and compare the system outp ut to th is hypoth esis. The surro gate d ata method can be undertaken in two d ifferent ways: T ypical r ealizatio ns ar e Monte Carlo generated surr ogates from a linear model that provides a good fit to the data; constrained r ealizations are surrogates generated from the time serie s to fulfill the n ull hypothesis and to con form to certain prop erties of the data. Th e latter approa ch is suitable for hypothe sis testing du e to the fact that it does n ot r equiere pi votal statistics [2]. In or der to test a n ull hypoth esis a t a certain co nfidence level, one has to gen erate a given numb er of sur rogates. Th en, one ev okes whatever statistic is of interest and compa res the value of th is statistic computed f rom the data to th e distribution of values elicited D. Guarin and A. Oro zco are with th e Department of Elect rical E ngineer ing, Uni versid ad T ecno l ´ ogic a de Pereira - UTP , V ere da la Julita, Pereira, Colombia. E. Delga do is with the Research Cent er of the In stituto T ecnol ´ ogico Metropol itano – IT M, Calle 73 No. 76A-354 V´ ıa al vol ador , Medell ´ ın, Colombia. ∗ Correspondi ng author . email : dlguari n@ieee.com from the surro gates. If the statistic value of the data d eviates from th at of th e surr ogates, then the null hypo thesis may be rejected. Otherwise, it may not. The linear metho ds for co nstrained realizations namely (i) Random shu ffle (RS); (ii) Ran dom phase (RP); and, ( iii) Amplitude adjusted Fourier transfor m (AAFT) surrog ates [1], were developed to test the null hyp othesis tha t th e data came from a (i) i.i.d gaussian r andom p rocess, ( ii) linear co rrelated stochastic process; and (iii) no nlinear static tr ansformatio n of a line ar stochastic proce ss. Sur rogates gener ated with the RS method are con strained to the a mplitude d istribution ( AD ) or rank distribution of th e o riginal data, wh ile the on es gener ated with the RP alg orithm preserve the auto correlation ( AC ( τ ) ) and surro gates ge nerated with the AAFT algorith m pr eserve both the AD a nd AC ( τ ) of th e original data. As the pr ocess that gener ates su rrogate data is stationary [3], there cou ld be some situatio ns where surro gates fail to match the d ata, e ven though the AD an d AC ( τ ) are the same for the data and surrogates, so the n ull hypo thesis co uld be trivially rejected. This is particulary tr ue when data a re non stationary . Because of this, when the statistical properties of data are time dependen t it is not feasible to use the linear surrogate data metho ds for testing no nlinearity [4] (Timmer [5] showed that for some non-stationar y pro cesses th e test is able to discriminate between linear and n onlinear data, but this is not a gener al result). From the introdu ction of the linear surrogate data method, there has been a widesp read interest in m odifying it to assess nonlinear ity in non-statio nary time series. The first attempt (as w e can tell) to apply the method to non-station ary time series was done by T . Schreibe r [6]. He proposed that to deal with non-stationa rity data, the null hypothesis should include it explicitly . Because other wise, the rejection of a null hypothesis can be eq ually to n onlinearity or non-station arity . e.g., giv en any process we can ask whether the d ata is compatible with the null h ypothesis of a correlated linear stoch astic process with time d ependen t local behavior . In or der to answer this question in a statistical sense we have to create surro gate time series that show the same linear co rrelations an d the same time d ependen cy of the loca l b ehavior as the d ata and compare a nonlinear statisti c between data and surroga tes [4]. T o gener ate surrogates constraine d to data AC ( τ ) and time depend ence of lo cal behavior , T . Schreib er [6] u sed an iterativ e proced ure called simulate d annealing. Unfo rtunately , this method re quires a big amoun t of co mputation al time an d never became of po pular usag e. In a nother study , A. Schmitz a nd T . Schreib er [7] pr oposed a different method to de al with no n-stationarity . Th e p roposed IEEE TRANSACTIONS ON BIOMEDICAL ENGINEE RING, V OL. ?, NO. ?, JANU AR Y 2011 2 method inv olved dividing the sign al in to stationary segments, then applying the linear surrog ate data method to each segment and finally joining the segments to form a surrogate time series of the same size as the orig inal data. The major problem with this proce dure is that the re is not a stra ightforward way to find stationary segments in a no n-stationary signal. Recently , T . Nakamur a and M. Small [8] pro posed a new methodo logy to apply the surrog ate data metho d to time series with trend s, called Small Shu ffle Surrogate ( SSS) d ata metho d which is a m odification of the RS algorithm . T he main idea introdu ced in [ 8] is that in or der to preserve the trend of the data in surrog ates, the randomization should be applied only in a small scale, in this way all local co rrelations in the origin al time series are destroyed in sur rogates; but the global b ehavior (i.e., the trend ) is preserved. Based on the idea of preserv ing the slo w behavior of the signal in sur rogates, T . Nakamura et al. [9] presen ted a mod ification of the RP algorithm which makes it suitable for da ta with trends. They called it th e Truncated Fourier Transform Surroga te (TFTS) data meth od. TFTSs are constrain ed to confor m to the AC ( τ ) and with the co rrect parameter selection to the trend of d ata (the a uthors also apply the mod ification to the iAAFT method, th us preserving the AD , AC ( τ ) and the trend of d ata in surrog ates). So, n onstationarities (in this case caused by the presen ce of a tren d) ar e included in the null hypothesis, as su ggested by A. Schmitz and T . Schreiber [4], [6]. Th e idea of the method is to preserve the slow behavior or trend s while destroyin g all possible nonlinear co rrelations in th e irregular fluctu ations. T o achieve this goal, the authors pr oposed to r andomize phases only in the higher-frequen cy domain and not alter the low-frequency phases ( the o riginal idea of ban d-phase-r andomized surro gates was briefly propo sed by J. Theiler et al. [ 10] but it was not implemented u ntil the work of T . Nakam ura et al. [9]). This approa ch is in contra st to linea r surro gate m ethods (RP and iAAFT), where all p hases are rand omized. It is worth mentio ning that other attempts h av e b een made in order to assess no nlinearity in non- stationay da ta. L. Faes et al. [11] p resented a method for calculatin g th e parameter s of an no n-stationary AR model. Based on this me thod, they generated typical realization s of the non-stationary He art Rate V ariability (HR V) signals and tested f or no nlinearity , but as the surrogates a re typical r ealizations, one n eeds a pivotal statistic. Recently , C.J. Keylock [12] presented a m odification of th e iAAFT method based on the w avelet tran sform, with this m ethod it is p ossible to generate sur rogates constrained to preserve the AC ( τ ) and the local mean and v ar iance of the data, but according to our personal experience the method propo sed by T . Nakam ura et al. [9] is simp ler to imp lement and achieves similar results. In a rece nt publication [13], we presented a modification of th e TFTS throug h wh ich we assessed nonlin earity in data with spikes, but this method is limited to data with gaussian AD . In this d ocument we intro duce the band-ph ase-rando mized surrogate methods in a rather o rganized way , we also p resent the alg orithms to facilitate an d prom ote the application of the method. In regard s to the meth od, we presen t a discussion on the param eter selection and introdu ce some mo difications to th e param eter selec tion c riteria in ord er to m ake the method s uitable for different types of n onstationarities ( not only tren ds). T o test the prop osed meth odology we applied the test to several simulated tim e series with different dy namical proper ties. W e also app lied the method s to HR V signals of healthy patients. Finally we co nclude. I I . B AC K G R O U N D Prior to introduc ing th e cur rent technolo gy in surro gate data method s, it is vital to make one observation: Hypo thesis testing, such as the surroga te data method, cannot be used to d etermine wh at the data is , only what the data is no t [2]. That is; if after our comparison we cannot disting uish between data an d surroga tes, this m ay b e simply b ecause o ur selected statistic is inadeq uate. Con versely , if the data and surrogates a re different, then we can sate, that, with a certain probab ility the data is not con sistent with the correspo nding null hypo thesis. A. Surr ogate d ata methods 1) Linear su rr ogate d ata metho ds: Linear surrogate data were introduce d to preclude a lin ear filtered no ise source as the po ssible o rigin o f e xperim ental d ata. T he algorithms, as stated earlier, gener ate surrogate data that fulfill the null hypothesis of IID noise; linearly filtered noise; an d, a monoto nic no nlinear transf ormation of lin early filtered noise. Hence, these techn iques p roduce flawless linear data. Th e algorithm s to generate such surrog ates can be stated as follows [1]. RS A su rrogate time series { s t } is generated from th e scalar time ser ies data { x t } by randomly shu ffling { x t } . This process d estroys all temp oral co rrelations (which ar e no t expected in a IID process) but maintains the sam e AD . RP The surr ogate { s t } is g enerated by taking the Fourier transf orm of the data, rando mising the phases (replacing it by th e phases of a rand om I ID process of the same length as { x t } ), and tak ing the inverse Fourier transform. Th e surrogate th erefore maintains the linear corr elations o f d ata but any n onlinear structure is destroyed . AAFT On e first re-scales the data orig inal time series so that it is Gaussian, then gen erates an Algorithm 1 surrogate of the data { p t } , and finally re-o rders the original data so that it ha s the same ran k d istribution as { p t } . Th is re-or dered time series constitutes the surrogate { s t } . This pro cess a chiev es two aims: first, just as with th e Algorithm 1, the power spectra (and therefor e linear corre lations) of data is p reserved in surrogates; secon d, the re-o rdering process means that the AD of data an d surr ogates are also identica l. It sho uld b e no ted that the AAFT algor ithm does not deliver what it prom ises. The p hase ran domisation will preserve the linear correlation, but re-scaling the output of the inv erse Fourier transform { p t } to have the same AD as the o riginal data will alter the autoco rrelation structur e of th e data. Although the d ata an d sur rogate will have identical rank IEEE TRANSACTIONS ON BIOMEDICAL ENGINEE RING, V OL. ?, NO. ?, JANU AR Y 2011 3 distribution, the linear corr elation will only b e appr oximately the same. A solution to this problem has b een pr oposed by T . Schreibe r and A. Schim itz [14]. Essentially , the solution is to iter ate th e AAFT alg orithm until convergence is achieved. Howe ver, there is no gua rantee that this iter ation will, in fact, conv erge. This algorith m is ref ereed to as impr oved AAFT (for a discussion on the co n vergence of the iAAFT algorith m see [15]). 2) Su rr ogate d ata meth ods fo r d ata with trends: As stated earlier, when d ata are n on-stationar y , the hyp othesis addre ssed by the linear surro gate data method s are tr i vially reje cted. T w o different surrog ate data methods hav e b een proposed to tack le data with trends, the SSS and the TFTS data methods. Th e hypoth esis tested by SSS algo rithm is that th e data, wh ile possibly exhibiting some trend , is otherwise just noise [8]; while the hypoth esis tested by TFTS alg orithm is th at the data, while possibly exhibitin g some tren d, is generated by a stationary linear system [9]. Th ese algor ithms can be stated as follow [ 16]. SSS Let { i t } be the index of { x t } (that is, i t = t an d so x i t = x t ). Obtain { i ′ t } = { i t + Ag t } where { g t } ar e Gaussian rando m numbers, and A is an amplitude ( note that { i t } will be a sequ ence of integres, where as { i ′ t } w ill not) . Rank o rder { i t } to obtain { r t } . T he sur rogates { s t } ar e obtained from s t = x r t . If A is an intermed iate v alue (e .g. 1), surrogates genera ted by this algor ithm will preserve the slow trend in the data, but any inter-point dynamics will be destroyed by the local sh uffling of individual po ints. TFTS The sur rogate { s t } is gener ated by taking the Fourier transform of the data { X ω } ω . Th en generatin g random p hases φ ω , such that φ ω ∼ U (0 , 2 π ) if ω > f c and 0 if ω ≤ f c ( φ ω have to be antisym metric aro und φ 0 ). Finally taking the in verse Fourier tran sform of th e com plex series { X ω e ıφ ω } ω (Fig. 1). As in the RP surrogates, all linear de pendencie s are preserved in surrog ates. But, since some phases are untouched , T FTS data may still have n onlinear cor relations. Howe ver, it is possible to d iscriminate between linear and nonlin ear data beca use the superposition princ iple is o nly valid for linear data, so when data are nonlinear, even if the power spectrum is p reserved completely , the inverse Fourier transfo rm data using r andomized p hases will exhibit a different dyn amical b ehavior TFTSs are influenced prim arily by the ch oice of frequency f c . If f c is too hig h, su rrogates are almost identical to the original data. In this case, ev en if th ere is nonlinearity in the d ata, one may fail to detect it. Conversely , if f c is too low , surrogates are almost the same as the linear surrogate and the local behavior is no t preserved. In this case, even if there is no n onlinearity in the data, o ne may wrong ly jud ge otherwise. In general, the correct value of f c cannot be determ ined a priori . T o select an ad equate value of f c , T . Naka mura et al. [9] prop osed to start rando mizing a por tion of th e hig her frequen cy d omain (e.g. a 1 % of the high er fr equency dom ain, T ime Serie s Magnitud e Phase Randomize the phases in a portio n of th e hig her frequen cy domain T runcated Fourier T ransform Sur rogates FT IFT Fig. 1. Flow chart of the Truncate d Fou rier Transform Surrogate method. i.e., f c ≈ N/ 2 ) , decr easing f c until the data linearity is no longer preserved in th e surrogates (i.e., AC ( τ = 1 ) of data falls outside the d istribution of surro gates) and then per form the test with the last value of f c for which linearities of data are preserved in surroga tes. B. Sign ificance a nd p ower of the test Applying a statistical hypoth esis test to obser ved data can result in two outcomes: either the null hyp othesis is rejected, or it is no t. In the fo rmer case there is a pro bability α that the null hypothesis is rejected e ven th ough it is true (T ype I Error), in the latter case there is a probability β (T ype II Error) that we will fail to reject the null when it is in fact false. The prob ability α is known as the significance level, its compleme nt ( 1 − α ) is the confiden ce lev el. For exam ple, if one g enerates 19 sur rogates using some algor ithm, and these yield a larger (or smaller) v alue of some statistic than the data, then th e prob ability that th is result occurred b y ch ance is α = 1 20 , and hence we conclu de a t the 0.05 significance (0.9 5 confidenc e) level fo r a on e-sided test that the selected statistic is dif ferent from the surrogates. Conversely , th e power of a test ( 1 − β ) is the p robability th e null h ypothesis is c orrectly rejected. Clearly , the probab ility α is determ ined by the number of trials and the num ber of indepen dent test statistics. Computing α is only a matter of co mputing pr obabilities. The prob lem is that the value o f β is not clear . T he ac tual p ower β will depend on the ch oice o f test statistic. If the test statistic is indep endent of data an d surrogates then the power is determ ined by the number of trials [ 16]. I I I . N O N L I N E A R I T Y T E S T F O R N O N - S TA T I O NA RY T I M E S E R I E S : P H Y S I O L O G I C A L DA TA A P P R OA C H A. Datab ase 1) Simulated time series: T o test the proposed methodology we applied it to dif f erent sim ulated time series, two lin ear (stationary and non-station ary) an d two nonlinear (stationary IEEE TRANSACTIONS ON BIOMEDICAL ENGINEE RING, V OL. ?, NO. ?, JANU AR Y 2011 4 −1 0 1 a) −1 0 1 c) 1 2048 −1 0 1 d) −1 0 1 b) Fig. 2. a) Linear s tati onary (LS ) signal, b) linear non-stati onary (L NS) signal, c) nonlinear stationary (NLS) signal and d) nonlinear non-stationary (NLNS) signal. and non-station ary). The linear time series were gen erated by the following AR(2) proce ss [5] x ( n ) = a 1 ( n ) x ( n − 1) + a 2 x ( n − 2) + η . (1) Where a 1 ( n ) = 2 cos (2 π /T ( n )) e ( − 1 /τ ) , a 2 = e ( − 2 /τ ) , T ( n ) = T e + M T sin (2 π t/T mod ) , η ∼ N (0 , 1) . (2) T o generate a linear stationary sign al we used T e = 10 , T mod = 250 , τ = 50 and M T = 0 , for the lin ear non-station ary signal we used M T = 6 . The nonline ar time series were generated by the following nonlinear pro cess [ 17] x ( n ) = a 1 ( n ) x ( n − 1)(1 − x 2 ( n − 1 )) e ( − x 2 ( n − 1)) + a 2 x ( n − 2) . (3) For the n onlinear station ary signal we used a 1 ( n ) = 3 . 4 an d a 2 = 0 . 8 . For the no nlinear non-station ary signal we u sed a 1 ( n ) = ( 3 . 0 if 0 < n ≤ N/ 2 , 3 . 4 if N / 2 < n ≤ N . An examp le of each of these signals is shown in Fig. 2 with N = 20 48 . 2) Physio logical time series: The HR V time series of healthy subjects were extracted from the MIT -BIH Normal Sinus Rhythm Database in Phy sionet [18], [19] acc ording to annotation s f or only nor mal b eats. Samp le rate was 128 Hz in 24-hr Holter reco rdings. B. Pr o posed pr o cedure It is widely accepted that m ost bio medical systems are dynamic and prod uce nonstationary signals [20]; the presence of slow varying trends is only one type o f nonstationar ities present in physiolo gical sig nals. So, th e novelty of the present docume nt is to prop ose a method ology based on the T FTS d ata meth od (which from now on will be called band-p hase-rand omized surro gate data method ) that allo ws us to assess no nlinearity in da ta with different kinds of nonstationa rities (e.g., spikes, ab rupt chang es in the dyn amical behavior). The p roposed proce dure is de picted in Fig 3. T ime Serie s f c = f c min Generate and ensemble of Band-pha se-random ized surrogates Are linear correlation s of data present in surrogates? Use th e selected statistic to per form a no nlinear test and store th e results. Increase f c f c ≤ f c max End YES NO YES NO Fig. 3. Proposed m ethodol ogy to assess nonl inearit y in non-stationary time series. 1) Band- Phase-Ran domized Surr ogates: Band-pha se-random ized surrogate data metho d is, as mentioned , a m odification of the RP algorith m in wh ich n ot all phases b ut a portion of the p hases in the high-freq uency band are ran domized. Unfortu nately , as stated by [10] it is difficult to a utomate the proced ure in order to make it applicable to all time series. The methodo logy propo sed in [9] to find de cor rect value o f f c (i.e., the cor rect portion in the frequency band in which the phases are to be randomized ) is only useful wh en data have a slow v aryin g trend, be cause when this statement is not true, th e stoping criterium is never met (i.e., AC ( τ = 1 ) of data falls outside the d istribution of sur rogates ) and so one always end s u p using the iAAFT algorithm e ven wh en data is IEEE TRANSACTIONS ON BIOMEDICAL ENGINEE RING, V OL. ?, NO. ?, JANU AR Y 2011 5 not-stationar y . In [1 3], we prop ose that the stoping criter ium should be the sim ilarity between data an d surrogates, i.e., surrogates should p reserve the local behavior of the data. But, when th e data is in fact nonlinear this criterium fails. Next, we present a new method for selecting the corr ect parame ter of the alg orithm. It should b e noted th at th e use of th e end-p hase-rand omized surrogate data method will not imp rove the type II erro r because if th e method fails to reje ct the nu ll wh en all p hases are randomized (using some statistic) then it certainly will not be able to reject the nu ll wh en just a portion o f the ph ases are ran domized . On the other h and, the type I er ror will be improved by mea ns of this method . 2) P arameter selection: T o overcome the par ameter selection problem we propose not to use ju st o ne value of f c but a set of values. The pro posed methodo logy is as follows: Fir st, we select two values f c max ≈ N / 2 and f c min . W ithin this range, we select a set o f v alues fo r f c (e.g., 1 0 values), then we generate Band -Phase-Random ized Surr ogates using all those values and fin ally we perfo rm th e no nlinearity test (one must ensu re that line ar correlation s of the data ar e preserved in surrogates for those values of f c ). There are several ways to determ ine the value f c min ; if the Fourier tran sform magnitude ( S ( n ) ) h as a p ronou nced peak then, f c min is selected ab ove the peak (see Fig. 4 a) ). If S ( n ) does no t have a p ronoun ced peak ( or has several) then f c min should be selected as the lo west value for which the local mean of the da ta is pr eserved in the surrog ates (see Fig. 5); when data ha ve a p ronou nced peak, b oth criter ia result in a similar value of f c min . C. Selectio n of the discriminant statistic Dynamical m easures are often used as discrim inating statistics, the co rrelation being dimension o ne o f the most popular choices [1 6]. T o estimate these, we first n eed to reconstruc t the und erlying attracto r . For this pu rpose, a time-delay embedding reco nstruction is usually applied. But this me thod is n ot usefu l for d ata exhibiting non stationarities 10 −4 10 0 S (n) a) 1 970 −10 0 f c φ (n) b) f c = 290 Fig. 4. a) FT m agnitu de (note the logarit hmic scale) and b) FT phases as a functio n of n for LS s ignal with N = 1940 (continu os line) and one Band-Phase -Randomize surrogate f c = 291 (dott ed lin e). S ( n ) for data and surrogate s are equal for all n , but φ ( n ) is equal only for n ≤ f c . In this case we are randomizin g 70 % of the higher frequenc y domai n. In b) the dif ference between the FT phases of data and surrogates is displac ed form cero for clarity . 0 250 500 750 1.000 0 1 d) f c 0 250 500 750 1.000 0 1 c) f c 0 1 a) 0 1 b) Fig. 5. Normal ized rms dif ference between local mean (continuos line) and v ariance (dotted line) of data (a) LS signal, b) L NS signal, c) NLS signal and d) NLNS signal) and Band-Phase-Ra ndomize surrogates as a function of f c . The local m ean and varia nce was calcula ted using windo ws of length 64 with 50 % ov erlap. because at the momen t, there is no o ptimal method for embedd ing such data [2 1]. Therefo re, as d iscriminant statistics we chose the A verage Mutual Inf ormation ( I ( τ ) ) [2 1]. The I ( τ ) is a no nlinear version o f the AC ( τ ) . It can an swer the following que stion: On a verage, how m uch do es on e learn abo ut the future from the past? So , we expect that if our da ta is not just a realization of a line ar non-stationar y no isy p rocess it would have a larger I ( τ ) than that of the surr ogates. D. Implemen tation Prior to th e app lication of the m ethodolo gy , we nor malize the data to zero mean and un it variance an d fin d the largest sub-segment th at minimizes the end-point mismatch (th is step is extrem ely important and can be done autom atically as suggested in [ 4]); if th e data have a trend then one can ap ply the prepro cessing metho dology proposed in [9]. In order to r eject a null hyp othesis we generate M = 99 surrogates using an im proved Amp litude Adjusted version of the b and-ph ase-rando mized surroga te data m ethod, becau se as the I ( τ ) depends on the d ata AD , we ha ve to genera te surrogates with equal AD as th e data to avoid false rejectio ns. Then we com pute the I ( τ = 1) for the en semble of sur rogates and for th e original time series (in a previous study we showed that I ( τ ) is sensible to the type of dyna mics only fo r small lags [2 2]). If I ( τ = 1) is greater than that o f the su rrogates we reject the null hypo thesis at the 0.0 1 significance level; otherwise, we do no t r eject the null. I V . R E S U LT S A. Numerical r esults Prior to testing for no nlinearity we normalized eac h time series to zero me an and un it variance, and selected a sub segment of th e signa ls that minimized the end-po int mismatch, we end up with N= 194 0, 19 54, 1996 and 2023 number of data p oints for each time series. Fig 5 shows the normalized ro ot mean squ are (rm s) d ifference between data (a) LS sig nal, b) LNS signal, c) NLS signal IEEE TRANSACTIONS ON BIOMEDICAL ENGINEE RING, V OL. ?, NO. ?, JANU AR Y 2011 6 0.803 0.808 AC ( τ = 1) a) 0 1000 0.76 0.81 f c I( τ = 1) b) 0.628 0.634 c) 0 1000 0.35 0.6 f c d) 0.234 0.239 e) 0 1000 0 1.2 f c f) −0.139 −0.135 g) 0 1000 0 0,8 f c h) Fig. 6. (Color onli ne) a), c), e) and g) AC ( τ = 1 )of the origi nal time series (a),b) LS signal, c),d) LNS signal, e),f) NLS signal and g),h) NLNS signal) (contin uos vertica l line) and AC ( τ = 1 ) of an ensemble Band-Phase- Randomize surrogate s (5th, 50th and 95th percentil es) as a function of f c ( f c = 0 is the result of using the iAAFT algorithm). b), d), f) and h) the same as abo ve but using the I ( τ = 1) . and d) NLNS signal) and Band-Phase-Ran domized surr ogates as a functio n of f c (when f c = 0 Band-Phase- Randomized surrogates and the iAAFT surrogates are equ i valent). It can be noted that for linear d ata it is possible to ob tain surrogates with almost the same local behavior as the original time series while for n onlinear data the local variance of surrogates is never similar to the data (except for f c = N / 2 ). Th is result is expected bec ause the variance is a no nlinear statistic and surrogates a re on ly co nstrained to sample mean, sample variance AD an d AC ( τ ) of data. From Fig. 5 we notice that f c min ≈ 28 0, 400, 5 0 and 50 for ea ch time series. Anyhow , we use f c min = 0 and f c max = N / 2 − 10 for the fo llowing result. Fig. 6 shows the AC ( τ = 1 ) and I ( τ = 1 ) from data and Band -Phase-Rando mized su rrogates. It can be noted that for linear stationary da ta (fig. 6 a) and b) ) the hypothesis tested by the iAAFT algorithm canno t be rejected ( f c = 0 ) and as e xpected , ran domizing only a po rtion of the hig her frequen cy d omain, does not af fect this result. When data is nonlinear (statio nary or not) the test rejects the null h ypothesis of line arity for all v alues of f c within th e selected range of values. As shown in fig . 6 g), AC ( τ = 1) o f data is n ot similar to tha t of surrog ates fo r some values of f c , this imp lies that linear correlations of the d ata are not well preserved in the surrogates and o ne should not p erform the no nlinearity test f or these values of f c . In spite of this, the hypoth esis is rejected . The most interesting case (at least for the purp ose of th e present documen t) is the linear non-stationary case; in this situation nonlinear ity is detec ted using the iAAFT algo rithm (fig. 6 d), f c = 0 ), so a careless application of the linear surrogate data meth od would result in a false detection of nonlinear ity (ty pe I error ). But, as sho wn in fig. 6 d ), the nonlinear ity is detected only for c ertain values o f f c , in th is case when f c > 500 nonlinea rity is no long er detected by the test (the sam e cur ve as fig . 6 d ), is obtained wh en the value of M T in (2) is slightly modified , the r ange of values o f f c for which the n ull is rejected vary with M T ). T w o oth er important aspects can b e noticed in Fig. 6, first, it is r emarkable that whe n loca l mean an d variance of surr ogates are similar to data, AC ( τ = 1) of ensemb le of surro gates is almost the same as d ata, this can be seen in Fig. 6 a) and c) for f c > 300 and f c > 500 respectively (compare this with the results shown in Fig. 5 a) and b)), but the same results are not observed whe n local variance of surro gates is n ot similar to data (although th e loca l mean of surrogates is similar to data), this can be seen in Fig. 6 e) an d g ) resp ecti vely (compar e this with th e results shown in fig. 5 c) and d)). Second, besides dif ferentiatin g between linear and nonlin ear time series (stationary o r not), th is test can be used to d iscriminate between linear stationary and linear no n-stationary data, in the former case the hypoth esis of linearity will b e accepted for all values o f f c , while in the latter this will occu r o nly for certain values o f f c (as shown in Fig. 6 d)) . T o test the robustness of the meth od we per formed the same analysis p resented here add ing a 5 dB white no ise to each time series and fo und similar results. B. Applica tion to H RV signa ls Despite the fact that n onlinear dynamics are in volved in the genesis o f HR V a s a result of the inter actions am ong hemody namic, electro physiolog ical, and h umoral variables [23], there is no p roof th at the record ed HR V tim e series (usually derived f rom an ECG) reflects this no nlinearity , this must be p roven in each case. In this section, we app ly the propo sed meth odolog y to assess no nlinearity in HR V which are known to have spik es an d nonstationar ities due to variation of the pa tient acti vity (see Fig. 7 a). Fig. 7 a), shows a 1 hour record o f the HR V of a healthy IEEE TRANSACTIONS ON BIOMEDICAL ENGINEE RING, V OL. ?, NO. ?, JANU AR Y 2011 7 32 year old m ale, the starting time is about midnigh t and th e patient is at rest. Fig 7 b), dep icted o ne surrogate time series generated using th e classical meth od (iAAFT surro gates), while surro gates presented in Fig 7 c), wher e g enerated using the band-p hase-rand omized surro gate data method with f c = 360 . The original time ser ies has mu ch of its energy concen trated in the h igh frequen cy comp onents, and as in th e iAAFT surrogates the h igh frequency energy o f the orig inal tim e series is blur red in all the f requency spectr um, o ne g ets surrogates that are n ot simular to the HR V signal, allowing a trivial rejection of the null hypothesis. Band-phase-rand omized surrogates o vercome this problem by preserving the phases in a portion of th e frequ ency spectrum, in this way , h igh freq uency and low frequency comp onents of th e or iginal time series are preserved in surrogates, as can be seen in Fig. 7 a) and c) . Using the pro posed method ology it was fou nd that f c min = 200 and f c max = 2 300 , with this info rmation, Fig. 8 was generated . As expected, the null tested b y the iAAFT surrogates is rejected ( f c = 0 ), but as seen in Fig. 6 d) , this is not an indicator of nonlin earity , b ut of nonlin earity or no nstationarity , and as in this case it is ac knowledge that the test ed signal is nonstatioana ry , this test is not giving any new infor mation about this signal. But the proposed methodolo gy is; it can be noticed that whe n f c is within the selected r ange, the null hypoth esis is always rejected (and the linear corre lations of the original tim e series are always pr eserved in surr ogates), and as was already noticed (Fig. 6 f) and h)), this is a clear indicator of the presence of non linear co rrelations. By th is means, w e confirm that there is a comp lex n onlinear physiological process underly ing the HR V . V . C O N C L U S I O N In this d ocument, we presented a meth odolog y based on the T FTS data m ethod and th e iAAFT alg orithm that allows us a ssess non linearity in non-stationar y time series. Based on some simulated data we d emonstrate that our methodo logy is ab le to differentiate be tween linear stationary , linear no n-stationary (even when the linear data is tr ansformed −5 0 5 a) HRV (ms) −5 0 5 b) HRV (ms) 0 4797 −5 0 5 c) n HRV (ms) f c =0 f c =360 n Fig. 7. a) Segment of a HR V time series of a 32 year old healthy male, b) s urrogate generated using the iAAFT algori thm, c) band-pha se-randomize d surrogate s using f c = 360 . 0,8235 0,8250 AC ( τ = 1) a) 0 500 1000 1500 2000 0.65 0.85 f c I ( τ = 1) b) Fig. 8. a) AC ( τ = 1 ), b) I ( τ = 1) for the HR V signa l and Band-Phase -Randomize surrogate s as a function of f c . by a nonlin ear monoto nic static obser vation fu nction) and nonlinear time series. T his method is different from previously propo sed n onlinearity tests because: i) we do not rando mize the phases in all th e freq uency do main but in a p ortion of the frequen cy dom ain , and ii) we do no t select a co rrect v alue of f c but a corr ect range [ f c min , f c max ] , and within this ran ge, a set of values f or the par ameter f c . Applying this test to p hysiological time series, we foun d that nonlinear correlations are present in HR V sign als of a healthy male, this confirm s that nonlinear dynamics are inv o lved in the genesis of HR V , but as men tioned, ev ery times series sho uld be tested because ther e no a priori method to determin e if a giv en signal represent the n onlinearity of the pro cess. It is worth mention ing th at as pointed ou t by m any authors ( [9], [10]), the lin ear surroga te data meth ods ar e only suitable for stochastic lik e data, and as the pr esent methodology is based on that, the same limitations ap ply . A C K N O W L E D G M E N T D. Guar´ ın was suppo rted by the UTP and COLCIENCIAS, progr am J ´ ovenes Investigador es e innovadores 2010 . E. Delgado is suppo rted by the Condonable Credits prog ram of COLCIENCIAS in Colomb ia. Additio nally , he would like to thank to the Research Cen ter of the ITM of Medell ´ ın – Colombia who suppo rted h im with the PM10 201 grant. R E F E R E N C E S [1] J. Theiler , S. Eubank, A. Longtin, B. Galdrikian, and J. D. Farmer , “T esting for nonline arity in time series: The m ethod of surrogate data, ” Physica D , vol. 58, p. 77 – 94, 1992. [2] J. T heile r and D . Prichard, “Constraine d-reali zation m onte-c arlo method for hypothesi s testing, ” Physica D , vol. 94, no. 4, pp. 221 – 235, 1996. [3] D. T . Kaplan, F ro ntiers of blood pr essur e and heart ra te analysis . Amsterdam: IOS Press, 1997, vol. 35, ch. Nonlineari ty and Nonstati onarity : The use of surrogate data in interpreti ng fluctuations, pp. 15 – 28. [4] T . Schreiber and A. Schmitz, “Surrogate time series, ” Physica D , vol. 142, pp. 346–382, 2000. [5] J. Timmer , “Po wer of surrogate data testing with respect to nonstati onarity , ” Physical Revie w E , vol. 58, no. 4, pp. 5153 – 5156, 1998. [6] T . Schreiber , “Constrai ned randomiz ation of time series data, ” Physical Revie w Letter s , vol. 80, no. 10, pp. 2015 – 2018, 1998. [7] A. Schmitz and T . Schreiber , “Surrogate data for non-stationary signals, ” in W orkshop on Chaos in Brain? , K. Lehnertz, J. Arnhold, P . Grassberger , and C. E . Elger , E ds. Singapo re: W orld Scientific, 1999, p. 222–225. IEEE TRANSACTIONS ON BIOMEDICAL ENGINEE RING, V OL. ?, NO. ?, JANU AR Y 2011 8 [8] T . Nakamura and M. Small, “Small -shuf fle surrogate data: T esting for dynamics in fluctuat ing data with trends, ” Physical Revie w E , vol. 72, pp. 056 216–1 – 056 216–6, 2005. [9] T . Nakamura, M. Small, and Y . Hira ta, “T esting for nonlineari ty in irre gular fluctuat ions with long-term trends, ” P hysical Revie w E , vol. 74, pp. 026 205–1 – 026 205–8, 2006. [10] J. Theiler , P . S. L insay , and D. M. Rubin, “Detecting nonlinearit y in data with long cohe rence times, ” in Predi cting the futur e and understa nding the past . Addison-W esley , 1993, pp. 429–455. [11] L. Fae s, H. Zhao, K. H. Chon, and G. Nollo, “Time-v arying surrogate data to assess nonl inearit y in nonstation ary time series: Applica tion to heart rate v ariabili ty , ” IEEE T rans. on Biomedica l E nginee ring , vol. 56, no. 3, pp. 685 – 695, 2009. [12] C. J. Ke ylock, “ A wav elet-b ased method for surrogate data generation, ” Physica D , vol. 225, p. 219–2 28, 2007. [13] D. Guar ´ ın, A. Orozco, E. Delgado, and E. G uijar ro, “On detec ting determin ism and nonlinearit y in microele ctrode recording signals: Approach based on non-stationa ry surrogate data methods, ” in 32nd Annual International Confer ence of the IEEE E MBS , 2010, pp. 4032 – 4035. [14] T . Schreibe r and A. Schmitz, “Improved s urrogate data for nonlinearit y tests, ” Physical Re view Letter s , vol. 77, p. 635 – 638, 1996. [15] V . V enema, F . Ament, and C. Simmer , “ A stochast ic iterati ve ampl itude adjuste d fourier transform algori thm with improve d accurac y , ” Nonlinear Pr ocesses Geophysics , vol. 13, p. 321–328 , 2006. [16] M. Small, T . Nakamura , and X. Luo, Nonlinear P henomena Resear ch P erspect ives . Nov a S cienc e Publica tions, 2007, ch. Surrogate data methods for data tha t isn’ t linear noise, pp. 55 – 81. [17] L. Faes, H. Zhao, K. H. Chon, and G. Nollo, “ A method for the time-v arying nonline ar predict ion of complex nonstationa ry biomedical signals, ” IEEE T rans. on Biomedical E nginee ring , vol. 56, no. 2, pp. 205 – 209, 2009. [18] L. Glass, “Int roduction to controv ersial topics in nonline ar science: Is the normal heart rate chaotic? ” Chaos , vol. 19, pp. 028 501–1 – 028 501–4, 2009. [19] A. L. Goldber ger , L . A. N. Amaral, J. M. H. L. Glass, P . C. Iva nov , R. G. Mark, J. E . Mietus, G. B . Moody , C.-K. Peng, and H. E. Stanle y , “Physiobank, physiotoolkit, and physionet : Components of a ne w research resource for complex physiologic signals, ” Circ ulation , vol. 101, pp. 215 – 220, 2000. [20] R. M. Rangayyan, B iomedic a Signal Analysis , M. Akay , Ed. IE EE Press, 2002. [21] M. Small, Applied Nonlinear T ime Series Analysis - A pplicat ions in Physics, Physiology and Fina nce . W orld Scientific, 2005. [22] D. Gua r´ ın and A. Orozoco, “Pruebas de no lineali dad para series temporal es, ” Submited , 2010. [23] T . F . of The E uropean Society of Cardiology , T . N. A. S. of Pacing, and Elec trophysiol ogy , “Heart rat e va riabili ty . standards of m easuremen t, physiologi cal interpreta tion, and clinical use, ” Eur opean Heart J ournal , vol. 17, pp. 354 – 381, 1996.
Original Paper
Loading high-quality paper...
Comments & Academic Discussion
Loading comments...
Leave a Comment