Brain covariance selection: better individual functional connectivity models using population prior
Spontaneous brain activity, as observed in functional neuroimaging, has been shown to display reproducible structure that expresses brain architecture and carries markers of brain pathologies. An important view of modern neuroscience is that such lar…
Authors: Ga"el Varoquaux (LNAO, INRIA Saclay - Ile de France), Alex
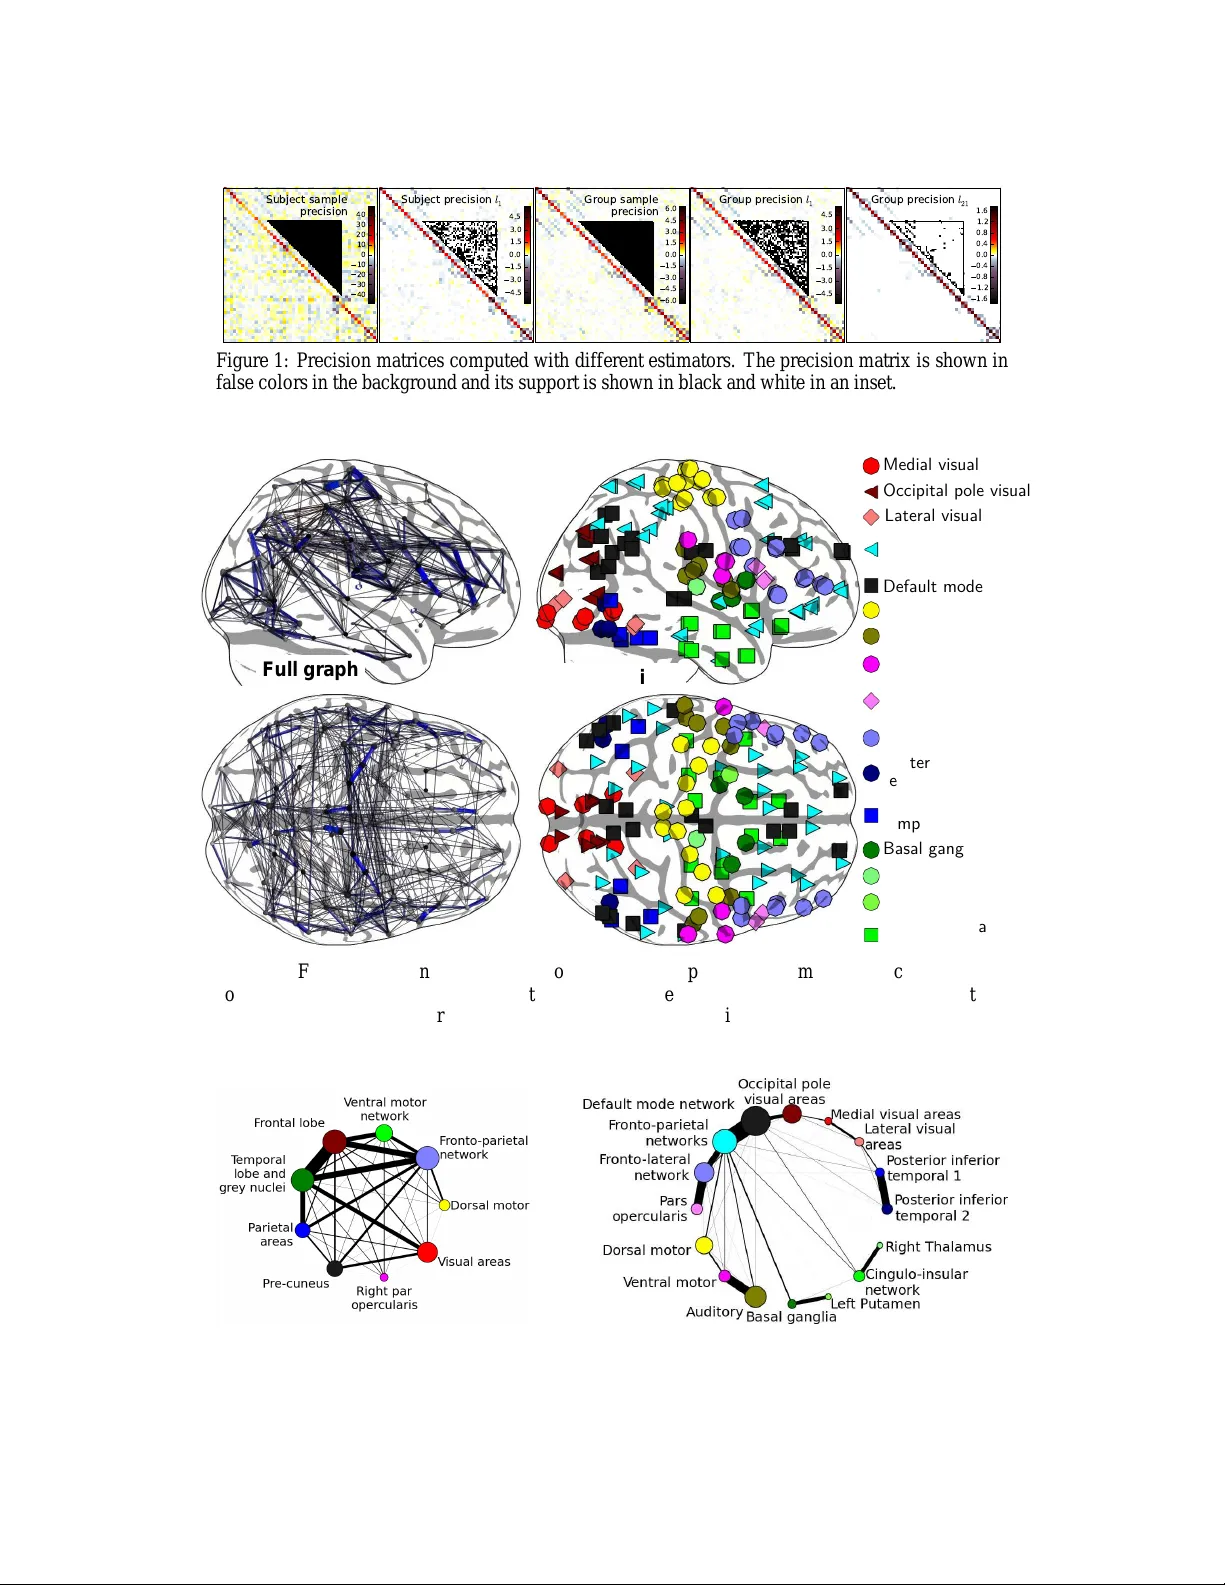
Brain covariance selection: better individual functiona l connectivity models using population prior Ga ¨ el V aroquaux ⋆ Parietal, INRIA NeuroSpin , CEA, France gael.varoqua ux@normales up.org Alexandre Gramf ort Parietal, INRIA NeuroSpin , CEA, France alexandre.gr amfort@inri a.fr Jean-Baptiste P oline LN A O, I2BM, DSV NeuroSpin , CEA, France jbpoline@cea .fr Bertrand Thirion Parietal, INRIA NeuroSpin , CEA, France bertrand.thi rion@inria. fr Abstract Spontaneo us brain activity , as observed in fun ctional neu roimagin g, has been shown to display reprod ucible structure that exp resses brain ar chitecture and car- ries markers of b rain patho logies. An importan t view of modern neu roscience is that such large-scale structu re of coh erent a ctivity reflec ts modular ity pr operties of brain connectivity g raphs. Howe ver, to d ate, th ere ha s been no de monstra- tion that th e limited and n oisy data available in spontaneo us acti v ity obser vations could be u sed to learn full-b rain probabilistic mode ls that gener alize to new data. Learning such models en tails two main c hallenges: i) m odeling full brain con - nectivity is a difficult estimatio n p roblem tha t faces the curse of dime nsionality and ii) v ariability between subjects, coupled with the v ariability of functional s ig- nals b etween expe rimental run s, m akes the use of multiple datasets challeng ing. W e descr ibe subject-level br ain function al co nnectivity stru cture as a m ultiv ari- ate Gaussian pr ocess and in troduce a n ew strate gy to estimate it fro m group data, by imp osing a common structur e on the grap hical model in the p opulatio n. W e show that individual models learn ed from fun ctional Magnetic Resonance Imag - ing (f MRI) data u sing this populatio n p rior gen eralize better to unseen data than models based on alter native regularizatio n sch emes. T o our knowledge, this is the first report of a cross-validated model of spontan eous brain activity . Finally , we use th e estimated graph ical model to explore the large-scale chara cteristics of function al architecture and show for the first time that k nown cognitiv e networks appear as the integrated communities of functional connectivity graph. 1 Intr oduction The study of brain f unctiona l conne ctivity , as r ev ealed throug h distant correlations in the signals measured by function al Magnetic Resonan ce Imag ing (fMRI) , repr esents an easily accessible, albeit indirect marker o f bra in fun ctional architectur e; in the r ecent y ears, it has given rise to fun damen- tal insights on bra in organization by represen ting it as a modular grap h with large function ally- specialized networks [1, 2, 3]. Among other f eatures, th e con cept of fun ctionally-sp ecialized cognitive network has em erged as one of the leadin g views in curr ent neuro scientific studies: region s tha t activate simultan eously , spon - ⋆ Funding from INRIA-INSERM collaboration and grant /ANR/-08-BLAN-0250-02 VIMA GINE 1 taneously or as an ev oked respo nse, f orm an in tegrated n etwork that suppo rts a specific cognitive function [1, 3]. I n p arallel, gr aph-b ased statistical a nalysis h av e shown that the graphic al m odels that naturally represent the correlation s tructure of brain signals exhibit small-w orld proper ties: any two regions o f the brain can be connec ted through fe w intermediate steps, despite the fact that most nodes ma intain only a few direct conn ections [4, 2]. These experim ental results are con sistent with the view that the local neu ronal sy stems in the brain group togeth er to form large-scale d istributed networks [ 5]. However , the link between large-scale n etworks co rrespon ding to a kn own cognitive function and segregation in to function al co nnectivity su bgraph s has never be en established. At th e individual level, the d ifferent b rain fun ctional networks are attractive as their coh erence, as manifested i n their corre lation structure, appears imp acted b y br ain pathologies, such as schizop hre- nia [6], neurodegenerative diseases –e.g. Alzh eimer’ s disease–[7, 8], or in the study of brain lesi ons [9]. Fro m the clinical stand point, there is a strong interest in spontaneo us-activity data to stud y and diagnose brain patholog ies because th ey can be recorded e ven on sev erely impaired subjects [10]. FMRI is the tool of cho ice to study large-scale function al connectivity , as it relies on wide ex- pertise gained throug h decades of br ain mappin g, an d MRI scanners are widely available in brain research institutes an d hospitals. Howe ver ne ural activity is ob served in fMRI indirectly , at a limited spatiotempo ral resolution ( (3 mm ) 3 × 3 s typically), and is confound ed b y measurement and physio- logical no ise (cardiac and respiratory cycles, motion ). For clinical applicatio ns as well a s infer ence of brain fun damental arch itecture, the qu antitative char acterization of spon taneous activity has to rely on a pro babilistic model o f the sign al. Th e question o f the robustness of covariance estimation proced ures to o bservation n oise as well as in ter-indi vidual variability is thu s fun damental, and has not been addressed so far . The focu s o f this work is the estimation of a large-scale Gaussian mode l to giv e a pro babilistic description of brain func tional signals. The difficulties are two-fold : on the o ne hand, there is a shortage of data to learn a good covariance mo del fr om an individual subject, and on th e othe r hand, subjec t-to-subject variability poses a seriou s ch allenge to th e use of m ulti-subject data: this concern s the cr eation of popu lation-level co nnectivity templates, the estimation o f th e n ormal vari- ability around this template, and t he assessment of non-norm al variability . In this paper , we provide evidence that optimal regularizatio n schemes can be used in the covariance estima tion pr oblem, making it possible to pull d ata f rom se veral sub jects. W e show that the resulting covariance model yields easily interpre table structures, and in particu lar we pr ovide the first experimen tal e vidence tha t the function ally integrated com munities o f brain connectivity graph s corre spond to known cog nitiv e networks. T o our knowledge, this is th e first experimen t that assesses quantitatively th e good ness of fit o f a f ull-brain f unctiona l connectivity model to n ew data. For this pur pose, we introdu ce an unbiased cross-validation s cheme that tests the gene ralization po wer of the inferred model. Although th e pro posed framework shar es with so-called effecti ve co nnectivity mod els (SEM [11], DCM [1 2]) the formu lation in terms of g raphical model, it is fun damentally different in that these approa ches ar e design ed to test the coefficients of (small) graph ical models in a hypo thesis-driven framework, while ou r appro ach addr esses the constru ction o f large-scale m odel of b rain conn ectivity that migh t be valid at the po pulation level, an d is com pletely data-d riven. [13] have applied with success a similar framework to mo deling task-driven brain activity . The lay out o f the paper is the fo llowing. W e first formu late the problem o f estimating a high- dimensiona l Gaussian graph ical mo del from m ulti-subject data. Secon d, we detail h ow we extract activity time-series for various brain regions from fMRI data. T hen, we c ompare the gen eralization perfor mance of different estimator s ba sed on various r egularization pr ocedur es. F inally , we stud y the graph commu nities of the learnt conn ectivity model as well as the in tegration and segregation processes between th ese c ommun ities. The pre sent work opens the way to a sy stematic use of Gaussian graphical Models for the analysis of functio nal connecti vity data. 2 Theor etical background : estimating Gaussian graphical models From a statistical estimation standpoin t, the ch allenge to address is to estimate a covariance or a correlation matrix giving a goo d description of the brain activ ation data. W e choose to use th e framework of Gaussian mode ls as th ese are the pr ocesses with the minimum inf ormation –i.e. the maximum entropy– giv en a covariance m atrix. 2 Covariance selection procedures Let u s consider a dataset X ∈ R n × p with p variables an d n samples, mo deled as centered mu lti variate Gau ssian process. Estimating its covariance matrix is a difficult statistical prob lem for two reasons. First, to specify a valid multivariate Gaussian m odel, this covariance has to b e positive defin ite. Second, if n < 1 2 p ( p + 1) , as this is the case in o ur problem , th e num ber of unkn own parameter s is greater than the nu mber of samples. As a re sult, the eigenstru cture o f the samp le covariance matrix carries a large estimation error . T o overcome these challenges, Demp ster [14] pro posed covariance selectio n: lear ning or setting con ditional in- depend ence between variables improves the con ditioning o f the prob lem. In mu lti variate Gaussian models, con ditional ind epend ence between variables is given by the zeros in the precision (inverse covariance) matrix K . Cov ariance selection can thus be achieved by imposing a sparse support for the estimated p recision matrix, i.e., a small number of no n-zero coefficients. In terms of g raphical models, this procedu re amounts to limiting the number of edges. Selecting the non -zero co efficients to op timize the lik elihood o f the m odel giv en th e data is a d ifficult combinato rial optimizatio n pr oblem. It is NP hard in the nu mber of e dges. In ord er to ta ckle this p roblem with more than tens of variables, it can be relaxed into a conve x p roblem using a penalization based on the ℓ 1 norm of th e p recision matrix, that is kn own to promo te sparsity on th e estimates [15]. The optimization proble m is given by : ˆ K ℓ 1 = argmin K ≻ 0 tr ( K ˆ Σ sample ) − lo g det K + λ k K k 1 , (1) where ˆ Σ sample = 1 n X T X is the sample covariance matrix , and k · k 1 is the element-wise ℓ 1 norm of the off-diago nal c oefficients in th e matrix. Op timal solution s to this pro blem ca n be comp uted very efficiently in O p 3 time [15, 16, 17]. Note that this formu lation of the pro blem amou nts to the compu tation of a maximum a posteriori (MAP) with an i.i.d . Laplace p rior on the off-diagonal coefficients o f the precision matrix. Imposing a common sparsity structure In the a pplication targeted b y this contribution, the pro b- lem is to estimate the precision matrices in a group o f subjects among which one ca n assume that all the individual pr ecision matrices share th e same structur e of c ondition al ind ependen ce, i.e., the zeros in the dif ferent p recision matrices should b e at the same positions. This amoun ts to a joint prior th at can also l ead to the computatio n of a MA P . T o achie ve th e estimation with the latter co nstraint, a nat- ural solution co nsists in estimating a ll matrices jointly . Following the idea of joint f eature selection using the g roup- Lasso for regression p roblem s [18], the solu tion w e pr opose co nsists in pen alizing precisions u sing a mixed no rm ℓ 21 . Let us den ote K ( s ) the pr ecision fo r subject s in a pop ulation of S subjects. The pen alty can be written as P i 6 = j q P S s =1 ( K ( s ) ij ) 2 = P i 6 = j k K ( · ) ij k 2 . This leads to the minimization problem : ˆ K ( s ) ℓ 21 s =1 ..S = argmin K ( s ) ≻ 0 S X s =1 tr ( K ( s ) ˆ Σ ( s ) sample ) − lo g det K ( s ) + λ X i 6 = j k K ( · ) ij k 2 (2) One can notice then that in the special case where S = 1 , (2) is equivalent to (1). By usin g such a penalization , a group of co efficients { ˆ K ( s ) ij , s = 1 , . . . , S } are either jointly s et to zero or are jointly non-ze ro [1 8], th us o ne enforc es the pr ecisions matrices to have a com mon sparse suppo rt for all subjects. T o our kno wledge, two other r ecent contributions a ddress the pr oblem of jointly estimating multiple graphica l m odels [19, 20]. While the approach of [19] is different from (2) an d does not correspond to a g roup- Lasso form ulation, [20] mentions th e problem (2). Compared to this prio r work , the optimization strategy we introdu ce largely differs, but also the ap plication an d the validation setting s. Indeed , we are not interested in detecting the presenc e or the absence of edges on a comm on graph, but in improvin g t he estimation of a probab ilistic model of the individual data. Also, the p rocedu re to set regu larization parameter λ is done by e valuating the likelihood of unseen d ata in a principled nested cross-validation s etting. In order to minimize (2), we modified the SPICE algorithm [21] that consists in upp er bounding the non-d ifferentiable ab solute v alues appearing in the ℓ 1 norm with a quadratic differentiable function. When using a gr oup-L asso penalty , similarly the no n-differentiable ℓ 2 norms appe aring in th e ℓ 21 penalty can be upper boun ded. The compu tational co mplexity of an iter ation that updates all coeffi- cients on ce is now in O S p 3 : it scales linearly with th e numb er of models to estimate. Following 3 the derivation fro m [ 16], th e iter ativ e op timization p rocedu re is stopped using a c ondition o n the optimality of the solutio n using a con trol on the duality gap . Global optimality of th e estimated solution is made possible by the conv exity of the prob lem (2). Alternatively , a p enalization b ased o n a sq uared ℓ 2 norm h as been in vestigated. It co nsists in r egu- larizing the estimate of the precision m atrix by adding a diagon al matrix to the sam ple covariance before compu ting its inv erse. It amounts to an ℓ 2 shrinkage b y penalizing unifo rmly o ff-diagonal terms: ˆ K ℓ 2 = ( ˆ Σ sample + λ I ) − 1 (3) Although the penalization par ameter λ for this shrin kage can b e chosen by cross-validation, Ledoit and W o lf [22] have in troduce d a closed f ormula that leads to a good ch oice in p ractice. Unlike ℓ 1 penalization , ℓ 2 downplays uniformly connections between v ariables, and is thus of less interest for the study of brain structure. It is presented mainly for comp arison purposes. 3 Pr obing brain functional covariance with fMRI Inter -individual variability o f resting-sta te fMRI W e are interested in modelin g spontaneo us brain activity , also called resting state data, recor ded with fMRI. Alth ough su ch d ata require c omplex strategies to provid e quantitative informatio n on b rain func tion, th ey are kn own to reveal in trinsic features of brain function al anatomy , such as cognitive networks [1, 23, 3] or connectivity topology [4, 2]. A well-k nown challenge with br ain imagin g data is that n o two b rains are alike. An atomical cor re- sponden ce between subjects is usually achieved by estimating and applying a deformation field that maps the different an atomies to a comm on template. In additio n to an atomical variability , within a p opulatio n o f subjec ts, cognitive network s m ay re cruit slightly different r egions. Our estima- tion strategy is based on th e hypo thesis that although the strength of cor relation between conn ected brain region may vary acr oss sub jects, ma ny of th e cond itional ind epende nce rela tionship will be preserved, as they re flect the structural wiring. The data at hand: multi-subject brain activation time series 20 healthy subjects were scanned twice in a resting task, eyes closed, resulting in a set of 244 brain volumes per s ession acquired with a r epetition time o f 2.4 s. As in [8], afte r stan dard neuroim aging p re-pr ocessing, w e extract brain fMRI tim e series and av erage them based on an atlas that subd ivides the gr ay matter tissues into standard regions. W e h av e foun d that th e cho ice o f the atlas used to extract time-series is crucial. Depending o n whether the atlas oversegments brain lobes into regions smaller than sub ject-to-sub ject an atomical variability or captures this variability , cross-validation scores vary significantly . Unlike pr evious studies [4, 8 ], we choose to rely on an inter-subject probab ilistic atlas of anato mical structures. For cortical structures, we u se the prior probability of cortical folds in template space 1 used in Bayesian sulci labeling an d norma lization o f the cortical surface [24]. This atlas cov ers 122 landmarks s pread throug hout the whole cortex and matches naturally their anatomica l v ar iability in terms of p osition, shape, and sp read. It has b een shown to be a go od sup port to d efine region s of interest fo r fMRI studies [25]. For sub- cortical structures, su ch as gray nu clei, we u se the Harvard-Ox ford sub-cortical probab ilistic atlas, as shipped by the FSL software p ackage. The u nion of both atlases forms an inter-subject probabilistic atlas for 137 anato mically-defin ed regions. As we are interested in mod eling only gr ay-matter correlations, we r egress out confoun d effects ob- tained by extracting signals in d ifferent white matter and cortico- spinal fluid (CSF) regions, as well as the rig id-bod y motion time courses estimated durin g data pre-p rocessing. W e u se the SPM soft- ware t o deri ve voxel-le vel tissue probab ility of gray matter , white matter, and CSF f rom the anatom- ical images of each sub ject. T issue-spe cific time series for either conf ound sign als o r grey-matter signals are obtained by m ultiplying the subject-specific tissue pro bability ma ps with the pr obabilistic atlas. Finally , as the fM RI signals contr ibuting to function al con nectivity hav e be en foun d to lie in frequen- cies below 0.1 Hz [26], we apply temporal lo w- pass filtering to the extracted tim e series. W e set th e 1 The corresponding atlas can be download ed on http://ln ao.lixium.fr/ spip.php?arti cle=229 4 cut-off frequ ency of the filter u sing cross-validation with th e Led oit-W olf ℓ 2 -shrinkag e estimator . W e find an optima l choice of 0.3 Hz. Also, we rem ove r esidual linear tren ds due to instru ment bias or residual mov ement signal and normalize th e variance of the resulting time serie s. The cov ariance matrices that we study thus correspo nd to correlation s. 4 Learn ing a better model for a subj ect’ s spontaneous activity Model-selection settings Given a su bject’ s resting-state fMRI dataset, our goal is to e stimate the best multiv ariate no rmal mo del d escribing this subject’ s fun ctional co nnectivity . For this, we learn the m odel using the d ata f rom on e session, and measure the likelihoo d of th e seco nd session’ s data from the same sub ject. W e use th is two-fold cross-validation pro cedure to tune the r egularization parameters. In addition, we can use the d ata o f the rem aining subjects a s a ref erence p opulatio n during the training proced ure to inform the model for the singled-ou t su bject. Generalizatio n performance for different estimation str ategies W e co mpare different estima- tion strategies. First, we learn th e mode l using o nly the subject’ s d ata. W e co mpare the sample correlation matrix, as well as the Ledo it-W olf, ℓ 2 and ℓ 1 -penalized estimators. Seco nd, we use the combined d ata of the subject’ s trainin g session as well as th e p opulatio n, using the same estima- tors: we concaten ate the data o f the p opulation and of the train session to estimate th e covariance. Finally , we use the ℓ 21 -penalized estimator in Eq.( 2), to learn different precisions for each subject, with a common sparse structure. As th is estimation strategy yields a dif f erent correlation matrix for each subject, we use the precision cor respond ing to the singled -out subject to test –i.e. comp ute the Gaussian log-likelihood of– the data of the left out session. The cro ss-validation results (averaged across 2 0 subjects) are reported in T able 1. In add ition, an example of estimated prec ision matr ices can be seen in Figure 1. W e find tha t, d ue to the insu fficient number o f sam ples in on e session, the subject’ s sample precision matrix perfor ms p oorly . ℓ 2 pe- nalization gives a go od conditionin g and better pe rforma nces, but is outp erform ed by ℓ 1 penalized estimator that yields a sparsity stru cture expressing condition al ind ependen ces between regions. On the o ther hand, the pop ulation’ s sam ple p recision is well-co nditioned d ue to the high number of samples at th e g roup level and generalizes much better than the subject-level samp le precision or the correspo nding ℓ 2 -penalized estimate. Penalizing the popu lation-level covariance matrix d oes n ot giv e a significan t p erform ance gain. In particu lar , th e ℓ 1 -penalized subject-level p recision m atrix outperf orms the precision matrices l earned from the group ( p < 10 − 5 ). W e conclud e fro m these cross-validation results that the gener alization power of th e mod els esti- mated f rom the pop ulation data ar e not limited by the number of samples but because th ey do not reflect the sub ject’ s singu larities. On the o ther hand , the estimation of a model solely f rom the subject’ s data is limited by estimatio n error . W e find that the ℓ 21 -penalized estimator strikes a co m- promise and generalizes significantly better than the other app roaches ( p < 1 0 − 10 ). Althou gh each individual dataset is different an d generalizatio n scores vary from subjec t to subject, comp ared to the second-b est perform ing estimator the ℓ 21 -penalized estima tor gives a n et gain for each sub ject of at least 1.7 in the likelihood of unseen data. Graphs estimated As can be seen from Figure 1, precision matrices corre spondin g to models that do not genera lize well display a lo t of backg round noise whereas in m odels that g eneralize well, a spa rse structur e stands ou t. Altho ugh an ℓ 1 penalization is sparsity ind ucing, th e optima l grap hs estimated with such estimators ar e n ot very spar se (see table 1 ): a filling factor of 50% amo unts to 5 000 edges. As a result, the co rrespon ding g raphs are not in terpretable without thresholdin g Using subject data Uniform group model MLE L W ℓ 2 ℓ 1 MLE L W ℓ 2 ℓ 1 ℓ 21 Generalization likelihoo d -57.1 33.1 38.8 43.0 40.6 41.5 41.6 41.8 45.6 Filling factor 100% 100% 100% 45% 1 00% 100% 100% 6 0% 8% Number of communities 6 5 5 9 9 8 7 9 16 Modularity .07 .07 .12 .25 .23 .23 .18 .32 .60 T able 1 : Summary statistics for different estimation strategies. MLE is the Max imum Likelihood Estimate, in other words, the sample precision matrix. L W is the Ledoit- W olf estimate. 5 (correspo nding visualization are given in the sup plementa ry materials). T o inter pret den se br ain connectivity gr aphs, pr evious work r elied on extractin g a conn ectivity backbon e using a max imal spanning tree [27], or graph statistics on threshold ed adjacency matrices [2]. On the opposite, the ℓ 21 -penalized graph is very sparse, with on ly 70 0 edg es. Adeq uate p enalization serves as a replaceme nt to back bone extraction; m oreover it co rrespon ds to a theor etically well- groun ded an d accu rate mo del of b rain c onnectivity . After emb edding in 3D anato mical space, th e estimated graph is very symme tric (see Figu re 2 ). A thir d o f the weight o n the edges is on con - nections between a region an d the co rrespon ding one o n the op posite hemisphere. In additio n, the connectivity mod el displays strong fr onto-p arietal connectio ns, wh ile the visual system is g lobally singled out into one cluster , connec ted to the rest of the cortex mostly via the middle-tempor al area. 5 An application: graph communities to describe functional networks Even very spa rse, hig h-dimen sional function al co nnectivity graph s are hard to inter pret. Ho wever , they are deem ed o f hig h neuro scientific in terest, as their structur e can re flect fundam ental n ervous system assemb ly p rinciples. Indeed , there is evidence from the stud y of the fault-resilient structure of anatomical conn ections in th e ne rvous sy stems that ensembles o f n euron es cluster togeth er to form com munities that are specialized to a co gnitive task [5, 4, 27]. This p rocess, k nown as func- tional integratio n g oes alon g with a red uction of b etween-com munity con nections, called segrega- tion. So far , studies of full-br ain connectivity gr aphs ha ve focused on th e analysis of their statis tical proper ties, namely their small-world characteristics related to the emergence of strongly -conn ected commun ities in ne ural system. T hese p roperties can be summarized by a measure called modu- larity [4, 2 , 28]. As the o riginal measu res intro duced for integration and segregation are Gaussian entropy and mutual inform ation measure s [2 9, 3 0], the estimation o f a well-con ditioned Gau ssian graphica l mode l of the f unction al signal giv es u s an adequ ate tool to stu dy large-scale mo dularity and integratio n in the brain. A limitation of the stud ies of statistical pro perties on graphs estima ted from the d ata is that th ey ma y reflect pro perties of the estimatio n noise. Gi ven that our grap hical description gener alizes well to u nseen d ata, it should reflect the intrin sic p roperties of brain fu nc- tional co nnectivity better th an the sam ple cor relation matrices previously used [4]. I n this section, we study these proper ties on the optim al p recision matrices describing a representative ind ividual as estimated above. Finding communities to maximize modularity Graph commu nities are a c oncept originally introdu ced in s ocial networks: comm unities are grou ps of densely-connected no des with little between-g roup connectio ns. Ne wman an d Girvan [28] have in troduc ed an o bjective function Q , called mod ularity , to measure th e qua lity of a graph p artition in a comm unity structure. Cho osing the partition to optimize m odular ity is a NP-ha rd p roblem, but Smyth and White form ulate it as a graph partitionin g proble m, and give an algo rithm [31] based on a con vex appr oximation leading to spectral embed ding and k-mean s clustering . T he numb er of classes is chosen to optimize modula rity . Brain f unctional-connect ivity communities W e apply S myth and Wh ite’ s alg orithm o n the brain connectivity graph s. W e find that using the ℓ 21 -penalized precision matrices yields a h igher number of communities, and higher mod ularity values ( T able 1) then the other estimation strategies. W e dis- cuss in details the results obtained without regularization, and with the be st p erform ing regulariza- tion strategies: ℓ 1 penalization on ind ividual data, and ℓ 21 penalization . T he com munities extracted from the sample precision matrix are mostly spread throug hout the brain, while the graph estimated with ℓ 1 penalization on individual data yields commun ities centered on anatomo-f unctiona l regions such as th e v isual system (figu res in supple mentary materials). The commun ities extracted on the ℓ 21 -penalized precision exhibit fin er anatom o-fun ctional structures, but also extract some kn own function al networks th at are commo nly foun d while studyin g spon taneous a s well as task-related activity [3]. In Figu re 2, we display the resulting com munities, mak ing use, when p ossible, of th e same denominations as the functional networks descr ibed in [3]. In particular, the default mode net- work an d the fronto-p arietal n etwork are stru ctures rep roduc ibly fo und in f unctiona l-conne ctivity studies that ar e no n-trivial as they are large- scale, lo ng-distanc e, and n ot c omprised solely o f b ilat- eral regions. 6 Subject sample precision 4 0 3 0 2 0 1 0 0 1 0 2 0 3 0 4 0 S u b j e c t p r e c i si o n l 1 4 . 5 3 . 0 1 . 5 0 . 0 1 . 5 3 . 0 4 . 5 Group sample precision 6 . 0 4 . 5 3 . 0 1 . 5 0 . 0 1 . 5 3 . 0 4 . 5 6 . 0 Gr o u p p r e c i si o n l 1 4 . 5 3 . 0 1 . 5 0 . 0 1 . 5 3 . 0 4 . 5 G r o u p p r e c i si o n l 21 1 . 6 1 . 2 0 . 8 0 . 4 0 . 0 0 . 4 0 . 8 1 . 2 1 . 6 Figure 1: Precision matrices com puted with different estimators. The precision matrix is shown in false colors in the backgrou nd an d its support is sho wn in black and white in an inset. x x Full graph x x x Me d i al vi su a l x Occ i p i t a l pol e vi su a l x L ate ral vi su a l x D e f a u l t mo de x B as al gangli a x R i ght T hal a m u s x L e f t Pu tam e n x D ors al m ot or x A u ditory x V e n tral m otor x Pa rs op e rc u l ar is (B roc a ae ra) x F ron to- la tera l x f r o nto- par ie tal L e f t an d ri gh t x Poste ri or inf e ri or tem poral 2 x Poste ri or inf e ri or tem poral 1 x Cingulo-insular n e tw ork Communities Figure 2 : Func tional-con nectivity graph co mputed b y ℓ 21 -penalized estima tion an d cor respond ing commun ities. The grap h d isplayed on th e left is not thresho lded, but on the top v iew , co nnection s linking one region to its correspondin g on e on the opposite hemisphere are not displayed. ℓ 1 ℓ 21 Figure 3: Between-commu nities integratio n g raph ob tained throug h ℓ 1 - (left) and ℓ 21 -penalization (right). The size of the nod es represents in tegration within a comm unity and th e size of the e dges represents mutual in formatio n between commu nities. Region order is chosen via 1D Laplace em- bedding . T he regions co mprising the communities for the ℓ 1 -penalized gr aph are detailed in the supplemen tary materials. 7 Integration and segregat ion in the gra ph co mmunities Th ese function ally-specialized networks are thou ght to be th e expression of in tegration and segregation processes in the br ain circuits archi- tecture. W e apply the measures introduced by T ononi et al. [29] on the es timated graph s to qu antify this integration and segregation, n amely Gaussian entro py of the fun ctional networks, and mutua l informa tion. However , following [ 32], we use con ditional integration and conditional mutual infor- mation to ob tain condition al pair -wise measures, and thus a sparser grap h: for two sets of n odes S 1 and S 2 , Integration: I S 1 = 1 2 log det( K S 1 ) (4) Mutual inform ation: M S 1 ,S 2 = I S 1 ∪ S 2 − I S 1 − I S 2 , (5) where K S 1 denotes the p recision matrix restricted to the nodes in S 1 . W e use these two measures, pair-wise and within-commun ity , to create a grap h between communities. This graph reflects the l arge-scale br ain fu nction organ ization. W e compar e the graph b u ilt u sing t he ℓ 1 and ℓ 21 -penalized precisio ns (figur e 3). W e find that the fo rmer is much sparser tha n the latter , reflecting a h igher large segregation in between the comm unities estimated. Th e graph corresp ond- ing to th e ℓ 21 penalization segments th e brain in smaller com munities an d care m ust be taken in comparin g the relati ve integratio n of the different systems: f or instance the visual system ap pears as more integrate on the ℓ 1 graph, but this is becau se it is split in three on the ℓ 21 graph. Although this grap h is a very simplified view of b rain fun ctional arch itecture at rest, it displays some o f the key processing streams: starting f rom the p rimary visual system (m edial visual are as), we ca n disting uish the dorsal visual pathway , g oing thr ough the occipital pole to th e intra- parietal areas comprised in the default mode network an d the f ronto- parietal networks, as well as the ventral visual p athway , g oing th rough the later al visual a reas to th e inferior temporal lo be. The default mode and the fron to-parietal networks appear as hub s, connecting different networks with different function s, such as th e visual streams, but also the motor areas, as well as the frontal regions. 6 Conclusion W e have p resented a strategy to overcom e the challeng e of subject-to- subject variability and lea rn a deta iled mod el of an individual’ s full-b rain function al co nnectivity u sing pop ulation data. The learnt graph ical mode l is sparse an d reveals the interaction structure between fu nctional modules via cond itional independe nce relationships that generalize to new data. As far as we can tell, th is is the first time a n u nsuperv ised model of brain fu nctional con nectivity is backed b y cross-validation. Also, from a m achine learn ing persp ectiv e, this work is the first demo nstration, to o ur knowledge, of joint estimatio n o f multiple grap hical mod els in a mo del-selection setting, an d the first time it is shown to improve a prediction score for individual graphical m odels. From a neu roscience p erspective, learning high-d imensional function al conn ectivity prob abilistic models opens the door to new studies of brain architecture. In particu lar , the mod els es timated with our strategy are well suited to explo ring th e graph -commu nity structure resulting fr om the fu nc- tional integration, specializa tion, and segregation of distributed networks. Our preliminary work suggests th at a mesoscopic description of neura l ensembles via high -dimension al graphical models can establish th e link be tween the f unctiona l networks observed in br ain im aging and the funda- mental nervous-system assembly principles. Fin ally , subject-level Gau ssian probabilistic models of function al connectivity b etween a few r egions have p roved usefu l for statistically-c ontrolled in ter- individual c omparison s o n resting -state, with med ical app lications [9]. Exten ding such studies to full-brain an alysis, tha t have been so-far limited by the amoun t of data av ailable on individual sub- jects, clears the way to new in sights in brain patholog ies [6, 8]. Refer ences [1] M. Fox and M. Raichle: Spontaneous fluctuations i n brain activity obse rved with functional magnetic resonance imaging. Nat Rev Neurosci 8 (2007) 700–7 11 [2] E. Bullmore and O. S porns: Complex brain networks: graph theoretical analysis of structural and func- tional systems. Nat Rev Neurosci 10 (2009) 186–19 8 [3] S . Smith, et al. : C orresponden ce of the brain’ s functional architecture during activ ation and rest. PNAS 106 (2009) 13040 8 [4] S . Achard, et al. : A resilient, low-freque ncy , small-world human brain functional network wit h highly connected association cortical hubs. J Neurosci 26 (2006) 63 [5] O. Sporns, et al. : Organ ization, dev elopment and function of complex brain networks. Trend s in Cogni- tiv e Sciences 8 (2004) 418–4 25 [6] G. Cecchi, et al. : Discriminativ e network models of schizop hrenia. In: NIPS 22. (2009) 250–262 [7] W . Seeley , et al. : Neurodegen erativ e Diseases T arget Large-Scale Human Brain Networks. Neuron 62 (2009) 42–52 [8] S . Huang, et al. : Learning brain connecti vity of Alzheimer’ s disease from neuroimaging data. In: Adv ances in Neural Information Processing Systems 22. (2009) 808–816 [9] G. V aroquaux, et al. : Detection of brain functional-connecti vity difference in post-stroke patients using group-le vel covarian ce modeling. In: IEEE MICCAI. (2010) [10] M. Greicius: Resting-state functional connecti vity in neuropsychiatric disorders. Current opinion in neurology 21 (2008) 424 [11] A. McLntosh and F . Gonzalez-Lima: Structural equation modeling and its application to n etwork analysis in functional brain imaging. Human Brain Mapping 2 (1) (1994) 2–22 [12] J. Daunizeau, K. Friston, and S. Kiebel: V ariational Bayesian identification and prediction of stochastic nonlinear dynamic causal models. Physica D 238 (2009) [13] J. Honorio and D. Samaras: Multi-T ask Learning of Gaussian Graphical Models. In: ICML. (2010) [14] A. Dempster: Cov ariance selection. Biometrics 28 (1) (1972) 157–175 [15] O. Banerjee, et al. : Con vex optimization techniques for fi tting sparse Gaussian graphical models. In: ICML. (2006) 96 [16] J. Duchi, S. Gould, and D. K oller: Projected su bgradient methods for learning sparse g aussians. In: Proc. of the Conf. on Uncertainty in AI. (2008) [17] J. Friedman, T . Hastie, and R. Tibsh irani: Sparse in verse cova riance estimation wi th the graphical lasso. Biostatistics 9 (3) (2008) 432–44 1 [18] M. Y uan an d Y . Lin: Model selection and estimation in regression with groupe d variables. Journal-Royal Statistical Society Series B Statistical Methodology 68 (1) (2006) 49 [19] J. Guo, et al. : Joint estimation of multiple graphical models. Preprint (2009) [20] J. Chiquet, Y . Grandv alet, and C. Ambroise: Inferring multiple graphical structures. Stat and Comput (2010) [21] A. Rothman, et al. : Sparse permutation in variant cov ariance esti mation. Electron J S tat 2 (2008) 494 [22] O. Ledoit and M. W olf: A well- conditioned estimator for l arge-dimen sional cov ariance matrices. J. Multi va r . Anal. 88 (2004) 365–411 [23] C. F . Beckmann and S. M. S mith: Probabilistic indep endent component analysis for functional magnetic resonance imaging. Trans Med Im 2 3 (2) (2004) 137–152 [24] M. Perrot, et al. : Joint Bayesian Co rtical Sulci Recognition and Spatial No rmalization. In: IPMI. (2009) [25] M. Keller , et al. : Anatomically Informed Bayesian Model Selection for fMRI Group Dat a Analysis. In: MICCAI. (2009) [26] D. Cordes, et al. : Mapping functionally related regions of brain with functional connectivity MR imaging. American Journal of Neuroradiology 21 (9) (2000) 1636–1 644 [27] P . Hagmann, et al. : Mapping the structural core of human cerebral cortex. PLoS Biol 6 (7) (2008) e159 [28] M. Newman and M. Girvan: Finding and ev aluating community structure in networks. Phys rev E 69 (2004) 26113 [29] G. T ononi, O. Sporns, and G. Edelman: A measure f or brain complexity: relating functional segregation and integration in the nerv ous system. PNAS 91 (199 4) 5033 [30] O. Sporns, G. T ononi, and G. Edelman: T heoretical neuroanatomy : relating anatomical and functional connecti vity in graphs and cortical connection matrices. Cereb Cortex 10 (2000 ) 127 [31] S. White and P . Smyth: A spectral clustering approach to fi nding communities in graphs. In: 5th SIAM international conference on data mining. (2005) 274 [32] D. Coynel, et al. : Conditional integration as a way of measuring mediated interactions between l arge- scale brain network s in functional MRI. In: Proc. ISBI. (2010) 9 Supplemen tary material s x x Full graph x x Between-communities integration graph Communities Figure 4: Graph computed b y maxim um likelihood estimatio n on an individual subject’ s d ata. The graph display ed is not thresholded , b ut on the top view , connection s linking one region to its corre - sponding one on the oppo site hemisphere ar e not displayed. x x Full graph x x Communities Figure 5: Graph comp uted by ℓ 1 -penalized estimation on an ind ividual subjec t’ s data. The graph displayed is n ot thr esholded, but on the top view , connections lin king on e region to its c orrespon ding one on the oppo site hemisphere are not displayed. 10
Original Paper
Loading high-quality paper...
Comments & Academic Discussion
Loading comments...
Leave a Comment