Reflective visualization and verbalization of unconscious preference
A new method is presented, that can help a person become aware of his or her unconscious preferences, and convey them to others in the form of verbal explanation. The method combines the concepts of reflection, visualization, and verbalization. The m…
Authors: Yoshiharu Maeno, Yukio Ohsawa
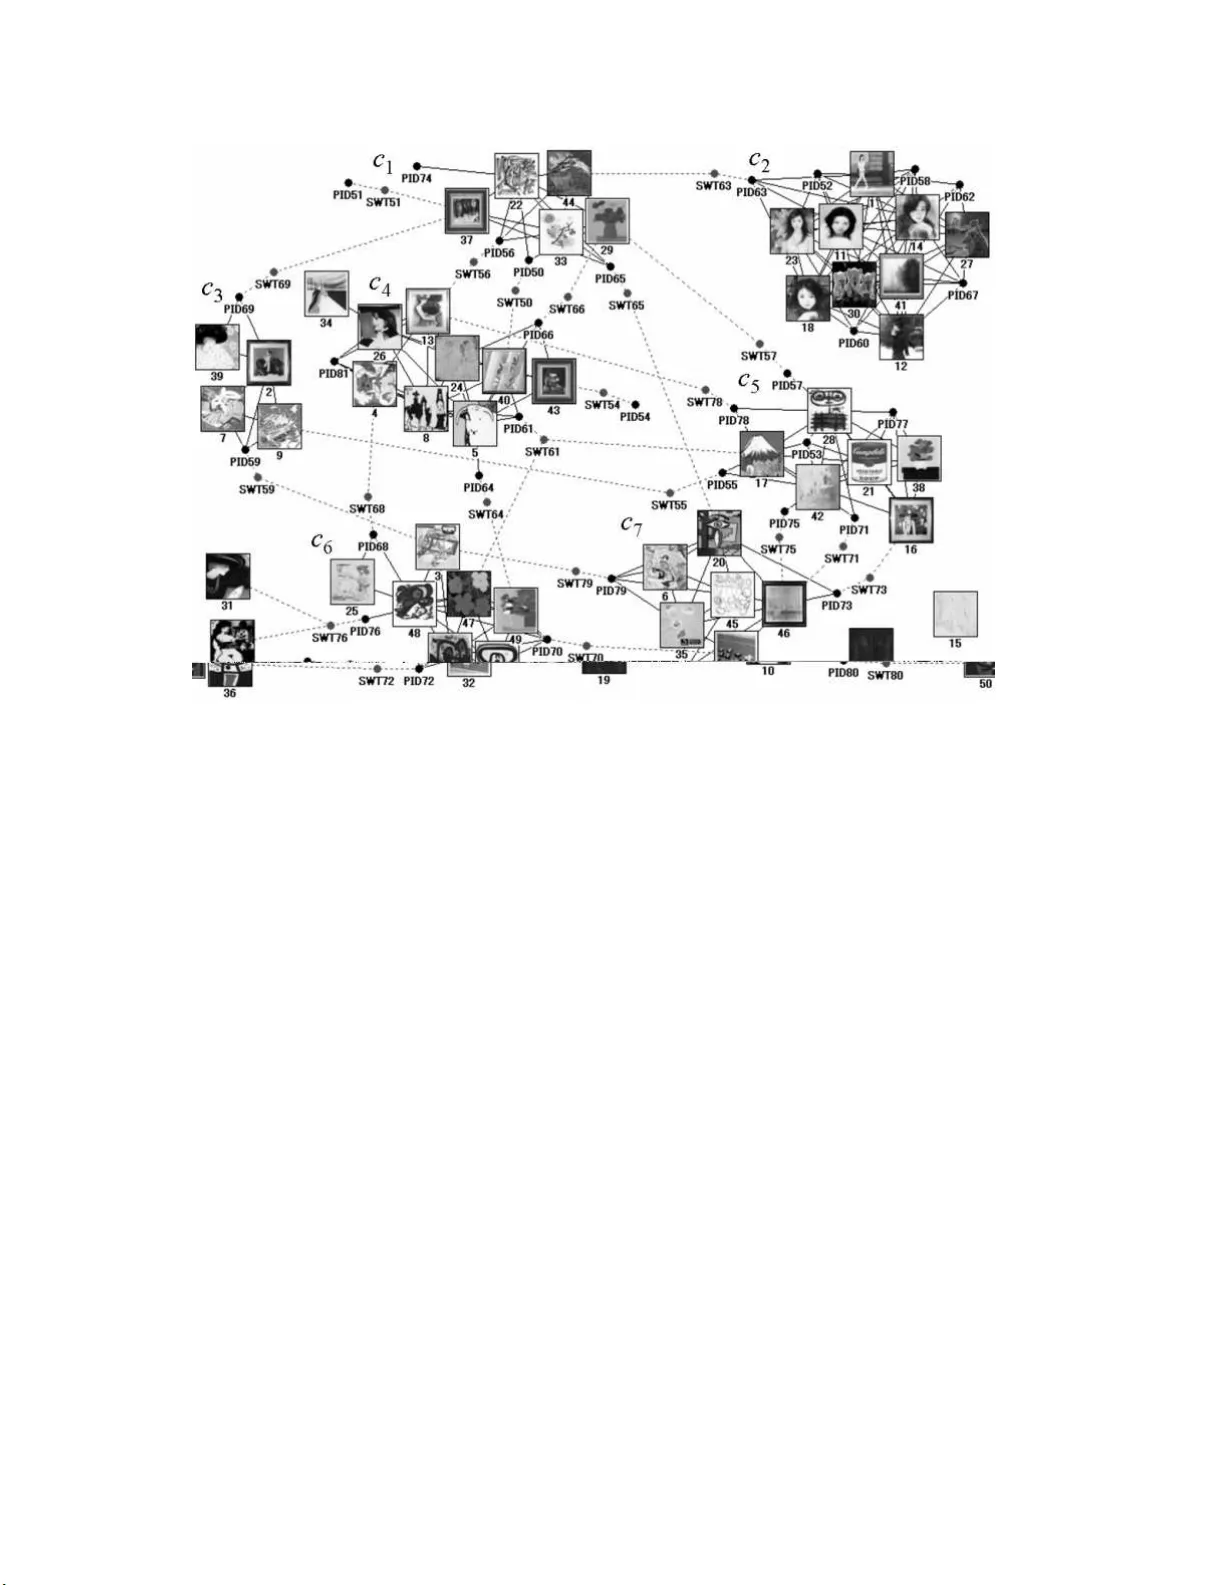
Reflectiv e visualizat ion and v erbalization of unconscio us preference Y oshiharu Maeno ∗ and Y ukio Ohsa w a † Octob er 25, 2018 Abstract A new metho d is presented, that can help a p erson b ecome aw are of his or her un conscious preferences, and conv ey them to others in the form of verbal explanation. The metho d combines the concepts of reflection, visualization, a nd v erbalizatio n. The method w as tested in an exp erimen t where t h e unconscious preferences of the sub jects for v a rious artw orks were inv estigated. In the exp eriment, tw o lessons were learned. The first is that it helps th e sub jects b ecome aw are of their un conscious preferences to verbalize w eak preferences as compared with strong preferences through discussion o ver preference diagrams. The second is that it is effective to introdu ce an adjustable factor into v isualization to adapt to the differences in the sub jects and to foster their mutual un derstanding. 1 In tro duction Every p erso n ha s unique preferences that form the ba s is of the per son’s decision-making and consequent behav- iors. How ever, when req uested to describ e the deta ils of a preference that re s ults in a b ehavior of particular int erest to others, the p erso n often fails to v erbally e xplain. The p ers on is no t aware of a ll a sp ects of the prefer - ence. By under standing suc h unconscious influences, the p ers o n’s priv ate and so cial lifestyles can be r e -designed [Maeno 2007a]. If they know the consumers’ unconscious pre fer ences, v endors can turn to new concepts, unfamil- iar pro ducts, and emerging services to reach the consumers [Zaltman 200 3]. It is therefor e important to dev elop metho ds to help a p er s on b ecome aware of his o r her unconscio us preferences a nd conv ey them to others in the form of verbal explanation. V ario us metho ds hav e b een pro po sed in marketing to help us understand and foresee individual cons umers’ behavior. Conjoint analysis is used to discov er the o ptimal combination of facto rs that customers would prefer [Green 1981]. The hierarchical Bay es mo del is employed to tr e at the different p ersona lities of individual con- sumers. This mo del is applied to the inv estigation of the non-primar y asp ects of individua l consumers’ demand [Arora 1998]. A num b er o f studies on latent class mo dels (or latent tra it mo dels) addr e ss la ten t v ariables and their statistical testing [Cheung 2 0 04], [Z hang 20 04]. These mo dels are applied to test hypotheses on the factors in the c onsumers’ pr eferences. They cannot, howev er, b e used to discover unknown factors hidden in unconscious preferences. ∗ Corresp onding author. Graduate Sc hool of Systems Management , Tsukuba Universit y , Otsuk a 3-29-1, Bunky o-ku, T oky o 112- 0012, J apan. E- m ail: maeno.y oshiharu@nifty .com. Y oshiharu Maen o receiv ed the B.S. and M.S. degrees in ph ysics from the Univ ersit y of T okyo, T okyo, Japan, and Ph.D . degree in business science fr om Tsukuba University . H e is a managemen t consultant and a founder of So cial Design Group. He is a principal r esearc her at NEC Corp oration. He seeks to in ve nt a complexit y-science-based methodology to design so cial systems and analyze so cial phenomena, aiming at solving di v erse ranges of so cial and h uman problems. His research int erests lie in understanding the stochastic temporal b ehaviors of non-linearly in teracting componen ts, the diffusi on and reaction phenomena in innov ativ e so cial organizations, and the latent dynamic structures b ehind so cial inte ractions. He is a member of the American Physical Society , the In ternational Netw ork of Social Netw ork A nalysi s, and the Institute of El ectrical and Electronic Engineers (Computer, Computat ional Int elligence, and Systems Man & Cybernetics So cieties). † Sc hool of Engineering, Universit y of T okyo , Hongo 7-3-1, Bunky o-ku, T okyo 11 3-8563, Japan. E-mail: ohsa w a@sys.t.u-tokyo.ac .jp. Y ukio Ohsa wa receiv ed the Ph.D. degree in comm unication and information engineering f rom the Universit y of T okyo, T oky o, Japan. He w as wi th the Graduate Sc hool of Business Sciences, Tsukuba University , T oky o. In 2005, he joined the Sc hool of Engineering, Unive rsity of T okyo, where he is curren tly an Associate Prof essor. He initiated the r esearc h area of c hance disco very as well as a series of int ernational meetings (conference sessions and w orkshops) on c hance disco very , e.g., the fall s ymposium of the American Asso ciation of Artificial Intelligence (2001). He co-edited b o oks on chance discov ery published by Springer-V erlag and Adv anced Kno wledge Internat ional, and also sp ecial issues of journals such as New Generation C omputing. Si nce 2003, his activity as Di rector of the Chance Discov ery Consortium Japan has linked r esearc hers in cognitiv e science, information sciences, and business sciences, and business people to c hance discov ery . It also led to the introduction of these tec hniques to researc hers in Japan, the U.S., the U.K., China, T aiwan, R.O. C., etc. 1 Reflection in cog nitiv e science [Sch¨ on 2006] and computer-media ted communication [Thurlo w 20 04] are the- oretical guides to approach unconscio us prefer ences. The abilities to r ecognize and understand oneself, dis- cov er something unexp ected, a nd cre a te something new are founded on constructive p erceptio n [Suw a 2 002], [Su wa 200 3]. Constr uctive p erception is the ability to p er ceive the v isual characteristics o f elements, the r ela- tionships b etw een the elements, and the empty relev ant spa c e b etw een the elements in diagra ms, sketc hes , o r drawings [L arkin 1987]. Visualization and verbalization play impo rtant roles in b ecoming aw a re of a pe r son’s present p erception, a nd in changing it. Perception is a pro cess used to interpret sensory signals from the outside. F or ex a mple, drawing for r e fle c tion, which rec ords a designer ’s daily intermediate outcomes , w as proven to b e an effective to ol in a univ ersity education progra m o f creativity [Ishii 2002]. A pra c tical to ol based on the theory o f constructive p er ception is nee de d, like the drawings for designers , which can help a per son’s reflective visualization and v erbalization of that p er s on’s uncons cious preferences. Metho ds of discovery in other fields ca n b e applied to the discovery o f unconscious preference. F or example, in so cial netw ork ana lysis, a heuris tic metho d was develop ed to solve a no de dis cov ery problem. Its aim is to discover an unknown relev ant per son hidden in a criminal org anization [K rebs 2002]. The p erso n is not found in the reco rds of observed actions but pla ys a r elev ant role in orga nizational communication and decisio n-making [Ma eno 2009]. The metho d is implemented a s an iterative pro ce ss where the dis c repancy b etw een prio r understanding and observ ation is indicated in the fo r m of a so cia l netw ork diagr a m [Maeno 200 7 b]. Other metho ds o f disc ov ery are link prediction [Cla uset 2008], discov e r y of hierarchies [Sales-Pardo 2 007], cluster discovery [Palla 200 5], and exploratio n of unknown structures [Newman 2007]. Incor po rating insig hts from the cognitive science s would he lp to de velop suc h a disco very pro cess for treating unco nscious pr eferences. The ob jectiv e of this pap er is to develop a metho d that can help a p erson b ecome aware of his o r her unconscious pre fer ences. The method co m bines the concepts of re flec tion, visualiza tion (with a n alg o rithm to draw the sub ject’s stated preference in a diagra m), and verbalization (through gr o up discussion). The metho d is describ ed in sec tio n 2 (with the preference diagra m in 2 .1, the visua lization algor ithm in 2.2, a nd the reflection pro cess in 2.3). The ex per iment of testing the r eflection pr o cess to investigate the unconsc io us pre fer ences o f sub jects with artw ork a nd the lessons learned from it ar e presented in section 3. 2 Metho d 2.1 Preference diagram A preference diag ram is a pra ctical to o l that can be used to promote the reflective visualiza tio n and v erbaliza tion of unco ns cious prefer ences. It also aids in efficient co mm unication and mutual understanding in g roup discuss ion. The preference diagram is a kind of undirected g raph consisting o f no des and undirected links drawn on a pla ne. A no de represents either the i -th sub ject n PID i or the j -th artw or k n j . A link repr esents either the resemblance relationship b etw een tw o artw orks or the preference relationship of a sub ject to a n artw ork. The topo logy defined by the prese nce o f links is relev ant. The p osition o f the no des a nd the distance b etw een the no des on the diagra m, how e ver, a re not relev ant. Figure 1 [a] s hows an example. The pr e fer ence dia gram is des igned so that the clus ter s tructures are clearly visible. F or an individual sub ject n PID i , four characteristic ob jects ar e selected a s attributes descr ibing the sub ject’s preferences . The ob jects are the primar y cluster c PRM ( n PID i ), the gatewa y ar tw ork in the pr imary cluster n GTW | PRM ( n PID i ), the secondary cluster c SCN ( n PID i ), and the gateway ar t work in the secondar y cluster n GTW | SCN ( n PID i ). The primary cluster represents the cluster whos e a rtw o rks are preferr ed b y a sub ject mo st strong ly . The s econdary cluster is the cluster whos e artw orks are preferr ed most weakly . The g atewa y a rtw o rk indicates a sub ject’s preferable entrance po int to the cluster. Note that the primary clus ter for a sub ject can b e the se c ondary c lus ter fo r ano ther s ub ject. The la b els for the characteristic o b jects are no t drawn o n the diagram. Ther e may b e mult iple gatewa y artw orks. The preference diagr am includes ano ther interesting ob ject. A switch ob ject n SWT i for a sub ject n PID i is inserted into the spa ce b etw een the primary and sec o ndary clusters. The switch is a s sumed to c hange the mo de of the sub ject’s prefer ence. The switch tends to p oint to the pr imary cluster most of the time, although it sometimes p oints to the s econdary cluster. The switching o ccurs either from internal ca price or from an external stimu lus such a s a tmosphere, influence from frie nds , or so cial interaction. The switch indicates the pres e nce o f an unknown facto r that pr ompts the sub jects to turn their interests toward s omething unfamilia r. This is the clue to unconscious pre ferences. Figure 1 [b] shows an example of the four characteristic ob jects and the switch ob ject for a sub ject p e rson n PID1 . 2 Figure 1: [a] Example of a preference diagram, and [b] c haracter istic ob jects (the pr imary cluster c PRM ( n PID1 ), the secondary cluster c SCN ( n PID1 ), and the gateway ar t works n GTW | PRM ( n PID1 ), n GTW | SCN ( n PID1 )), and a switch ob ject n SWT1 for a sub ject per son n PID1 . 2.2 Visualization algorithm A visualization alg orithm to generate a prefer ence dia gram fro m the information ab out a sub ject’s s ta ted pref- erence is pres e nted. The infor mation can be obta ined fro m the answers to questionnair es. It is a set of data D given by Equation (1). D = { d l } (0 ≤ l ≤ | d | − 1) . (1) An individual da tum d l represents an answer fro m a sub ject. The num b er of da ta is | d | . The answer is formatted as in Equa tion (2 ). d l = n PID i ⊕ { n j } . (2) It is a com bination of the iden tifier of the sub ject ( n PID i ) and a set of identifiers for an y num b er of artworks that the sub ject selected as prefer able ( { n j } ). W e denote such a c ombination by ⊕ . In general, a sing le sub ject may answer multiple times at different o ccasions, resulting in m ultiple data. The sub ject is, how ever, allow ed to answer only once for the purp o ses of this pap er. The num b er of data | d | is the same as the num b er of sub jects | s | . W e order the data d l in D so that the relation l = i can hold. A t first, the artw orks are g roup ed into cluster s c k . The num b er of clusters | c | is given. An individual cluster includes the artw orks which r esemble the stated pre ference. This is interpreted a s the granularity of the preference diagram. As the granularity b ecomes finer, the n um b er of clusters | c | increase s , but the n um b er of artw or ks in a cluster decreases. A clustering algorithm for discrete ob jects is applied for given | c | . The k-medoids a lgorithm is a simple example [Hastie 2001]. A medoid is an ob ject that is the closest to the cent er of g ravit y in a cluster. Its principle is similar to that of the k-means a lg orithm [Duda 2000] for contin uous numerical v a r iables wher e the center of g ravit y is up dated rep eatedly according to the exp ectation-max imization metho d [Dempster 1977]. The degree of rese mblance fo r every pair o f artw orks n i and n j is given by the Jaccard co efficient J ( n i , n j ) defined by Equation (3). J ( n i , n j ) ≡ F ( n i ∩ n j ) F ( n i ∪ n j ) . (3) 3 The J accard coefficie nt is a measure of co- o ccurrence that is emplo yed in link discov ery pr oblems, text do cu- men t analy sis, or WWW structure mining [Lib en-Now ell 2 007]. The function F ( n j ) is the o ccurre nc e freq uency at which the a rtw o rk n j app ears in D . In this pap er, it is the sa me a s the n umber o f sub jects who selected the ar t work n j as preferable. Equation (3) can b e co nv er ted in to Equa tion (4) with a Bo olea n function B ( s ) in Equation (5). B ( s ) deter mines whether the pro p osition s is true or false. J ( n i , n j ) = P | d |− 1 l =0 B ( n i ∈ d k ∧ n j ∈ d k ) P | d |− 1 l =0 B ( n i ∈ d k ∨ n j ∈ d k ) . (4) B ( s ) = 1 if s is TRUE 0 otherwise . (5) Initially , the ar tw orks are gr oup ed into clus ters at r andom. The medoids n MED ( c k ) in the cluster c k are calculated b y Equation (6). n MED ( c k ) = ar g max n j ∈ c k M ( c k , n j ) (0 ≤ k ≤ | c | − 1) . (6) The op er ator a r g in Equation (6) mea ns that the medoid is the no de n j belo nging to c k , which maximize s M ( c k , n j ). The quantit y M ( c k , n j ) in E quation (6) represents the total degree of resemblance of one artw ork n j to the other artw orks in the cluster c k . It is defined by Equation (7). M ( c k , n j ) = X n l ∈ c k n l 6 = n j J ( n l , n j ) . (7) After the medoids are determined, the artw orks are regro uped in to clusters. The cluster c ( n j ) to which an artw ork n j belo ngs is ca lculated by E quation (8). c ( n j ) = ar g max c k J ( n MED ( c k ) , n j ) . (8) The calculation of the medoids in Equation (6) and the clusters to which the artw orks b elo ng in Equation (8) is r ep e ated until they conv erge. After that, links are dr awn b etw een the no des n i and n j belo nging to a cluster, if J ( n i , n j ) > 0. These links and no des form | c | disjoint clus ter s. Any ar t work that is not selected b y any sub jects bec omes an isolated no de. After the clustering is complete, the prima ry cluster c PRM ( n PID i ), the seco ndary cluster c SCN ( n PID i ), and the gatewa y artw orks for each individual sub ject n PID i are ca lculated. The primary cluster c PRM ( n PID i ) is calc ula ted by Equation (9). c PRM ( n PID i ) = ar g max c k max n j ∈ c k W ( n PID i , n j ) . (9) The op erator arg in E quation (9) means the following. The maxima l v alue of W ( n PID i , n j ) is sear ched fo r among a ll the artw orks n j belo nging to the cluster c k . The primary cluster c PRM ( n PID i ) is the c lus ter that gives the max imal v a lue o f max W ( n PID i , n j ) among the clusters c k . W ( n PID i , n k ) in Equatio n (9) r epresents the strength of the pr eference of the sub ject n PID i to the ar tw or k n k . It is defined b y Equation (10). W ( n PID i , n j ) = P | d |− 1 l =0 B ( n j ∈ d l ∧ n PID i ∈ d l ) P | d |− 1 l =0 B ( n j ∈ d l ) . (10) The sub ject answers once, and the relatio n l = i holds in Equation (2). Equa tion (10) bec o mes simpler b ecause B ( n PID i ∈ d l ) = δ li . W ( n PID i , n j ) = B ( n j ∈ d i ) P | d |− 1 l =0 B ( n j ∈ d l ) . (11) The g atewa y artw ork in the primary cluster n GTW | PRM ( n PID i ) is calc ula ted by E quation (12). n GTW | PRM ( n PID i ) = ar g max n j ∈ c PRM ( n PID i ) W ( n PID i , n j ) . (12) 4 The op erato r arg means that n GTW | PRM (PID i ) is the artw ork that gives the maximal v a lue of W ( n PID i , n k ) among n k belo nging to the pr ima ry cluster c PRM ( n PID i ). There may b e multiple ga tewa y ar tw o r ks. Links are drawn b etw een the sub ject and the gatewa y artw orks in the primary cluster. The s e condary cluster c SCN ( n PID i ) is calc ula ted by Equation (13). c SCN ( n PID i ) = ar g min c k max n j ∈ c k W ( n PID i , n j ) . (13) It is the cluster whose artw orks are preferr ed by the sub ject mo st weakly . Alterna tively , the se c ondary cluster can b e the cluster whose a r tw o r ks are pr eferred by the sub ject most strongly after the primar y cluster. It is calculated b y Equation (14) instead of Equation (13). c SCN ( n PID i ) = ar g max c k 6 = c PRM ( n PID i ) max n j ∈ c k W ( n PID i , n j ) . (14) The g a tewa y artw ork in the seco ndary cluster n GTW | SCN ( n PID i ) is calculated by Equa tio n (15). All charac- teristic ob jects ar e determined here. n GTW | SND ( n PID i ) = ar g max n j ∈ c SND ( n PID i ) W ( n PID i , n j ) . (15) Finally , links a r e drawn b etw een the disjoin t clusters so that the switch ob ject n SWT i can connect the sub ject n PID i and the gateway artw ork in the sec ondary cluster n GTW | SND ( n PID i ), as in Figure 1 [b]. The preference diagram uses the spring mo del [F r uch terma n 19 91] as a gra ph-drawing metho d. The spring mo del conv e rts the strength of the relatio ns hip acr oss the link be t ween tw o no des into Ho oke’s co ns tant of the spring, which is placed betw een the no des ima ginarily , and calcula tes the equilibrium positio n o f the no des. 2.3 Reflection pro cess The reflection pro cess uses the pr eference diagrams to pr ompt the sub jects’ reflective visualiza tion a nd verbaliza- tion. Gr oup discussion is incorp orated in to the pro cess as a means to understand the frame of the sub jects’ own per ception. The diagra m is a ls o mean t to help create efficien t communication and mutual unders ta nding during group discussion. The sequence in the designed reflection pro ce ss is shown by Figure 2. The notations follow the UML (unified mo deling language) [UML 2.1.2] specifica tions. It defines a gr aphical language for visualizing, sp ecifying, cons tr ucting, a nd doc umen ting the artifacts of distributed ob ject systems. The time go es by from top to b ottom. The sequence consists of the pr ior, ma in, and p oster ior stage s. An or ganizer co ordina tes the pro cess. The orga niz e r uses a a ques tio nnaire to ask the sub jects eig h t questions (Q1 to Q 8). Questions Q1 to Q4 ar e essential for the s ub jects to b eco me aware o f their unconscious pr eference. The other questio ns (Q5 to Q8) are for the pur po se of ev aluating the designed r eflection proc e ss in the exp eriment. The conten t of questions Q1 to Q8 is listed in T able 1. The orga nizer generates the pr eference diagr a ms fr o m the answers to question Q1 after the pr ior stage. Gr oup discussions ar e carried out in tw o sub-stages (part 1 and part 2). This is for the purp ose of ev a luating the exp e riment. The num b er of sub- stages can b e one o r ar bitrary . In the gr oup discussions , the or ganizer asks the sub jects to discuss the preference s of themselves or the other s freely . Drawing a n y co nclusion is not requested. Questions Q2 to Q4 are the cent ral drivers in this pro cess, which promotes reflectio n. The org anizer extr acts the topics in which the sub jects express interest dur ing the group discus sions from the reco r ded proto co ls after the main stage. The pr oto cols are the verbal r ep o rts from the sub j ects. The topics are used in questions Q7 a nd Q8 in the po sterior stage. 3 Exp erimen t 3.1 Visualization The exp eriment was carried out accor ding to the reflectio n pro ces s descr ibed in 2.3. Fifty artw orks (classica l po rtraits, la ndscap es, abs tr act pa intings, mo dern po p ar t) are used in Q1 in Figure 2. Thirt y-tw o sub jects participated in the prior s tage. The co or dina tor gener ated preference diag r ams as presented in 2.2. The main stage was carried out three separ ate times, with four, tw o , and five sub j ects. It to ok six t y to ninety min utes to finish the main stage . The four diagr ams that include the cluster structures were presented in the part 1 gr oup discussio n. Finer granularity dia grams (the num b er of cluster s | c | =3, 5) and course r g ranularity dia grams ( | c | =7, 8) w ere pr esented at the same time. The sub jects could reco gnize the prima r y c lusters, compa r e the details of the dia grams, and 5 Figure 2: Sequence in the reflection pro c e s s. The notations follow the UML (unified mo de ling lang uage) sp ec- ifications. The time go es by from the top to the bo ttom. The pro cess consists of the 3 stages. The orga nizer asks the sub jects a ques tio nnaire (consisting of 8 questions Q 1 to Q 8). The org anizer g e nerates the preference diagrams from the answers to the question Q1 after the pr ior stage. T he orga nizer extr acts the topics, in which the sub j ects are in terested in the gr oup discussions, from the recorded proto cols after the main stag e . # Question Q1 Whic h art w orks do you pr efer? Q2 What is your preference on the art works? Q3 What did you become aw are o f on your prefer ence? Q4 What did you become aw are o f on your prefer ence? Q5 W ere the preference diagrams used in the part I dis c ussion useful? Q6 W ere the preference diagrams used in the part II discussio n useful? Q7 Did the individua l topic app earing in the discussions help you verify the understanding of your pr eference? Q8 Did the individua l topic app earing in the discussions help you b eco me aw a re of your preference? T able 1: The 8 q ues tions (Q1 to Q8) requested to the s ub jects in Fig ure 2. 6 Figure 3: Exa mple of the preference diagra ms which ar e used in the part 1 gro up discuss ion. The dia gram indicates the cluster characteristics among the art works, and the sub jects (such as n PID50 ). The num ber of clusters is | c | = 7. # Number o f YES Ratio Q5 11 1 00% Q6 9 82 % T able 2: Summary of the ans wers to the questions Q5 and Q6. discuss them fr eely . The diagra m of | c | = 7 is shown by Figure 3. Images of the a r tw or ks are a ttached to the corres p o nding no des. The four diagr a ms that include the switch ob jects were presented in the pa rt 2 gro up discussion. Finer and coarser gr anularit y dia grams ( | c | =3, 5, 7, and 8) were prese n ted at the sa me time as in the part 1 gr oup discussion. The diag ram of | c | = 7 is shown by Figure 4. The s ub jects could recog niz e the switch o b jects, compare the strong and weak preferences, a nd obtain a clue to their unconscious prefer ences by interpreting and explaining the diagrams in the g r oup discuss ion. The a nswers to ques tio ns Q 2 to Q8 were used in three analyses. Questions Q5 and Q6 a r e for the first analysis : the ev a luation o f the reflection pr o cess. Que s tions Q 7 and Q8 are for the second ana lysis: the analysis of the characteristics of the topics tha t helped the sub jects b ecome aware of their unco nscious preferences . Questions Q2 to Q4 ar e for the third analysis: the analysis o f the character is tics o f the unco nscious pre ferences of which the sub jects b ecame conscious . The second a nd third ana lyses are demons tr ated in 3 .2. Here, the firs t ana lysis is demonstr ated. A summar y of the answers to questions Q 5 and Q6 a r e shown in T a ble 2. Every sub ject agreed that the preference diagrams were useful in the part 1 group discussio n. Most sub jects agreed that they were useful in the par t 2 group disc ussion. The ans wers indicate that the visualizatio n to ol, like the preference diag ram, is useful in g eneral. The reason some did not r ealize their unconscious prefer e nces is analyzed below with the third analysis . 7 Figure 4: E xample of the preference diag rams which are us ed in the part 2 of the group discussions. The diagram indicates the r elationships among the art works, the sub jects, and the switc h ob jects (such as n SWT50 for n PID50 ) from the sub jects in the primary clusters tow ard the seco ndary clus ter s. The num ber of clusters is | c | = 7. 3.2 V erbalization In the seco nd analysis , the group discussions were r ecorded as proto cols . The coo rdinator extr acted the r elev ant topics of the dis c us sions fro m the recor ded proto c ols. The rele v ant topics a re those on which the sub jects discussed for more tha n five min utes. The nine extracted topics are lis ted in T able 3. Among them, five topics app eared in the par t 1 discussio n. They are related to the interpretation of the clusters, individual sub jects’ per sonalities, a nd the change arising from the gr anularit y . The other s a ppea red in the part 2 discussio n. The sub jects w ere interested in the in terpretation of the switch ob jects and the secondary clusters. Discus sion on the discrepancy amo ng individua l sub jects’ exp ectations a nd interpretations and the dia grams were hot throughout the discussions. The a ns wers to questions Q7 and Q 8 a re summar ized in T able 4. The top three topics as ranked in Q7 are topics T3 , T2 , and T 1 . The topics that were extracted from the part 1 discussio n were useful in helping the sub jects verify the understa nding of their preferences. T opics T7, T8, and T9, which were extracted from the part 2 discussion, were not selected at all. The sub jects could b e convinced that their understanding a greed with the others’ if the clustering structure in the diagrams co uld b e interpreted a s e a sily as they exp ected. The to p three topics ra nked in ques tion Q 8 w ere the topics T 8 , T9, and T7 . The topics extracted from the par t 2 discussio n help ed the sub jects bec o me aw are of their preferences . The ranking o f the topics from Q2 a nd Q1 b ecomes low while the ranking of the topics from Q3 is high b oth in Q7 and Q8. The sub jects could b ecome aware o f their unconscio us pr eferences by compar ing the weak pr eference (the seco ndary clus ter ) with the strong preferenc e (the primary cluster), and by attempting to verbalize the orig in and background (the switch o b ject) o f the weak preference. Visualizing and verbalizing the weak pr eference in co nt rast to the str o ng preference contributes to b ecoming aw a re of the unco nscious prefer ence. The pr eference diagr ams used in the part 2 discuss ion are mo re effectiv e fo r this purp ose. These are the first lesso ns lear ned in the exp eriments. Next, the third analysis is demonstrated. E xamples of the answers to questions Q 2 to Q 4 are listed in T able 5. Sub jects n PID59 and n PID72 did not answer YES to question Q6 in T able 2. Sub ject n PID59 discov ered that the understandable deg ree of abstractness a nd warm colors ar e relev ant as a motif. Acco rding to the pro to cols, the sub ject talked ab out the primary cluster s in the co arser g ranularit y preference diagra ms. The sub ject pa rticularly observed the tech nical deta ils of the artw orks in the primary cluster. This s e ems to b e the reason why the sub ject 8 # T opic T1 Ho w do the ex pr ession and the meaning of the a rt w orks belo nging to the c lusters resemble? T2 Ho w does the p ersona lity o f the sub jects belong ing to the clusters r esemble? Part 1 T3 Do you lik e or dislike the cluster s? T4 Are the clusters different fro m the art works which you feel are similar? T5 Ho w do the clus ter s look different ly when the granularit y is ch anged? T6 What do the clusters, which lo ok unchanged when the granularity is changed, mean? T7 What do the switch ob jects represent? Part 2 T8 Do you lik e or dislike the sec o ndary cluster to which the switc h ob ject has link? T9 Ho w do the clus ter s look different ly when the granularit y is ch anged? T able 3: The 9 disc ussion topics ex tr acted from the proto co l analys is. Question T opics Q7 Q8 Num b er of YES Ranking N umber of YES Ranking T1 6 2 3 5 T2 5 3 2 8 T3 7 1 5 2 T4 4 4 3 5 T5 3 6 3 5 T6 4 4 1 9 T7 0 (7) 4 4 T8 0 (7) 7 1 T9 0 (7) 5 2 T able 4: Summary of the answers to the quetions Q7 and Q8 . 9 Sub ject # Answers Q2 I don’t lik e perso ns as a motif. 59 Q3 Understandable abstractness, w arm colors, and landsca p e motifs are relev ant to m y preference. Q4 The same as the Q3. Q2 Comp osition, rather than colo r, gov e r ns the comforts I feel. 66 Q3 Motifs are not rele v ant to m y preference. I don’t lik e the ar t works lik e c o mmercial p o s ters. Q4 Flow of lines o r pain tbrushes determines the co mforts I feel. Q2 I can’t imag ine the ar t works w hich I dislike. Q3 I noticed that I hav e prefer e nce than I exp ected. 71 I don’t lik e the prima ry co lors s uch as red or yello w. Q4 The diagrams agrees with my intuitiv e feeling mor e fir mly as the g ranularit y of the diagrams becomes finer. Q2 I lik e landscap es and the drawings which a re not complica ted. 72 Q3 I noticed that simplicity becomes the calmness whic h heals me. Q4 The same as the Q3. Q2 I lik e the a rt w orks whic h as sert themselv es in dra wing na ture, or make m yself feel at ease . 80 Q3 I beg a n to feel that the simplicit y in the a bstract painting is one of the assertio ns which a ttracts me. Q4 I noticed that I got tired if the dr awing includes o nly living things, or na ture scenes. Q2 I lik e funn y , understandable, impressive, or queer art w orks. Q3 I am sur prised at so me o f the a rt works whic h b elong 81 to m y cluster, but fond of the others. Q4 The secondary cluster is related to my tempo r ary feeling, or the influence fro m my friends . T able 5: Example of the answers to the questions Q2, Q 3, and Q4. felt that the switc h to the seco ndary clusters w as not relev ant. Sub ject n PID72 discov ered that the simplicity the sub ject prefer s means the calmness that heals the sub j ect ra ther than the technical concis eness of the drawings. According to the proto c o ls, the sub ject talked a b o ut the primary clusters in the finer g ranularit y pre fer ence diagrams. Similar ly to sub ject n PID59 , atten tion w as paid to obs erving the detailed expression tha t the artw orks in the pr imary cluster conveys. This seems to be the reas on why the switch is not relev ant. The other sub jects answered YES to question Q6 in T able 2. Sub ject n PID80 talked ab out the secondary clusters in the more coa r se gr anularit y prefer e nce diagrams, and be came aw a re that the sub j ect gets tired if the drawings include only living thing s o r nature scenes. Sub j ect n PID81 talked about the secondar y clusters in the finer gra nularit y preference diagra ms, a nd b ecame aw are that the tempor ary feeling, o r the influence from friends, is included in the factors that determine the weak prefer e nce. Sub ject n PID66 bec ame aw are that the flow of lines or brush str okes is relev ant to the preference, rather than the co mp os ition, which the sub ject exp ected b efore the group discussion. Sub ject n PID71 talked ab out the a rtw o rks in the finer g ranularit y preference diagr ams and b ecame aw are that the sub ject has a n intuitiv e sense of prefer ence, which is contrary to the sub ject’s prior understanding. The conten t, which the sub jects beco me aw are of in the reflectio n pro c e ss, ra nges widely . It is not limited to the uncons cious prefer e nc e . It may b e a deep er analysis o f the expre s sion in the artw orks or the cr iteria to select the a rtw o rks which the sub jects prefer stro ngly . The degree of the pr ior understanding of the sub j ects a lso ranges widely . The gra nularit y of the pr eference diagram with which the individual sub jects discov er something depe nds on the sub ject. It is imp or tant to introduce an adjustable par ameter in visualization such as gr anularit y to a dapt to the differences in the sub jects. These are the seco nd les sons lea rned in the exp eriments. 10 4 Conclusion F or this pap er, we develop ed a metho d that helps p eople b ecome aw are of their unconscious preferences a nd co nvey them to others in the form of v erbal explanation. The metho d comb ines the concepts of reflection, visualiza tion (with an algo rithm to dr aw the sub jects’ stated preferences in a diagr am), and verbalization (throug h gro up discussion). The metho d was tested in an ex per iment where the unco nscious preferences of the sub jects for v ario us artw orks were in vestigated. In the exp er imen t, tw o less ons were lea rned. The first is that it helps the sub jects b eco me aware of their unconscious preferences to verbalize weak pre fer ences a s compa red with stro ng preferences through discussion ov er preference diag rams. The second is that it is effective to introduce an a djustable factor into v is ualization, such a s the gr anularit y of the prefere nce diagra m, to adapt to the difference s in the sub jects and to foster their m utual understanding . The le s sons imply tha t the in terpretatio n of the weak preference s , which emerg e d in the refle c tion pro cess , is sub ject to the particular nature o f the presented artw o rks and the sub jects joining the discussion. The questionnair e may also affect the sub jects. W hich a rtw ork is suitable for your ro om? Whic h artw ork would you like to buy? These tw o q uestions may cause differe n t resp onses fro m the s ub jects. P references may also b e influenced by a c hange in the environment. The individual’s unco nscious tendency itself may change by the individual bec o ming aw are of its pres ence. Such sensitivity is essential to mode r n consumer b ehavior. It is b eneficial to fo cus on such cas e-by-case preferences rather tha n to make a n effort to figure o ut the universal laws of h uman behavior. Unconscious pr eference is one of the fac to rs in stimulating br and switc hing in marketing or extending belo ng ing groups in communication. W e have taken the firs t step tow a rd understanding indiv idua ls’ unco nscious tendencies in thinking and ac ting . Our metho d s timulates the existing unco ns cious tendency in order to prompt change. The metho d, whic h exploits the delicate na ture of the unconscious preference, is e ssential in the future of ma rketing, education, comm unication, and man y other a pplications. References [Arora 1998] N. Aror a , G. M. Allenb y , a nd J. L. Ginter: A hiera rchical Bay es model of pr imary and secondar y demand, Marketing Science 17 , 29-44 (199 8). [Cheung 2004] K. W. Cheung, K. C. Ts ui, and J . Liu: Extended latent class mo de ls for collab orative recommen- dation, IEEE T ransa ctions on Systems, Man, & Cyb er netics Part A 34 , 143- 1 48 (2004). [Clauset 2008] A. Clauset, C. Moo re, and M. E. J. Newman: Hierarchical structure and the predictio n of missing links in net works, Nature 453 , 98-100 (20 08). [Dempster 1977] A. Dempster: Max im um lik eliho o d from incomplete data via the EM algorithm, Journal of the Roy al Statistics So ciety B39 , 1-38 (1977). [Duda 2000] R. O. Duda, P . E. Har t, and D. G. Stork: Pattern cla ssification. Wiley - Int erscience (2000). [F ruch terman 1991] T. M. J. F ruch terman and E. M. Reing old: Gr aph drawing by force-directed placement, Soft ware - Pra c tice and Exp erience 18 , 1129-1 164 (1991). [Green 1981] P . Green, J. Car roll, and S. Goldb erg : A general approa ch to pro duct des ig n optimization via conjoint analy sis, Jo urnal o f Mar keting 4 3 , 1 7-37 (19 81). [Hastie 2001] T. Has tie, R. Tibshira ni, and J . F riedma n: The elements of statistical lear ning: Data mining, inference, and prediction. Springer-V erlag (200 1 ). [Ishii 2002] N. Ishii, and K. Miwa: Interactive pr o cesses betw een mental and external op erations in crea tive a ctiv- it y: A comparison of exp erts’ and novices’ pe r formance, in P ro ceedings of the Creativity a nd Cognition Conference, Loughboroug h (200 2 ). [Krebs 2002] V. E. K rebs: Ma pping netw orks o f terrorist cells, Connectio ns 2 4 , 43-52 (20 02). [Larkin 1987] J. Lar kin, and H. A. Simon: Wh y a diag ram is (sometimes) worth ten thousand words?, Cognitive Science 11 , 65-99 (1 987). [Libe n-Now ell 2007 ] D. Lib en-Nowell, a nd J. Kleinberg : The link predictio n pro blem for so cial net works, Jour na l of American Society of Informa tion Scienc e and T echnology 58 , 10 19-10 31 (20 07). 11 [Maeno 2007a] Y. Maeno, Y. Ohs awa, and K . Ito: T r igger to s witch individual’s interest tow a rd unconscious pref- erence, in Pro ceedings of the In ternationa l Co nference on Knowledge-Based and In telligent Infor mation & Engineering Systems, Vietr i sul Mar e (200 7). [Maeno 2007b] Y. Maeno, and Y. O hsaw a: Human-computer in teractive annea ling for discovering invisible dark even ts, IEEE T rans a ctions o n Industrial Electr o nics 54 , 1184 -1192 (2007). [Maeno 2009] Y. Maeno, and Y. Ohsawa: Analyzing cov ert so cial netw o rk foundation b ehind terroris m disaster, in press, International Journal of Services Scie nces (200 9). Av aila ble e-print h ttp://arx iv.org/ abs/07 10.4231 . [Newman 2007] M. E. J . Newman, a nd E. A. Leich t: Mixture mo dels and explor atory analys is in netw o r ks, Pro ceedings of the National Academy o f Sciences USA 104 , 9564- 9569 (2007). [Palla 2005 ] G. Palla, I. Der` enyi, I F ark as, and T. Vicsek: Uncov ering the overlapping communit y structur e of complex netw o rks in nature and so c iet y , Nature 435 , 814-818 (2005). [Sales-Pardo 200 7] M. Sales-Pardo, R. Guimer` a, A. Moreir a, a nd L. A. N. Amaral: Extracting the hiera r chical organiza tion of complex systems, P r o ceedings of the National Aca de my of Sciences USA 104 , 15224- 15229 (2007). [Sch¨ on 2006] D. A. Sch¨ o n: The reflective pra ctitioner: How pro fessionals think in action. Basic Bo oks (20 06). [Su wa 200 2] M. Suw a, and B. Tv ersky: Constructive p erceptio n: An e xp e r tise to use diagrams for dynamic int eractivity , in Pro ceedings of the Ann ual Conference of the Cog nitive Science Society , F air fax (2002). [Su wa 200 3] M. Suw a , and B. Tversky: Constructive p er c eption: Metacog nitive sk ill for coo r dinating p erception and c o nception, in Pro ce e dings of the Ann ual Conference of the Cognitive Science So ciety , Boston (200 3). [Thu rlow 2004 ] C. Thurlo w, L. Leng e l, and A. T omic: Computer mediated communication. Sag e Publications Ltd. (2004). [UML 2.1.2] Unified Modeling La nguage v ersion 2.1.2 (20 0 7). URL http://www.omg.org/s pec / UML/2.1.2/ . [Zaltman 2003] G. Z a ltman: Ho w cus to mers think: Ess ent ial insights into the mind of the market. Harv a r d Business Sc ho ol Press (2003). [Zhang 2004] N. L. Zhang, and T . Ko ck a : E fficient lea rning of hier a rchical latent class mo dels , in Pro ceedings of the IEEE International Conference on T o ols with Artificial Intelligence, Bo ca Rato n (20 04). 12
Original Paper
Loading high-quality paper...
Comments & Academic Discussion
Loading comments...
Leave a Comment