HIV with contact-tracing: a case study in Approximate Bayesian Computation
Missing data is a recurrent issue in epidemiology where the infection process may be partially observed. Approximate Bayesian Computation, an alternative to data imputation methods such as Markov Chain Monte Carlo integration, is proposed for making …
Authors: Michael G.B. Blum (TIMC), Viet Chi Tran (LPP, CMAP)
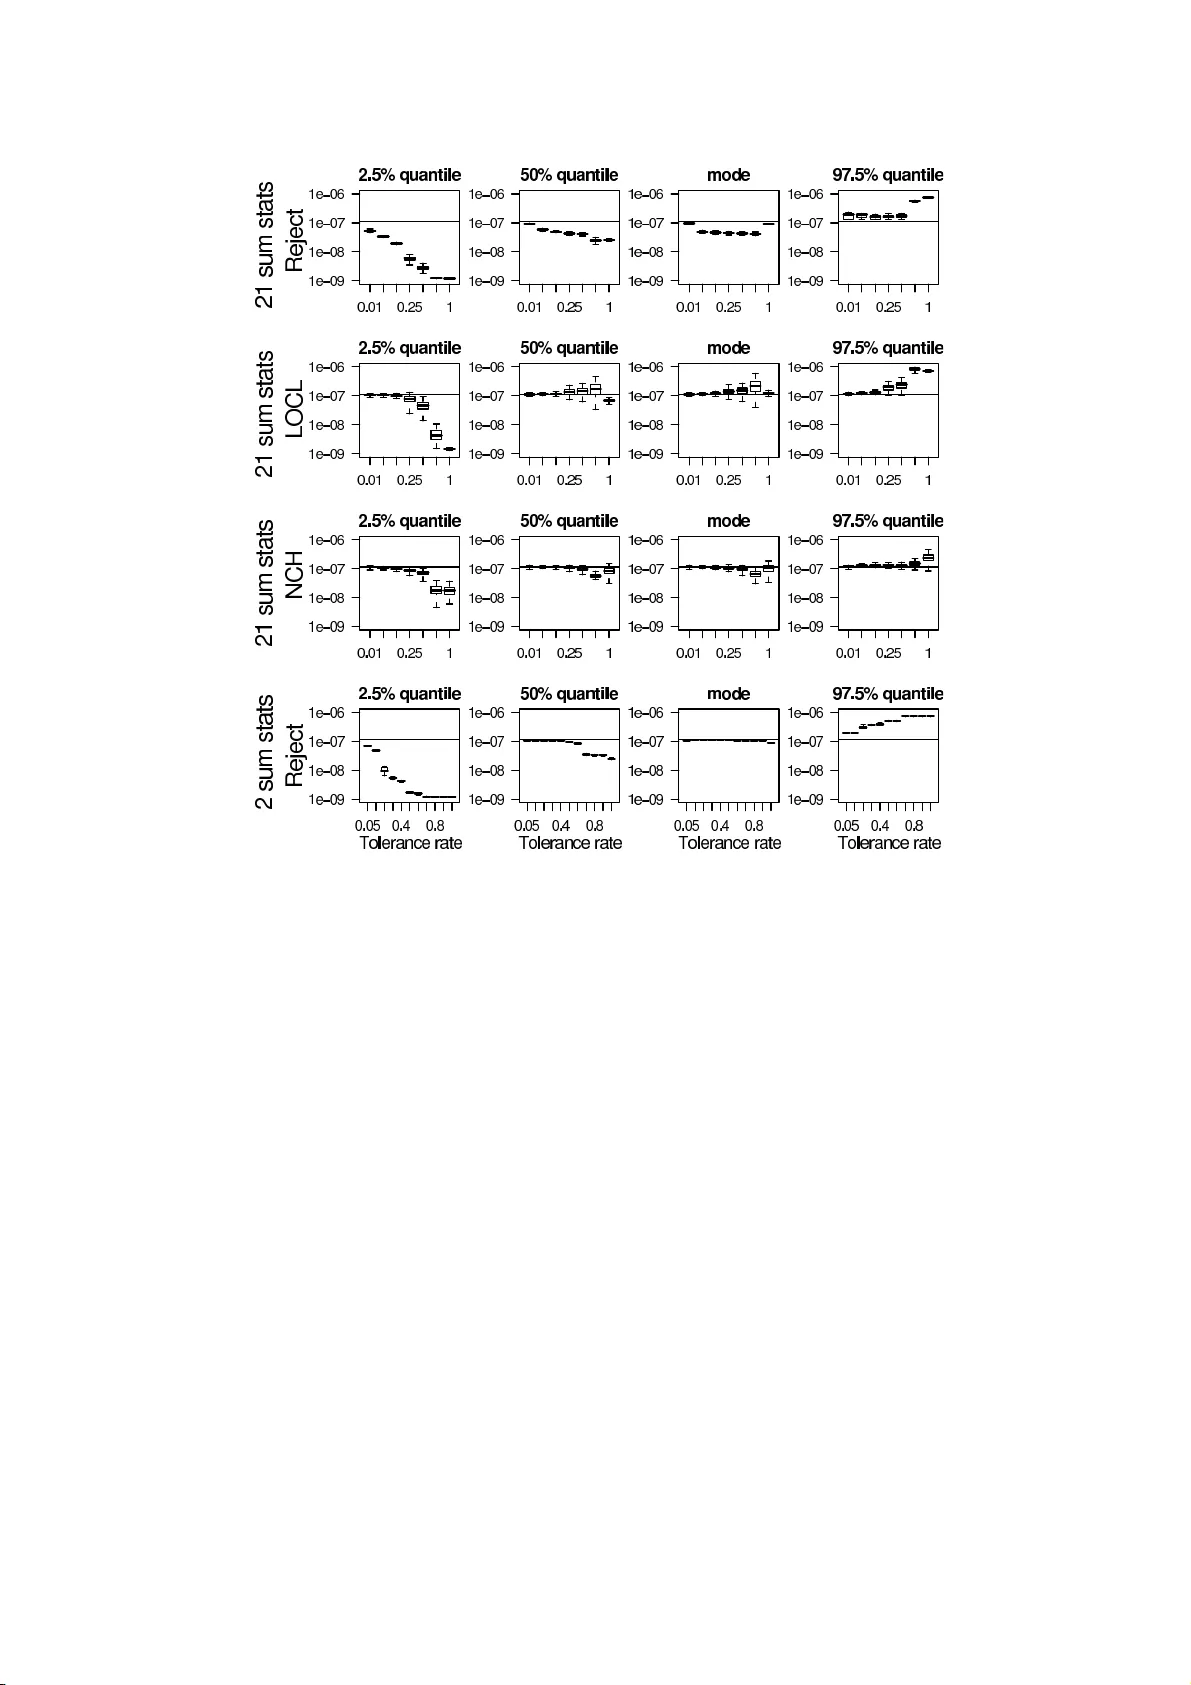
HIV with con tact-tracing: a case study in Appro xim ate Ba y esian Computation Mic hael G.B. Blum 1 , Vie t Chi T ran 2 1 CNRS, Lab oratoire TIMC-IMAG , U n iversi t´ e Joseph F ourier, Grenoble, F rance 2 Lab oratoire P . Painlev ´ e, U n iversi t´ e Lille 1, F rance Abstract Missing data is a r ecurrent issue in epidemio logy where the infection pro cess may b e partially obser ved. Approximate Bayesian Computation, a n alternative to data imputation metho ds suc h as Markov Cha in Mont e Car lo integration, is prop osed for making inference in epidemiologica l models. It is a likelihoo d-free metho d that r e lies exclusively on n umerica l simulations. ABC consists in computing a distance betw een simulated and obser ved summ a r y statistics and weigh ting the simulations according to this distanc e . W e prop ose an origina l extension of ABC to pa th-v alued summary statistics, cor resp onding to the cumulated num b er of detections as a function of time. F or a standar d compa rtmental mo del with Suceptible, Infectious and Recovered individuals (SIR), we show that the p os ter ior distributions o btained with ABC and MCMC a re similar. In a r efined SIR mo del well-suited to the HIV c o ntact- tracing data in Cuba, we p erform a co mparison betw een ABC with full and binned detection times. F or the Cuban data, we ev alua te the efficiency of the detection system and predict the evolution of the HIV-AIDS dise ase. In par ticular, the p ercentage of undetected infectious individuals is found to b e of the order of 4 0 %. Keywor ds: Mathematical epidemiology; sto c hastic SIR mo d el; un observ ed infectious p opulation; sim ulation-based inference; lik eliho o d-free in ference. AMS Subj e ct Classific ation: 92D30, 62F15, 62M05 , 62N02, 60K99. 1 In tro duc tion Mathematica l mo delling p la ys an imp ortant r ole for u nderstand in g and pred icting the sp read of diseases, as we ll as for comparing and ev aluating pu blic health p olicies. Although deterministic mo delling can b e a guide for describing ep idemics, sto c hastic m o dels hav e their imp ortance in featuring realistic p ro cesses and in quan tifying confidence in parameters estimates and prediction uncertain t y [4]. S tandard mo dels in epidemiology consist in compartmental mo dels in wh ich the p opulation is structur ed in different classes comp osed of S usceptible, Infectious, and Reco vered (or Remo v ed) individuals (SIR). P arameter estimation for SIR mo dels is usually a difficult task b ecause of missing obser v ations, w h ic h is a r ecurren t issue in epidemiology . When the infected p opulation is partially observ ed or when the infection times are missing, the computation of the lik eliho o d is n um erically inf easible b ecause it inv olves integrati on ov er all the unobs er ved ev en ts. Mark o v Chain Mon te Carlo (MCMC) metho ds that treat the missing data as extra pa- rameters, ha ve b ecome increasingly p opular for calibrating sto chastic epid emiologic al mo dels with missin g data [21, 20, 8]. Ho wev er, MCMC may b e compu tationally prohibitive for high- dimensional missing observ ations [9, 24] and fine tun ing of the prop osal d istribution is requ ired for efficien t algorithms [17]. In this pap er, we show that SI R mo dels with missin g obs erv ations can b e calibrated w ith Ap pro ximate Ba y esian Computation (ABC), an alternativ e to MCMC, originally prop osed for making inference in p opu lation genetics [3]. This appr oac h is not based on 1 the lik eliho o d fu nction bu t relies on numerical simulat ions and comparisons b et w een simulated and obs erv ed summary statistics. This w ork is motiv ated by the stud y of the Cuban HIV-AIDS database that conta ins the dates of d etection of th e 8,662 individu als that hav e b een f ound to b e HIV p ositiv e in Cu ba b et ween 1986 and 2007 [11]. T he database con tains additional co v ariates including the manner b y whic h an individu al has b een found to b e HIV p ositive . The individu als can b e detecte d either by r andom scr e ening (individ uals ‘sp onta neously’ tak e a detection test) or c ontact-tr acing . Con tact-tracing consists in testing the sexual con tacts of detected individu als [18]. T he tota l n umb er of infectious individuals as we ll as the infection times are u nknown. In Section 2 , we in tro du ce the sto c hastic SIR mo del with con tact-tracing deve lop ed b y [10]. Section 3 is dev oted to ABC metho ds when all detect ion times are known. W e prop ose an original extension of ABC to path-v alued summary statistics consisting of the cum ulated n u mb er of d etections through time. F or a simple SIR mo del, we compare n umerically the p osterior distributions obtained with ABC and MCMC. S ection 4 deals w ith p ossibly noisy or binn ed detection times for which the previous p ath-v alued statistics are una v ailable. W e in tro duce a finite dimensional v ector of su mmary statistics and compare the statistical prop erties of p oin t estimates and credib ility interv als obtained with full an d bin ned detection times. Finally , Section 5 concen trates on the analysis of the Cuban HIV-AIDS database. W e address sev eral questions concerning the dynamic of this epid emic: what is the p ercen tage of th e epidemic that is kno wn [18, 12 , 11]; how man y new cases of HIV are exp ected in the forthcoming yea rs ; and what is the prop ortion of detections that is exp ected in the con tact-trac ing pr ogram. 2 A sto c hastic SIR mo del for HIV-AIDS epidemics with con tact- tracing W e restrict our study to the sexually-transmitted epidemic of HIV in Cuba (90% of the epidemic, see [18 ]). F or mo delling the dynamics of th e num b er of k n o wn and u nknown HIV cases, w e consider a SI R mo del dev elop ed b y [10]. The popu lation is divided in to three main classes S , I and R corresp ond ing to the susc eptible , infe ctious , and dete cte d individuals considered as r emove d b ecause we assume that they do not transmit HIV anymore (see Figure 1). The p opulation of the susceptible individuals, of size S t , at time t > 0, consists of the sexually activ e seronegativ e individuals. Ind ividuals immigrate into the class S with a rate λ 0 and lea ve it b y dying/emigrating, with r ate µ 0 S t , or b y b ecoming inf ected. The class of inf ectious individuals, of s ize I t , corresp onds to the serop ositiv e individuals wh o hav e not tak en a detectio n test yet and may th us con taminate new susceptible individ u als. W e assume that eac h infected individual ma y transmit the disease to a susceptible individual at rate λ 1 so that the total rate of infection is equal to λ 1 S t I t . In dividuals lea v e the class I w hen they die/emigrate with a total rate of µ 1 I t , or wh en they are d etected to b e HIV p ositiv e. The class R of the d etected individuals, of size R t , is sub d ivided into t wo sub classes. W e denote b y R 1 t (resp. R 2 t ) the size of the remo ve d p opulation detected by r an d om s cr eenin g (resp. con tact-tracing). The tota l rate of detection by random screening is λ 2 I t . F or the rate of con tact-tracing detection, the mo del shall capture the fact that the con tribu tion of a remo v ed individual dep end s on the time elapsed since she/he has b een foun d to b e HIV p ositiv e. W e consider the tw o follo wing expressions for the total rate of con tact-trac ing detection λ 3 I t X i ∈ R e − c ( t − T i ) and λ 3 I t X i ∈ R e − c ( t − T i ) / ( I t + X i ∈ R e − c ( t − T i ) ) , (2.1) where T i denotes the time at whic h a remo ved individual i has b een dete cted. The w eight exp( − c ( t − T i )), with c > 0, determines the contribution of a remo ved individu al i to the 2 con tact-tracing according to the time t − T i she/he has b een d etected. Th e firs t rate in (2.1) corresp onds to a mass acti on pr inciple, and is prop ortional to the sum of the con tribu tions of the d etected in d ividuals. The second rate in (2.1) corresp onds to a mo del with fr equency dep end ence. In the follo w ing, θ = ( µ 1 , λ 1 , λ 2 , λ 3 , c ) d en otes the m ultiv ariate parameter of the mo del. The p arameters of interest are here λ 1 , λ 2 and λ 3 . 2.1 Connection b etw een the sto cha stic and the deterministic SIR mo del Here we consider the firs t rate of cont act-tracing detection in (2.1), but similar results can b e obtained for the second r ate. [10] sh o w ed that in a large p opulation limit, th e SIR p ro cess of Section 2 can b e mo delled w ith sto c hastic differen tial equations and con v erges to the solution of the follo wing system of ordinary d ifferen tial equations ds t dt = λ 0 − µ 0 s t − λ 1 s t i t di t dt = λ 1 s t i t − ( µ 1 + λ 2 ) i t − λ 3 i t r t dr t dt = λ 2 i t + λ 3 i t r t − cr t , (2.2) where s t and i t denote th e size of the s usceptible and infectious p opulations, and where r t is the con tribution of th e remo ved ind ivid uals to th e con tact-tracing (see Section 1 of the supp lemen- tary material for more d etails). Apart from the inherent sto c hastic n ature of epidemic propagation that may b e particularly imp ortant for small p opulations [14 ], considering a s to c hastic S I R mo del rather than its d eter- ministic counterpart can present at least t w o imp ortan t adv antag es. First, it is qu ite straightfo r- w ard to p erform simula tions fr om the stochastic mo del (see Section 2 of the su pplementa ry ma- terial) and this is one motiv ation for considerin g ABC metho d s. Second, the individ ual-cen tered sto c hastic pro cess su its the formali sm of statistical method s , whic h are based on samples of individual data. Sin ce the estimates of the sto chasti c pro cess con verge to the parameters of the ODEs [10], ABC provi d es a new alternativ e for calibrating parameters of ODEs [1, 7]. 3 ABC with sufficien t summary statistics for epidemic mo dels 3.1 Main principles of ABC F or simplicit y , we deal here w ith densities and not general probability measures. Let x b e th e a v ailable d ata and π ( θ ) b e the prior. Tw o appr o ximations are at the core of ABC. Replacing obs erv ations with summary statist ics Instead of fo cusing on the posterior densit y p ( θ | x ), ABC a ims at a p ossibly less informativ e tar g et d ensit y p ( θ | S ( x ) = s obs ) ∝ P r ( s obs | θ ) π ( θ ) where S is a su mmary s tatistic that tak es its v alues in a normed space, and s obs denotes the obs erv ed summary statistic. The summary statistic S can b e a d -dimen s ional v ector or an infinite-dimensional v ariable suc h as a L 1 function. Of course, if S is sufficien t, then the t w o conditional densities are the same. T h e target distrib ution will also b e coined as the p artial p osterior distribution . Sim ulation-based approximations of the p osterior On ce the summ ary statistics ha v e b een c hosen, the second appro ximation arises w hen estimating the partial p osterior densit y p ( θ | S ( x ) = s obs ) an d sampling from this distr ibution. This step in v olv es nonparametric k ernel estimation and p ossibly correction refinement s giv en in S ection 4.2. 3 3.2 Sampling from the p osterior The ABC metho d with smo oth rejection generates random d ra ws from the target distr ibution as f ollo ws [3 ] 1. Generate N random draws ( θ i , s i ), i = 1 , . . . , N . The p arameter θ i is generated fr om the prior distr ibution π and th e v ector of summary statistics s i is calculated for the i th data set th at is simula ted from the generativ e mo del w ith p arameter θ i . 2. Asso ciate to the i th sim ulation the w eigh t W i = K δ ( s i − s obs ), wh ere δ is a tolerance threshold and K δ a (p ossibly multiv ariate) smo othing ke rn el. 3. The distribution ( P N i =1 W i δ θ i ) / ( P N i =1 W i ), in whic h δ θ denotes th e Dirac mass at θ , ap- pro ximates the target d istribution. 3.3 P oin t estimation and credibility in t erv als Once a sample fr om the target d istr ibution has b een obtained, sev eral estimators ma y b e consid - ered for p oint estimation of eac h one-dimensional parameter λ j , j = 1 , 2 , 3. Using the weigh ted sample ( λ j,i , W i ), i = 1 , . . . , N , the me an of the target d istribution p ( λ j | s obs ) is estimated by ˆ λ j = P N i =1 λ j,i W i P N i =1 W i = P N i =1 λ j,i K δ ( s i − s obs ) P N i =1 K δ ( s i − s obs ) , j = 1 , 2 , 3 (3.1) whic h is the well-kno wn Nadara ya- W atson regression estimator of the conditional exp ectation E ( λ j | s obs ). W e also co mp ute th e me dians , mo des , and 95% credibilit y in terv als (CI) of the marginal p osterior distribu tion (see Section 3 of the su pplement ary material). 3.4 Data and ch oice of summary st atistics Data Starting at the time of the fir s t d etectio n in 1986, the Cub an HIV-AIDS data consist principally of the d etectio n times at whic h the ind ividuals h a v e b een f ound to b e HIV p ositiv e. A t the time of the last detection ev en t, in July 2007, there is a total of 8,662 in d ividuals in the database. F or eac h d etection eve nt, there is a lab el indicating if th e individ ual has b een detected b y random screening or con tact-tracing. Summary statistics W e consider th e tw o (in fi nite-dimensional) statistics ( R 1 t , t ∈ [0 , T ]) and ( R 2 t , t ∈ [0 , T ]). Their sum is equal to the cumulated num b er of detections sin ce the b eginning of the epidemic. Because the data consist of the detection times for the t w o differen t t yp es of detection, these t wo statistics can simply b e view ed as a particular co ding of the whole dataset so that the partial p osterior d istribution p ( θ | R 1 , R 2 ) is equal to th e p osterior distribu tion p ( θ | x ). The L 1 -norm b et w een the i th sim ulated path R l i and th e observed one R l obs is k R l obs − R l i k 1 = Z T 0 | R l obs,s − R l i,s | ds , l = 1 , 2 , i = 1 , . . . , N . (3.2) F or computing the w eigh ts W i , we c ho ose a p ro du ct k ernel so that W i = K δ 1 ( k R 1 obs − R 1 i k 1 ) K δ 2 ( k R 2 obs − R 2 i k 1 ) where δ 1 , δ 2 are 2 tolerance thr esholds. Epanec hniko v k ernels are considered for K δ 1 and K δ 2 and δ 1 and δ 2 are f ound by accepting a give n p ercenta ge P δ 1 = P δ 2 of the simula tions. 4 3.5 Comparisons b etw een ABC and MCMC metho ds for a standard SIR mo del F ollo win g [3] a p erformance indicator for ABC techniques consists in their abilit y to replicate lik eliho o d-based results giv en b y MCMC. Here the s ituation is p articularly fa v orable for com- paring the t w o m etho ds since the partial and the full p osterior are the same. In the follo win g examples, we c ho ose samples of small sizes ( n = 3 and n = 29) so that the dimension of the missing data is reasonable and MCMC ac hiev es fast con v ergence. F or large sample sizes with high-dimensional missin g data, MCMC con vergence might in deed b e a serious issue and more thorough u p dating sc heme shall b e implement ed [9, 24]. W e consider the stand ard SIR mo d el with no con tact-tracing ( λ 3 = 0). W e c h o ose gamma distributions for the priors of λ 1 and λ 2 with a sh ap e parameters of 0 . 1 and rate parameters of 1 and 0 . 1. The data consist of the detectio n times and we assume that the infection times are not observ ed. W e implemen t the MCMC algorithm of [21]. A total of 10 , 000 steps are considered for MCMC with an initial burn -in of 5 , 000 steps. F or ABC, the su mmary statistic consists of the cumulativ e n umber of d etections as a fu nction of time. A total of 100 , 00 0 sim ulations are p erformed for ABC. The fir st example was previously considered b y [21]. They simulated detection t imes b y considering one initial infectious individual and b y setting S 0 = 9, λ 1 = 0 . 12, and λ 2 = 1 (see Section 4 of th e supp lementary m aterial for the d ata). As display ed b y Figure 2, the p osterior distributions obtained with ABC are extremely close to th e ones obtained with MCMC provided that the tolerance rate is sufficien tly s m all. W e see that the tolerance rate changes imp ortan tly the p osterior d istr ibution obtained with ABC (see the p osterior distributions for λ 2 ). In a second example, w e sim ulate a standard SIR tra jectory w ith λ 1 = 0 . 12, λ 2 = 1, S 0 = 30 and I 0 = 1. The d ata no w consist of 29 detection times (see Section 4 of the supplementary material). Once again, Figure 2 shows that the ABC and MCMC p osteriors are close pro vided that the tolerance rate is small enough. ABC pro duces p osterior distr ibutions w ith larger tails compared to MCMC, even with the lo west tolerance rate of 0 . 1%. This can b e explained b y considering th e extreme scenario in which the tolerance threshold δ go es to infin ity: eve ry sim ulation has a weig ht of 1 so that ABC targets the prior ins tead of th e p osterior. As the prior has typical ly larger tails than the p osterior, ABC inflates the p osterior tails. 4 Comparison b et w een AB C wi th full and binned detection times When there is noise or w hen the detection times hav e b een binn ed, the full observ ations ( R 1 t , t ∈ [0 , T ]) and ( R 2 t , t ∈ [0 , T ]) are una v ailable. Then , w e replace these summary statistics b y a v ector of su mmary statistics suc h as the num b ers of detections p er y ear during the observ ation p erio d . Since these new su mmary statistics are n ot sufficien t an ymore, the n ew partial p osterior distribution ma y b e differen t from the p osterior p ( θ | x ). In the follo w in g, w e compare p oin t estimates and CIs obtained f rom ABC with full (metho d of S ection 3) and bin ned detection times (metho d of Section 4.2). 4.1 A new set of summary statistics W e consider a d-dimensional vecto r of sum mary statistics of three different t yp es. First, w e compute the num b ers R 1 T and R 2 T of individu als d etected b y rand om screening and con tact- tracing by the end of th e observ ation p erio d. Second, for eac h y ear j , w e compu te the n umb ers of ind ividuals that hav e b een found to b e HIV p ositiv e R l j +1 − R l j , l = 1 , 2. The third t yp e of summary statistics consists of the num b ers of new infectious for eac h of the the sixth fir st y ears 5 I j +1 − I j for j = 0 , . . . , 5, as we ll as the mean time durin g whic h an individual is inf ected b ut has n ot b een detected yet. This mean time corresp on d s to the mean so journ time in the class I for the sixth fir st y ears. These summary statistics are a v ailable here b ecause infectious times b efore 1992 are kno wn . In order to compute the weig hts W i , w e consid er the follo wing spherical k ernel K δ ( x ) ∝ K ( k H − 1 x k /δ ). Here K d enotes the one-dimens ional Epanechnik ov kernel, k . k is the Euclidian norm of R d and H − 1 a matrix. Bec ause the summary statistics ma y span different scal es, H is tak en equal to the d iagonal matrix with the standard deviation of eac h one-dimens ional summary statistic on the d iagonal. 4.2 Curse of dimensionalit y and regr ession adjustmen ts In th e case of a d -dimensional vect or of s ummary statist ics, the estimator of th e cond itional mean (3.1) is con verge nt if the tolerance r ate satisfies lim N → + ∞ δ N = 0, so that its bias con v erges to 0, an d lim N → + ∞ N δ d N = + ∞ , so that its v ariance conv erges to 0 [13]. As d increases, a larger tolerance threshold shall b e c hosen to k eep the v ariance small. As a consequence, the b ias ma y increase with the num b er of s ummary statistics. Th is ph enomenon kno wn as the curse of dimensionality m ay b e an iss u e for the ABC-rejection approac h. The follo wing paragraph present s regression-based adjustments that cop e with the cur se of dimensionalit y . The adjustmen t principle is presen ted in a general setting within whic h the corrections of [3] and [6] c an b e deriv ed. Correction adj u stmen ts aim at obtaining f r om a random coup le ( θ i , s i ) a random v ariable distribu ted according to p ( θ | s obs ). The idea is to constr u ct a coupling b et ween the d istributions p ( θ | s i ) and p ( θ | s obs ), through which we can shrin k the θ i ’s to a sample of i.i.d. dra ws from p ( θ | s obs ). In the remainin g of this su bsection, we describ e ho w to p erform the corr ections for eac h of the one-dimensional comp on ents separately . F or θ ∈ R , correction adjustments are obtained by assu m ing a r elationship θ = G ( s, ε ) =: G s ( ε ) b et ween the parameter and the summary statistics. Here G is a (p ossibly complicated) f u nction and ε is a rand om v ariable with a distribution that d o es n ot dep end on s . A p ossibilit y is to c ho ose G s = F − 1 s , the (generalized) inv ers e of the cum ulativ e distribu tion function of p ( θ | s ). In this case, ε = F s ( θ ) is a u niform rand om v ariable on [0 , 1]. T he formula for adjustment is give n by θ ∗ i = G − 1 s obs ( G s i ( θ i )) i = 1 , . . . , N . (4.1) F or G s = F − 1 s , the fact t h at the θ ∗ i ’s are i.i.d. with densit y p ( θ | s obs ) arises from the s tan- dard in v ersion algorithm. Of course, the fun ction G shall b e appro ximated in practice. As a consequence, the adjusted simulat ions θ ∗ i , i = 1 , . . . , N , co ns titute an appro ximate sample of p ( θ | s obs ). Th e ABC algorithm with regression adjustment can b e describ ed as follo ws 1. Sim ulate, as in the rejection algorithm, a sample ( θ i , s i ), i = 1 , . . . , N . 2. By m aking use of the sample of the ( θ i , s i )’s weigh ted by the W i ’s, appro ximate the fun ction G su c h that θ i = G ( s i , ε i ) in the vicinit y of s obs . 3. Replace the θ i ’s b y the adjusted θ ∗ i ’s. T he resulting w eigh ted sample ( θ ∗ i , W i ), i = 1 , . . . , N , form a sample from the target distribu tion. Beaumon t et al. local linear regressions (LO C L) The case where G is approximat ed b y a linear mo d el G ( s, ε ) = α + s t β + ε , wa s considered b y [3]. T he p arameters α and β are inferred b y minimizing th e w eigh ted squared error P N i =1 K δ ( s i − s obs )( θ i − ( α + ( s i − s obs ) T β )) 2 . Using (4.1), the correction of [3 ] is derived as θ ∗ i = θ i − ( s i − s obs ) T ˆ β , i = 1 , . . . , N . (4.2) 6 Asymptotic consistency of the estimators of th e partial p osterior distribution with the correction (4.2) is obtained b y [5]. Blum and F ran¸ cois’ nonlinear conditional het eroscedastic regressions (NCH) T o r e- lax the assump tions of homosc edasticit y and linearit y inherent to local linear regression, [6] appro ximated G b y G ( s, ε ) = m ( s ) + σ ( s ) × ε where m ( s ) denotes the conditional exp ecta tion, and σ 2 ( s ) the conditional v ariance. Th e estimators ˆ m and log ˆ σ 2 are found b y adju sting t wo feed-forw ard neural netw orks using a regularized wei ghted squared error. F or the NCH mo del, parameter adjustmen t is p erformed as follo ws θ ∗ i = ˆ m ( s obs ) + ( θ i − ˆ m ( s i )) × ˆ σ ( s obs ) ˆ σ ( s i ) , i = 1 , . . . , N . In p ractical app lications of the NCH mo del, w e train L = 10 neural net works for eac h condi- tional regression (exp ecta tion and v ariance) and we a v erage the resu lts of the L neural netw orks to p r o vide the estimates ˆ m and log ˆ σ 2 . Reparameterization In b oth regression adjustment app roac h es, the regressions can b e p er- formed on transform ations of the resp onses θ i rather that on the resp onses themselve s. P a- rameters whose pr ior distributions h av e finite supp orts are transformed via the logit f unction and n on-negativ e parameters are transformed via th e logarithm function. T hese transform a- tions guaran tee that the θ ∗ i ’s lie in the supp ort of the p rior distribution and ha v e th e additional adv ant age of stabilizing the v ariance. 4.3 A comparison for sim ulated datasets In order to wo rk on data similar to the Cuban database, we simulat e M = 200 syn thetic data sets for the HIV-AIDS epidemic with µ 1 = 2 × 10 − 6 , λ 1 = 1 . 14 × 10 − 7 , λ 2 = 3 . 75 × 10 − 1 , λ 3 = 6 . 55 × 10 − 5 , and c = 1 [10]. T h e initial cond itions are set to S 0 = 6 × 10 6 , the size of the Cuban p opulation in th e age-group 15-49, I 0 = 232 and R 0 = 0 [11]. Here w e simulate only 6 y ears of the epidemics. W e study four v arian ts of ABC for estimating λ 1 , λ 2 , and λ 3 : one with the t w o path-v alued summary s tatistics and three with the ve ctor of summary statistics. When us in g the finite di- mensional vect or of su mmary statistics, we p erform the smo oth rejection app roac h as well as the LOCL and NC H corrections with a total of 21 summary statistics: th e 18 summ ary statistics corresp ondin g to th e y early increases of R 1 , R 2 , and I ; the final num b ers of detected ind ividuals R 1 6 and R 2 6 ; and the m ean so journ time in the class I . Eac h of th e M = 200 estimations of the partial p osterior d istributions are p erformed usin g a total of N = 5000 sim ulations of the SIR mo del w ith the mass action p rinciple (fi rst rate in (2.1)). Prior distribut ions The prior distribu tions f or µ 1 , λ 1 , λ 2 and λ 3 are c hosen to b e un if orm on a log scale. The c h oice of a log scale reflects our uncertain t y ab out the ord er of magnitude of the parameters. The pr ior distribution f or log 10 ( µ 1 ) is U ( − 6 , − 4) wh er e U ( a, b ) denotes the un iform distribution on the interv al ( a, b ). T h e p rior distribu tion is U ( − 9 , − 6) for log 10 ( λ 1 ), U ( − 4 , 3) for log 10 ( λ 2 ), and U ( − 8 , 2) for log 10 ( λ 3 ). The b ounds of the un iform distr ib utions are set to k eep the sim ulations from b eing degenerate. The prior for c is log(2) / U (1 / 12 , 5) so that the half-life of t 7→ e − ct , whic h measures the individual contribution to th e detection b y conta ct-tracing, is uniformly d istributed b et wee n 1 / 12 and 5 y ears. P oin t estimates of θ and credibilit y in terv als Figure 3 displays the b o x p lots of the 200 estimated mod es, m edians, 2 . 5% and 97 . 5 % qu an tiles of the p osterior distribu tion for λ 1 as a 7 function of th e tolerance r ate P δ (see Figures 1 and 2 of the su p plemen tary material for λ 2 and λ 3 ). First, w e fi n d that the medians and mo d es are equiv alen t except for the rejection metho d with 21 summary statistics for whic h the mo de is less biased. F or the lo w est tolerance rates, the p oint estimates obtained with the four p ossible m etho ds are close to the v alue λ 1 = 1 . 14 × 10 − 7 used in the s im ulations, with smaller CI for the LOCL and NCH v ariants. When in creasing the tolerance rate, the bias of the p oin t estimates obtained with the rejection m etho d with 21 summary statistics slightl y increases. By con trast, up to tolerance rates smaller than 50%, the biases of th e p oin t estimates obtained with th e three other metho ds remain sm all. As can b e exp ected, the widths of the CI obtained with the rejection m etho ds increase with the tolerance rate wh ile they remain considerably less v ariable for the m etho ds with regression adjus tmen t. Mean square error F or further comparison of the differen t metho ds, w e compute the r escaled mean square errors (RMSEs). The RMSEs are computed on a log scale and rescaled by the range of the prior distribution so that RMSE( λ j ) = 1 M M X k =1 (log( ˆ λ k j ) − log ( λ j )) 2 Range(prior( λ j )) 2 , j = 1 , 2 , 3 , (4.3) where ˆ λ k j is a p oin t estimate ob tained with th e k th syn thetic data set. W e find that the smallest v alues of the RMSEs are usu ally reac hed f or the lo west v alue of th e tolerance r ate (see Figure 4). F or λ 1 and λ 2 , the RMSEs of the p oint estimates obtained w ith the four differen t m etho ds are comparable for the lo we st tolerance rate. Ho wev er, the s mallest v alues of the RMS Es are alw a ys found w hen p erforming th e r ejection metho d with the t wo sufficient su mmary s tatistics R 1 and R 2 . Th is fi n ding is ev en more pronounced for the parameter λ 3 . Rescaled mea n credibility in terv als T o compare the whole p osterior distribu tions obtained with the four different metho ds, we additionally compute the different CIs. Th e rescaled mean CI (RMCI) is defined as follo ws RMCI = 1 M M X k =1 | I C k j | Range(prior( λ j )) , j = 1 , 2 , 3 , (4.4) where | I C k j | is th e length of the k th estimated 95% CI for the parameter λ j . As disp lay ed by Figure 3, the C Is obtained with sm o oth r ejection increase imp ortan tly with the tolerance rate whereas suc h an imp ortan t increase is n ot observed with regression adj u stmen t. In Figure 4, the CIs obtained with the NCH metho d are clearly the thinnest, th ose obtained with the rejection metho ds are the widest and those obtained with the LOC L metho d ha ve inte r m ediate width. In th e follo wing, we p er f orm the NCH correctio n when considering the finite dimen sional vecto r of summary statistics. This c hoice is motiv ated by the small RMSEs and RMCIs obtained with the NCH metho d (Figure 4). 5 Application to the Cuban HIV-AIDS epidemic W e calibrate the S IR m o del with con tact-tracing to the Cuban HIV-AIDS database. W e consider t w o metho ds: smo oth rejection ABC w ith the t wo path-v alued summary statistics (Section 3), and the NCH-ABC with the v ector of summary statistics (Section 4.2). F or the Cu ban d ata, this vect or is of dimension 51. 8 5.1 P arameter c alibration and go o dness of fit F or the ABC algorithm, we p erform a total of 100,000 sim ulations, w e consid er the t wo different rates of con tact-traci n g detection (2.1), and w e use the same initial conditions and priors as in Section 4.3. T o set the v alue of the tolerance rate P δ , w e consider the 15 first yea rs of th e epidemic as the training data and c ho ose th e v alue of the tolerance rate P δ that minimizes the prediction error at the en d of the ep idemic ( T = 21 . 5) Pred Err or = E " | R 1 21 . 5 ( P δ ) − R 1 obs, 21 . 5 | R 1 obs, 21 . 5 + | R 2 21 . 5 ( P δ ) − R 2 obs, 21 . 5 | R 2 obs, 21 . 5 # . (5.1) F or the optimal tolerance rate P δ , w e in ve stigate the go o dn ess of fit of the SIR-t yp e mo del. By simulat ing paths of th e SIR m o del asso ciated with p arameters θ sampled from the partial p osterior distribution, w e c hec k if the model repro d uces a p osteriori the observ ed summary statistics [16]. In Figure 5, w e display the P osterior Predictiv e Distribu tions (PPD) of different summary statistics. Figure 5 has b een obtained b y considering the t w o su fficien t sum m ary statistics R 1 and R 2 , using the optimal tole rance rates of P δ 1 = P δ 2 = 1%, and considering the mo del of frequency dep endence (second rate in (2.1)). Th e cumulat ed num b er of detected individuals are contai n ed in the ranges of th e PPDs. By con tr ast, the mean so journ time in the class I is not con tained in the PPD and the observ ed n umb er of inf ectious ind ivid uals is in the lo wer tail of the P PD. An explanation migh t b e that an age-structure has to b e tak en in to account for th e infection rate in order to capture the non-Mark o vian effects ( e.g. [25]). A mo del with an in creasing in fection rate could d iminish the mean so journ time in the class I and increase by comp ensation the n u mb er of infections to maintai n the infection pressu re constan t. When considerin g th e m o del with a mass action principle (first r ate in (2.1)), we observed (see Figure 3 of the supplement ary material) that the statistic R 1 obs, 21 . 5 is not conta ined in the PPD. With a mass action principle, the rate of con tact-tracing detection increases linearly with the con tribution of th e d etected individuals, and that is to o rapid in comparison with the data. Last, w e fi nd that the PP Ds obtai ned with the NCH method h a v e ext remely wide supp orts for b oth rates of con tact-tracing detection (see Figure 4 of the supp lementary material ). These large PPDs su ggest that the summary statistics measuring th e detections and the in fections may con tain conflicting signals, w hic h results in a large v ariance of the partial p osterior d istribution. T o pro vide p oint estimates and CIs, w e consider th e mo d el that pro vides the b est fit (mo d el with frequ ency dep enden ce fitted with the t w o tra jectories R 1 and R 2 ). F or p oin t estimation, w e compute the p osterior mo de. The estimate of λ 1 is 5 . 4 × 10 − 8 (95%CI [3 . 9 × 10 − 8 ; 2 . 3 × 10 − 7 ]), the estimate of λ 2 is 0.13 (95%CI [0 . 007 ; 1 . 17]), and the estimate of λ 3 is 0 . 19 (95%CI [0 . 03; 0 . 82]). The p oin t estimate of the rate of in fection λ 1 implies that the net rate of infection p er infectious individuals λ 1 S is equal to 0 . 32 (95%CI [0 . 23; 1 . 37 ]). This means th at th e wait ing time b efore an infectious individu al, that has not b een detected y et, inf ects an other in dividual is 3 . 1 y ears (95%CI [0 . 72; 4 . 34]). 5.2 The dynamic of the Cuban HIV-AIDS epidemic Reconstruction of the cum ulativ e num b ers of de t ections Figure 6 displa ys the dynam- ics p redicted by the SIR mo del for th e num b ers of individu als detected b y random screening, con tact-tracing and for the n umb er of unknown infectious individ uals. Interestingl y , there is a really go o d fi t b et w een th e real and pr edicted num b ers of individu als d etected by random screening except b et we en 1992 and 1995. This p eriod corresp onds to the p erio d of crisis that follo wed the collapse of the S oviet Union and du ring wh ich the HIV detection system r eceiv ed less atten tion. W e also fin d a sligh t discrep an cy in the recen t y ears (2000-2007 ) b et wee n the real and pred icted num b ers of detections b y con tact-tracing, whic h ma y reve al a we ake nin g in 9 the con tact-tracing sys tem. An exp lanation is that a new mo d e of detectio n, related to conta ct- tracing but still counted as random detection, h as b een develo p ed. Th is new t yp e of detection is promoted by the family do ctors w ho ask to their p atien ts the names of individuals at risk (H. De Arazoza, p ersonal comm unication). P erformance of the con tact-tracing system When testing the p erform an ce of con tact- tracing, [18] computed the cov erage of the epid emic defined as the p ercenta ge of infectious individuals that hav e b een detected ( R 1 + R 2 ) / ( I + R 1 + R 2 ). As displa y ed by Figure 6, th e SIR mo d el predicts a co verage of 62% (95%CI [36%; 66%]) in 200 0 that is muc h lo wer than a co verage of 83% (95%CI [75%; 87%]) as inferred by [18]. Ho w ever, since the P P Ds of Figure 5 sho w that the SIR mo d el pr edicts less infectious individu als than observ ed, the co v erage migh t still b e o ve restimated and would consequently b e ev en smaller than 62%. Using this estimation of the co v erage, w e can compare the r ates of d etectio n b y r andom screening and con tact-traci n g p er in fectious ind ividual. The estimated p er capita rate of r an- dom s creening is λ 2 = 0 . 13. The p er capita rate of con tact-tracing equals λ 3 P i ∈ R exp( − c ( t − T i )) / ( I t + P i ∈ R exp( − c ( t − T i ))). Using a zero-o rd er expansion, w e fi n d that this rate can b e appro ximated by the p ro duct of λ 3 with the co verag e of the epid emic. Hence, the p er capita rate of con tact-tracing can b e estimated as 0 . 19 × 0 . 6 2 ≈ 0 . 12 that is almost equal to λ 2 . Predictions Additionally , simulat ions of the SI R mo del p ro vide predictions for the evo lu- tion of th e HIV d ynamic in th e forthcoming y ears. The SI R m o del pred icts that in 2015, 42 , 000 (95%CI [29 , 000; 107 , 000]) ind ividuals will b e infected since th e b eginnin g of the epi- demic in C u ba. Among these infect ed individuals, a p rop ortion of 45% (95%CI [29%; 46%]) will b e detected by random screening and a prop ortion of 21% (95%CI [10%; 22%]) by con tact- tracing. As displa yed by Figure 6, the S IR-t yp e mo del with con tact-traci n g pr edicts that the total prop ortion of ind ividuals detected by con tact-tracing will reac h an asymptote of 32% (95%CI [25%; 33%]) in 2015. The total n umb er of in f ected individu als in 2015 corresp ond s to 27 , 000 (95%CI [19 , 000; 80 , 00 0]) new cases of HIV b etw een July 2007 an d January 2015. In the same p erio d of time, th e SIR mo del predicts th at 12 , 000 individuals (95%CI [9 , 000; 24 , 000 ]) will b e detected by random screenin g and 6 , 000 individuals (95%CI [4 , 000; 8 , 000]) b y con tact- tracing. 6 Conclusions In the con text of temp oral epidemiological d ata, ABC tec hn iques can provide accurate estimates of the parameters of interest suc h as the in fection and detection rates [19, 28]. ABC relies on sim ulations of the mo d el and can therefore b e applied to v arious epid emiologic al mo dels. F or p artially observ ed p opulation and m iss ing infectious times, MCMC metho d s require to reconstruct the un kno wn data wh ic h can b e highly compu tationally intensiv e for large p opu- lations. F or instance, [21] and [25] considered MCMC algorithms for p opulations consisting of ab out 100 ind ividuals whereas the Cub an HIV-AIDS database con tains almost 10,000 kno wn HIV p ositive individu als, whic h m ak es th e total (kno wn an d unkno wn) num b er of in f ectious individuals ev en larger. When the dimension of the missing data, the infection times h ere, is b oth large and unknown, data imputation with MCMC can b e compu tationally v ery demand ing and takes several da ys on a parallelized system [24]. Ho w ev er, compared with the abund an t MCMC literature, the exp erience of stati sticians with ABC is still rather limited. F or MCMC algorithms, theoretical con v ergence results [26] as well as practical metho d s for monitoring n u m erical con v ergence are a v ailable [15]. Although theoretic al results are no w a v ailable for ABC [5], there is n o metho d for ev aluating the t wo appro ximations inherent to ABC (S ection 3.1). Here, we are in a fav orable situation sin ce the full su mmary 10 statistics are su fficien t so that th e partial and the fu ll p osterior are the sa me. Ho wev er, for the second approxima tion, the practic e of co nd itional densit y estimation in high dimensions remains an issue. When comparing p osterior distrib utions obtained with MCMC and ABC for a standard SIR mo del, w e find the same mo des provided that the tolerance r ate is small enough. Ho w ev er, ev en for the smallest tolerance rate, we find that ABC generates p osterior distribu tions with larger tails compared with MCMC. More generally , ABC applications ha ve b een restricted to mo dels with mo derate num b er of paramete rs w hereas MCMC applications can in vol ve a v ery large n umb er of parameters ([22]). F or mo dels with a substantia l num b ers of parameters, adaptiv e ABC algorithms that use th e sim ulations to mo dify the sampling d istribution of th e parameter θ , might constitute interesting wa ys to explore f or the futur e of ABC in epidemiology [23, 2, 27]. In th is pap er, w e consider b oth finite and in finite dimensional summary statistics f or ABC. When comparing ABC w ith the tw o differen t sets of statistics, w e find th at the p oin t estimates of the parameters λ 1 , λ 2 , λ 3 , with the smallest quadratic errors are obtained with the r ejection metho d based on the infin ite-dimensional statistics. Ho w ever, the 95% CIs obtained w ith this metho d are large and criti cally dep end o n the tolerance rate. By con trast, regression-based adjustment m etho ds, and the NCH metho d more particularly , considerably shorten the CIs and are less sensitiv e to the tolerance rate. Applications of regression-based ABC metho ds constitute therefore a solution for ‘stabilizing’ the C Is. Ho w ev er, no ABC w ith regression adjustment ha ve b een dev elop ed so f ar for infinite-dimensional summary statistics. In the last section of the pap er, w e calibrate the SIR mod el to the Cuban HIV-AIDS d ata. By comparing the p osterio r predictive distributions of the total num b er of detections, we find that the mo del with a frequency-dep en den t rate of con tact-tracing p ro vides the b est fit to the data. Using this mo del, we compare the p resen t-da y rates of cont act-tracing and random screening. W e find that they are almost th e same and equal to 0 . 13/individual/y ear. Conv ertin g r ates of detection to w aiting times b efore d etectio n s , w e find that the w aiting time b efore an individual infected to day w ill b e detected is equal to 1 / (2 × 0 . 13) ≈ 3 . 8 y ears. A t the time of detection, b oth t yp es of detection are equally p robable. Although it suggests that con tact-tracing d etection con tributes imp ortan tly to HIV screening in Cuba, w e fin d that the screening migh t hav e b een largely incomplete. The p ercen tage of und etected individuals among the infectious ind ividuals migh t ha ve b een underestimated [18] and w ould b e of the order of 40%. Ac kno wledgmen ts The authors are grateful to Pr. H. De Arazoza of the Univ ersit y of La Hav ana and to Dr. J. P erez of the National Ins titute of T ropical Diseases in Cu ba for gran ting them access to the HIV- AIDS database. This w ork has b een supp orted by the ANR Viroscop y (ANR-08-SYSC-016 -03), the ANR MANEGE (ANR-09-BLAN-02 15-01), and by the Rhˆ one-Alp es Institute of Complex Systems (IXXI). The authors th ank the anonymous referees for their v aluable su ggestions. supplemen tary mate rials Supp lemen tary material is a v ailable at ht tp://www.b iostatistic s.oxfo rd journals.org References [1] H.T. Banks, J.A. Burn s, and E.M. Cliff. Paramet er estimation and id en tification for systems with d ela ys . SIAM Journal of Contr ol and Optimization , 19(6):791– 828, 1981. 11 [2] M.A. Bea umont, J.-M. Marin, J.-M. Corn uet, and C.P . Rob ert. Adaptiv e appro ximate ba y esian compu tation. Biometrika , 96(4):98 3–990, 2009. [3] M.A. Beaumont, W. Zhang, and D.J. Balding. Appro ximate Ba yesia n computatio n in p opulation genetics. Genetics , 162:202 5–2035, 2002. [4] N.G. Bec ker and T. Britton. Stati stical stud ies of in fectious disease incidence. Journa l of the R oyal Statistic al So ci ety: Series B , 61(2):2 87–307, 1999. [5] M.G. Blum. App ro ximate Ba y esian C omputation: a non-parametric p ersp ectiv e. Journal of the Americ an Statistic al Asso ciation , 2009. to app ear. [6] M.G.B. Blum a nd O. F ran¸ cois. Non-linear regression mo dels for Appro xim ate Ba yesia n Computation. Statistics and Computing , 20:63–73, 2010. [7] J.A. Burns, E.M. Cliff, and S.E. Dough t y . Sensitivit y analysis and parameter estimatio n for a mo del of Chlamydia Trachomat is infection. Journal of Inverse Il l-Pose d Pr oblems , 15:19– 32, 2007. [8] S. Cauc hemez, F. Carrat, C. Vib oud, A. J. V alleron, and P . Y. Bo elle. A Ba ye sian MCMC approac h to study transmission of in fluenza: application to h ousehold longitudinal d ata. Statistics in Me dicine , 23:3469 –3487, 2004. [9] S. Cauc hemez and N.M. F erguson. Lik eliho o d -based estimation of contin uous -time epidemic mo dels from time-series d ata: app lication to measles transmission in london. Journal of the R oyal So ciety Interfac e , 5:885–897 , 2008 . [10] S. Cl ´ emen¸ con, V.C. T ran, and H. De Arazoza. A s to c hastic S IR mo del with conta ct-tracing: large p opu lation limits and statistical inferen ce. Journal of Biolo gi c al D ynamics , 2(4):392 – 414, 2008. [11] H. de Arazoza, J. Joanes, R. Lounes, C. Legeai, S. Cl´ emen ¸ con, J. P erez, and B. Auvert. The HIV/AIDS epidemic in C uba: description and ten tativ e explanation of its lo w prev alence. BMC Infe ctious D ise ase , 7:130, 2007. [12] H. d e Arazoza, R. Loun es, J . P erez, and T. Hong. What p ercen tage of the cuban HIV-AIDS epidemic is known. R ev Cub ana Me d T r op , 55:30–37, 2003. [13] J. F an. Design-adaptiv e nonparametric regression. Journal of the Americ an Statistic al Asso ciation , 87(420) :998–1004, 1992. [14] B.F Fink enst¨ adt, O.N. Bjørnstad, and B.T. Gr enfell. A s to c hastic mo del f or extinction and recurrence of ep id emics: estimation and inference for measles outbr eaks. Biostatistics , 3:493– 510, 2002. [15] A. Gelman. Inference and monitoring con ve rgence. I n W.R. Gilks, S. Ric hardson, and D.J. Spiegelhalter, editors, Markov c hain M onte Carlo in pr actic e , p ages 131–1 44. Ch apman & Hall, 1996 . [16] A. Gelman and X-L Meng. Mo del chec king and model impro vment . In W.R. Gilks, S. Ric hardson, and D.J. S piegelhalter, editors, Markov chain Monte Carlo in pr actic e . Chapman & Hall, 1996. [17] W.R. Gilks and G.O. R ob erts. S trategies for improving MCMC. In W.R. Gilks, S. Ric hard- son, and D.J. Spiegelhalter, editors, Markov chain Monte Carlo in pr actic e . Ch apman & Hall, 1996 . 12 [18] Y.H. Hsieh, H. de Arazoza, S.M. Lee, and C.W. C hen. Estimating the num b er of Cubans infected sexually by h u man imm un o deficiency virus us in g co ntac t tr acing data. Int. J. Epidemiol. , 31(3) :679–83, 2002 . [19] T. McKinley , A. R. Co ok, and R. Deardon. Inference in epidemic mo dels without likeli- ho o ds. The International J ournal of Biostatistics , 5(1), 2009. [20] P .D. O’Neill. A tutorial in tro du ction to Ba yesia n inferen ce for sto chastic epidemic mo dels using Marko v chain Mont e C arlo metho ds. Mathema tic al Bioscienc es , 180:103–1 14, 2002. [21] P .D. O’Neill and G.O. Rob erts. Ba y esian inference f or partially observ ed sto c hastic epi- demics. Journal of the R oyal Statistic al So ciety: Series A , 162:121 –129, 1999. [22] J. K. Pritchard, M. Stephens, and P . Donnelly . In ference of p opu lation structure using m ultilo cus genot yp e data. Genetic s , 155:945–9 59, 2002 . [23] S.A. Sisson, Y. F an, and M. T anak a. Sequen tial Mon te Carlo without lik eliho o ds. Pr o c . Nat. A c ad. Sci. USA , 104:1760 –1765, 2007. [24] I. Chis Ster, B.K. Singh, and N.M. F erguson. E pidemiological inference for p artially ob- serv ed epidemics: the example of the 2001 fo ot and mouth epidemic in Great Britain. Epidemics , 1:21–34, 2009. [25] G. Streftaris and G.J. Gib s on. Ba y esian inference for sto c hastic ep id emics in closed p opu- lation. Statistic al Mo del ling , 4(1):63–75 , 200 4. [26] L. T ierney . Mark ov chains for exploring p osterior d istributions. Annals of Statistics , 22(4): 1701–1728 , 1994. [27] T. T oni, D. W elc h, N. Str elko wa , A. Ips en, and M.P . S tumpf. Ap pro ximate Ba y esian computation sc heme for parameter inference and mo del selection in dynamical sys tems. Journal of The R oyal So c i ety Interfac e , 6:187 –202, 2009. [28] D.M. W alk er, D. Allingham, H.W.J. Lee, and M. Small. P arameter inference in small w orld net wo rk disease mo dels w ith Approxima te Ba yesian Compu tational metho ds. P hysic a A , 389:54 0–548, 2010. 13 λ 0 λ 1 SI μ 0 S Susceptible Individuals Infectious Individuals λ 3 R ∈ i e Σ I λ 2 I 2 1 R R Contact Tracing Random Screening Detected Individuals S I μ 1 I R=R +R 1 2 -c(t-T ) i Figure 1: Sc hematic description of the SIR m o del with con tact-tracing. 14 −10 −8 −6 −4 −2 0 2 0.0 0.1 0.2 0.3 0.4 Log λ 1 Density Prior MCMC Posterior ABC Posterior, Tol. rate=1% ABC Posterior, Tol. rate=0.1% −10 −8 −6 −4 −2 0 2 0.0 0.1 0.2 0.3 0.4 0.5 Log λ 2 Density −4 −3 −2 −1 0 1 2 0.0 0.2 0.4 0.6 0.8 1.0 1.2 1.4 Log λ 1 Density Prior MCMC Posterior ABC Posterior, Tol. rate=1% ABC Posterior, Tol. rate=0.1% −3 −2 −1 0 1 2 0.0 0.5 1.0 1.5 Log λ 2 Density a) b) Figure 2: Comparison of the p osterior densities obtained with MCMC and ABC. T h e vertica l lines corresp ond to the v alues of the p arameters used for generating the synt hetic data. a) The data consist of 3 d etectio n times that ha ve b een sim ulated by [21]. b) The data consist of 29 detection times that we sim ulated b y setting λ 1 = 0 . 12, λ 2 = 1, S 0 = 30, I 0 = 1, and T = 5 (see the supplementa ry material for the 29 d etectio n times). 15 Figure 3: Bo xplots of the M = 200 estimated mo des and quan tiles (2 . 5%, 50%, and 97 . 5%) of the partial p osterior distrib utions of λ 1 . F or eac h ABC metho d an d eac h v alue of the tolerance rate, 200 p osterior d istributions are computed for eac h of the 200 syn thetic data sets. The horizon tal lines corresp ond to the true v alue λ 1 = 1 . 14 × 10 − 7 used when sim ulating the 200 syn thetic data sets. The differen t tolerance r ates are 0.01, 0.05, 0.10, 0.25, 0.50, 0.50, 0.75, and 1 for all the ABC m etho ds except the rejection scheme with the tw o summary statistics. F or th e latter method , the tolerance rates are 0.007, 0.02, 0.06, 0.13, 0.27, 0.37, 0.45, 0.53, 0.66 , 0.80, 1. 16 ● ● ● ● ● ● ● 0.0 0.2 0.4 0.6 0.8 1.0 1e−06 1e−04 1e−02 1e+00 RMSE λ λ 1 ● ● ● ● ● ● ● 0.0 0.2 0.4 0.6 0.8 1.0 1e−05 1e−03 1e−01 λ λ 2 ● ● ● ● ● ● ● 0.0 0.2 0.4 0.6 0.8 1.0 0.001 0.005 0.010 0.050 0.100 0.500 1.000 λ λ 3 ● 21 one−dimensional sum stats Reject LOCL NCH 2 infinite dimensional sum stats Reject ● ● ● ● ● ● ● 0.0 0.2 0.4 0.6 0.8 1.0 0.001 0.005 0.010 0.050 0.100 0.500 1.000 RMCI λ λ 1 Tolerance rate ● ● ● ● ● ● ● 0.0 0.2 0.4 0.6 0.8 1.0 0.001 0.005 0.010 0.050 0.100 0.500 1.000 λ λ 2 Tolerance rate ● ● ● ● ● ● ● 0.0 0.2 0.4 0.6 0.8 1.0 0.01 0.02 0.05 0.10 0.20 0.50 1.00 λ λ 3 Tolerance rate Figure 4: Re scaled mean s q u ared error (RMSE) of the p osterior m o de and rescaled mean cred- ibilit y inte rv al (RMCI). 17 Figure 5: Bay esian p osterior predictiv e distrib utions of R 1 21 . 5 , R 2 21 . 5 , I 6 , and the mean so journ time in the class I. The S IR mo del corresp onds to the mo del with fr equency dep en d ence for con tact-tracing detection. The partial p osterior samples are obtained with the smo oth r ejection ABC algorithm b y making use of th e 2 infinite-dimensional summary statisti cs R 1 and R 2 . T olerance rate of P δ 1 = P δ 2 = 1% are considered f or eac h summary statistic. 18 1 10 100 1000 10000 Years R 1 1990 2000 2010 observed trajectory median predicted trajectory 2.5% and 97.5% quantile trajectories 1 10 100 1000 10000 Years R 2 C o v er age 1990 2000 2010 0.0 0.1 0.2 0.3 0.4 0.5 Years R 2 ( ( R 1 + + R 2 ) ) 1990 2000 2010 Hsieh et al. estimate 0.0 0.2 0.4 0.6 0.8 1.0 1990 2000 2010 Coverage Years Figure 6: Median and 95% credibilit y in terv als of the p osterior p redictiv e distributions of R 1 t , R 2 t , R 1 t / ( R 1 t + R 2 t ) and co v erage R t / ( I t + R t ) from 1986 to 2015. T h e co v erage is defined as the prop ortion of kno wn HIV p ositiv e individuals. The p osterior s amples are generated by the rejection scheme with the t wo summary statistic s. A tolerance rate of P δ = 1% is considered f or eac h summary s tatistic. 19
Original Paper
Loading high-quality paper...
Comments & Academic Discussion
Loading comments...
Leave a Comment