Improved Likelihood Inference in Birnbaum-Saunders Regressions
The Birnbaum-Saunders regression model is commonly used in reliability studies. We address the issue of performing inference in this class of models when the number of observations is small. We show that the likelihood ratio test tends to be liberal …
Authors: Artur J. Lemonte, Silvia L. P. Ferrari, Francisco Cribari-Neto
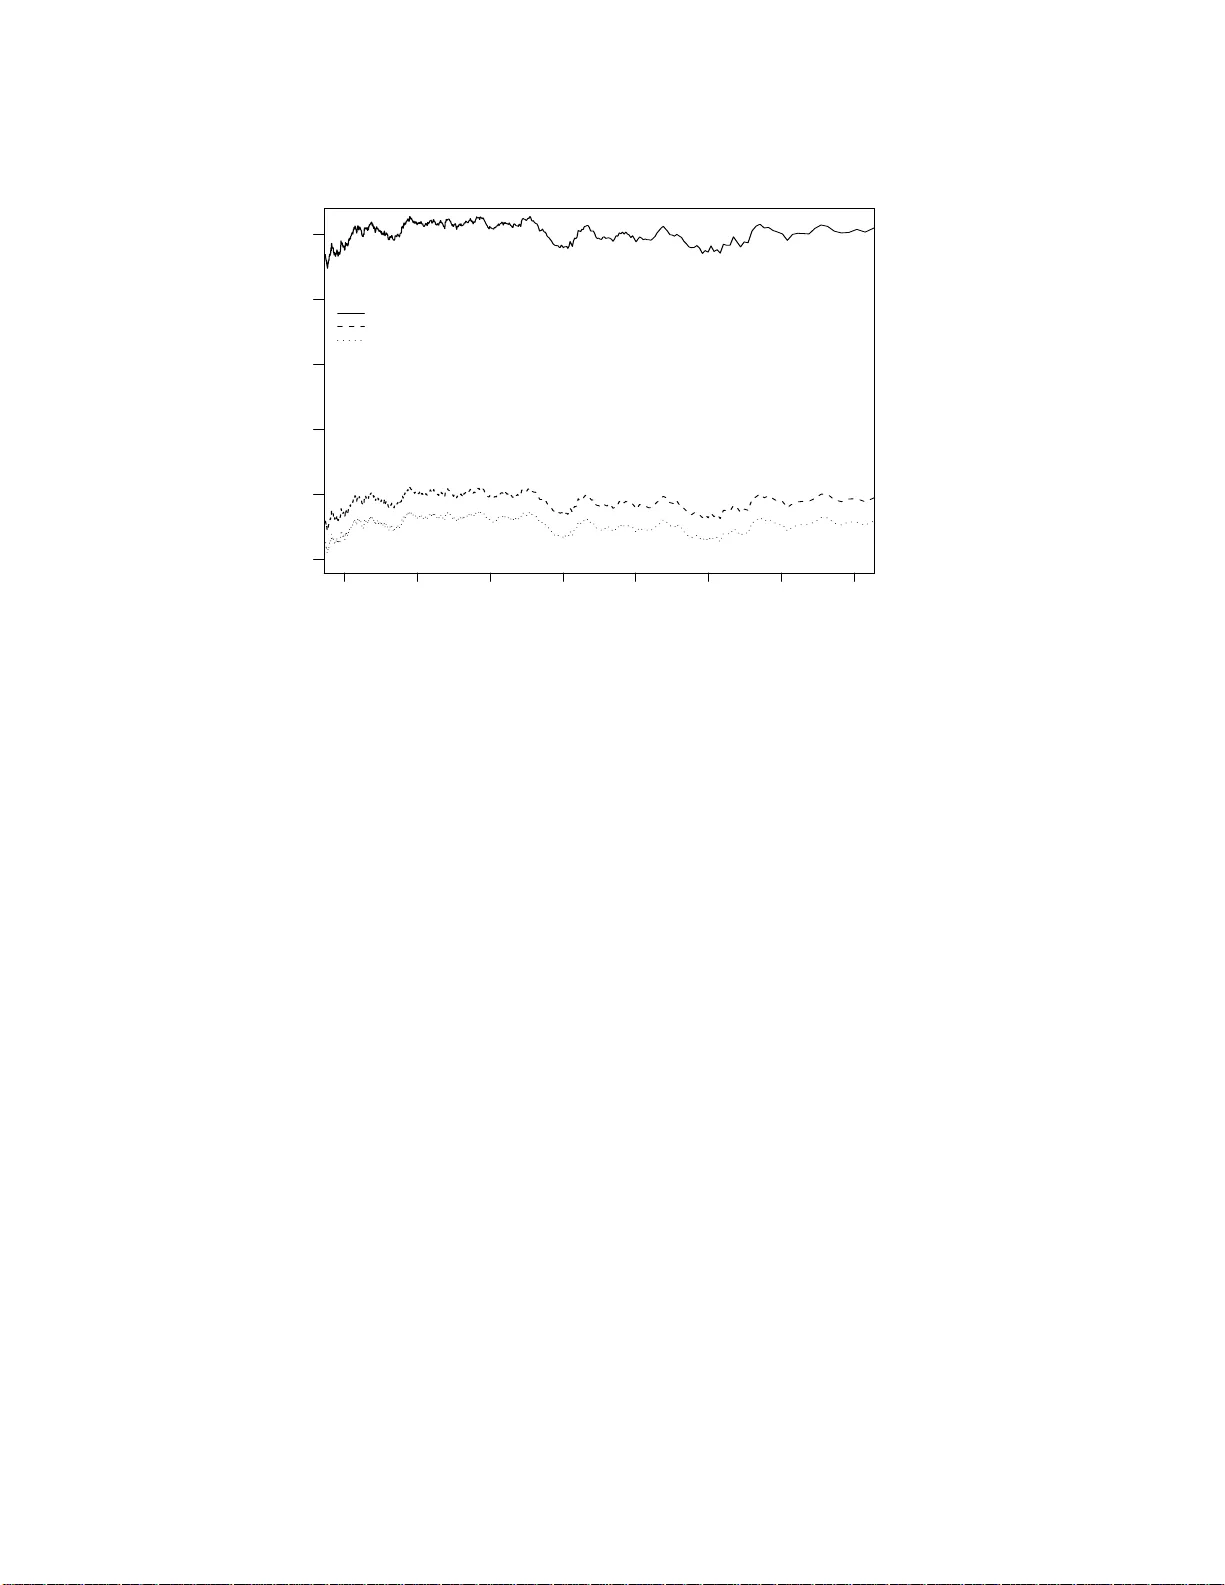
Impro v ed Lik eliho o d Inference in Birn baum–Saunde rs Regressions Artur J. Lemonte, Silvi a L. P . F errari Dep ar tamento d e Estat ´ ıstic a, Universida de de S˜ ao Paulo, R ua do Mat˜ ao, 1010, S˜ ao Paulo/SP, 05508-090 , Br azil F rancisco Criba ri–N et o Dep ar tamento de Estat ´ ıstic a, Universidade F e der al de Pernambuc o, Cidade Universit´ aria, R e cife/PE, 50740-540 , Br azil Abstract The Birnbaum–Saunders regression mo del is commonly used in reliabilit y stu dies. W e address the issue of p erformin g inference in this class of mo d els wh en the n um b er of ob s erv ations is small. Our simulation r esults suggest that th e likel iho o d r atio test tends to b e lib er al when the sample size is small. W e obtain a correction factor w h ic h reduces the size distortion of the test. Also, we consid er a parametric b ootstrap sc heme to obtain impro ved critica l v alues and impro v ed p -v alues for the lik eliho o d ratio test. The numerical results sh o w that the mo difi ed tests are more reliable in finite samples th an th e usual likel iho o d ratio test. W e also p resen t an empirical application. Key wor ds: Bartlett c orrection; Birn baum–Saun ders distribution; Bo otstrap; Lik eliho o d ratio test; Maxim um lik eliho o d estimation. 1 In tro duct ion Differen t mo dels ha v e b een prop osed for lifetime data, suc h as those based on the gamma, lognorma l and W eibull distributions. These mo dels typically pro vide a satisfactory fit in the middle p ortion of the data, but often times fail to deliv er a go o d fit a t the tails, where only a few observ at io ns are generally a v ailable. The family of distributions pro p osed b y Birn baum and Saunders (1969) can a lso b e used to mo del lifetime data. It has t he app ealing feature of prov iding satisfactory tail fitting. This f amily of distributions w as origi- nally obtained from a mo del in which fa ilure follo ws from the dev elopmen t Preprint s ubmitted to Elsevier 23 Octob er 2018 and growth o f a dominan t crac k. It w as later deriv ed by D esmond (1985) us- ing a biolo g ical mo del whic h follow ed from relaxing some of the assumptions originally made by Birnbaum and Saunders (196 9). The random v ariable T is said to b e Birnbaum–Saunders distributed with parameters α, η > 0, denoted B - S ( α , η ), if its distribution function is giv en b y F T ( t ) = Φ 1 α s t η − r η t , t > 0 , (1) where Φ( · ) is the standard normal distribution f unction; α and η are shap e and scale parameters, resp ective ly . It is easy to sho w tha t η is the median of the distribution: F T ( η ) = Φ(0) = 1 / 2. F or a ny k > 0, it follo ws that k T ∼ B - S ( α, k η ). It is a lso notew orthy that the recipro cal prop erty holds: T − 1 ∼ B - S ( α, η − 1 ), whic h is in the same f a mily o f distributions [Saunders (1974)]. Riec k and Nedelman (1991) pro p osed a lo g-linear regression mo del based on the Birn baum–Saunders distribution. They sho w ed that if T ∼ B - S ( α, η ), then y = log ( T ) is sinh-normal distributed with shap e, lo cation and scale parameters give n by α , µ = log ( η ) and σ = 2, r esp ectiv ely [ y ∼ S N ( α , µ, σ )]; see Section 2 for further details. Their mo del ha s b een widely used and is an alternativ e to the usual gamma, lognormal and W eibull regression mo dels; see Riec k and Nedelman (1991, § 7). Diagnostic to ols for the Birnbaum –Saunders regression mo del were dev elop ed b y Galea et al. (2004), Leiv a et a l. ( 2 007) and Xie and W ei (20 07), a nd Bay esian inference w as dev elop ed by Tisionas (2001). Hyp othesis testing inference is usually p erfo r med using the lik eliho o d ratio test. It is w ell kno wn, how eve r, that the limiting null distribution ( χ 2 ) used in the test can b e a p o or approx imation to the exact null distribution of the test statistic when the n um b er of observ ations is small, th us yielding a size- distorted test; see, e.g., the sim ulation results in Riec k and Nedelman (19 9 1, § 5). Consider, for instance, the application in whic h intere st lies in mo del- ing the die lifetime ( T ) in the pro cess of metal extrusion, as in L epadatu et al. (2005). As noted by the authors, the die life is mainly determined by its material prop erties a nd the stresses under load. They also not e t ha t the ex- trusion die is exposed to high temp eratures, whic h can also b e damaging. The co v ariates are the friction co efficien t ( x 1 ), the angle of the die ( x 2 ) a nd w ork temp erature ( x 3 ). Consider a regression mo del whic h also includes in teraction effects, i.e., y i = β 0 + β 1 x 1 i + β 2 x 2 i + β 3 x 3 i + β 4 x 1 i x 2 i + β 5 x 1 i x 3 i + β 6 x 2 i x 3 i + ε i , where y i = log ( T i ) and ε i ∼ S N ( α , 0 , 2), i = 1 , 2 , . . . , n . There are only 15 observ ations ( n = 15 ), a nd w e wish to test the significance of the in teraction 2 effects, i.e., the in terest lies in testing H 0 : β 4 = β 5 = β 6 = 0. The lik eliho o d ratio p -v alue equals 0.094, i.e., one rejects the null hy p ot hesis at the 10% nom- inal leve l. Note, how ev er, that the p -v alue is close to the significance lev el of the test and that the n um b er of observ ations is small. Can the inference made using the likelih o o d ra t io test b e t rusted? W e shall return t o t his application in Section 6. The chief goal of our pap er is to improv e lik eliho o d ratio inference in Birn baum– Saunders regressions when the num b er of observ ations av ailable to the prac- titioner is small. W e do so b y follo wing tw o differen t approa ches . First, w e deriv e a Ba rtlett correction factor that can b e applied to the lik eliho o d ra tio test statistic. The exact null distribution of the mo dified statistic is generally b etter approx imated by the limiting null distribution use d in the test than that of the unmo dified t est statistic. Second, w e consider a parametric b o otstrap resampling sc heme to obtain improv ed critical v alues and improv ed p -v alues for the lik eliho o d r a tio test. The pap er unfolds as f ollo ws. Section 2 in tro duces the Bir nbaum–Saunders regression mo del. In Section 3, w e derive a Bartlett correction to the lik eliho o d ratio test statistic; w e giv e a closed-for m expression for the correction factor in matr ix form. Sp ecial cases a r e considered in Section 4 . Numerical evidence of the effectiv eness of the finite sample correction w e obt a in is presen ted in Section 5; w e also ev alua t e b o o tstrap-based inference. Section 6 addresses the empirical application introduced ab ov e (inferences on die lifetime in metal extrusion). Finally , concluding remarks are offered in Section 7. 2 The Birnba um–Saunders regression mo del The densit y function of a Birnbaum–Saunders v ariate T is f T ( t ; α, η ) = 1 2 αη √ 2 π η t 1 / 2 + η t 3 / 2 exp − 1 2 α 2 t η + η t − 2 , where t, α, η > 0. The densit y is right ske w ed, the sk ewness decreasing with α ; see Lemon te et a l. (2007, § 2). The mean and v ariance o f T a re, resp ectiv ely , E ( T ) = η 1 + 1 2 α 2 ! and V ar( T ) = ( αη ) 2 1 + 5 4 α 2 ! . McCarter (199 9) considered B - S ( α, η ) parameter estimation under type I I data censoring. Lemon te et a l. (20 0 7) derive d the second order biases of the maxim um lik eliho o d estimators of α and η , and obtained a corrected lik eliho o d 3 ratio statistic for testing h yp otheses regarding α . Lemon te et al. (2 008) pro- p osed sev eral b o o t strap bias-corrected estimators of α and η . F urther details on the Birnbaum–Saunde rs distribution can b e fo und in Johnson et a l. (1995). The B - S ( α, η ) surviv al function is S T ( t ) = 1 − F T ( t ), where F T ( t ) is given in (1). The hazard function is ν ( t ) = f T ( t ) /S T ( t ), where f T ( t ) is the corre- sp onding densit y f unction. The hazard function ν ( t ) equals zero at t = 0, increases up to a maxim um v alue and t hen decreases t o w ards a giv en p osi- tiv e lev el; see Kundu et al. (2008 ). F or a comparison b et w een the Birn baum– Saunders and log normal hazard functions, see Nelson (19 90). As noted in the previous section, Riec k and Nedelman ( 1991) show ed that if T ∼ B - S ( α , η ), then y = log( T ) f o llo ws a sinh-normal distribution with the follo wing shap e, lo cation and scale parameters: α , µ = log( η ) a nd σ = 2, resp ectiv ely , denoted y ∼ S N ( α , µ, σ ). The densit y function of y is f ( y ; α, µ, σ ) = 2 ασ √ 2 π cosh y − µ σ ! exp ( − 2 σ 2 sinh 2 y − µ σ !) , y ∈ I R . This distribution has a n um b er of in teresting a nd attra ctiv e prop erties [see Riec k ( 1 989)]: (i) It is symmetric around the lo cation pa rameter µ ; (ii) It is unimo dal for α ≤ 2 and bimo dal for α > 2; (iii) The mean and v ariance of y are E ( y ) = µ and V ar ( y ) = σ 2 w ( α ), resp ectiv ely . There is no closed-form expression for w ( α ), but Riec k (1989 ) obta ined a symptotic appro ximations for b oth small and larg e v alues of α ; (iv) If y α ∼ S N ( α, µ, σ ), then S α = 2( y α − µ ) / ( ασ ) con v erges in distribution to the standard normal distribution when α → 0. Riec k and Nedelman (1991) prop osed the follo wing regression mo del: y i = x ⊤ i β + ε i , i = 1 , 2 , . . . , n, (2) where y i is the loga rithm of the i th observ ed lifetime, x ⊤ i = ( x i 1 , x i 2 , . . . , x ip ) con tains the i th observ ation on the p cov ariates ( p < n ), β = ( β 1 , β 2 , . . . , β p ) ⊤ is a v ector o f unknown regr ession parameters, and ε i ∼ S N ( α, 0 , 2). The log-lik eliho o d function for a ra ndom sample y = ( y 1 , . . . , y n ) ⊤ from (2 ) can b e written as ℓ ( θ ; y ) = − n 2 log(8 π ) + n X i =1 log( ξ i 1 ) − 1 2 n X i =1 ξ 2 i 2 , (3) where θ = ( β ⊤ , α ) ⊤ , ξ i 1 ( θ ) = ξ i 1 = 2 α cosh y i − µ i 2 ! , ξ i 2 ( θ ) = ξ i 2 = 2 α sinh y i − µ i 2 ! 4 and µ i = x ⊤ i β , i = 1 , 2 , . . . , n . By differen tiating (3) with resp ect to β r and α , w e obtain ∂ ℓ ( θ ) ∂ β r = 1 2 n X i =1 x ir ( ξ i 1 ξ i 2 − ξ i 2 ξ i 1 ) , r = 1 , 2 , . . . , p, and ∂ ℓ ( θ ) ∂ α = − n α + 1 α n X i =1 ξ 2 i 2 . The score function for β can b e written in matrix form as U β ( θ ) = U β = ∂ ℓ ( θ ) ∂ β = 1 2 X ⊤ s , where X = ( x 1 x 2 · · · x n ) ⊤ is the n × p design matrix ( which is a ssumed to ha v e full column r a nk) and s = s ( θ ) is an n -v ector whose i th elemen t equals ξ i 1 ξ i 2 − ξ i 2 /ξ i 1 . Riec k and Nedelman (1 9 91) obtained a closed-for m expression for the maxi- m um likelih o o d estimator (MLE) of α 2 : b α 2 = 4 n n X i =1 sinh 2 y i − x ⊤ i b β 2 ! , where b β is the MLE of β . There is no closed-form expression for the MLE of β . Hence, one has to use a nonlinear optimization metho d, suc h as Newton- Raphson or Fisher’s scoring, to obtain b β . 1 Let b θ = ( b β ⊤ , b α ) ⊤ b e the MLE of θ = ( β ⊤ , α ) ⊤ . Rieck and Nedelman (1991) sho w ed that b θ A ∼ N p +1 ( θ , K ( θ ) − 1 ), when n is large, A ∼ denoting approximately distributed; K ( θ ) is F isher’s information matrix a nd K ( θ ) − 1 is its in v erse. Also, K ( θ ) is a blo c k-diagnonal matrix giv en by K ( θ ) = diag { K ( β ) , κ α,α } : K ( β ) = ψ 1 ( α )( X ⊤ X ) / 4 is Fisher’s informat io n for β and κ α,α = 2 n/ α 2 is the information relativ e to α . Also, ψ 0 ( α ) = ( 1 − erf √ 2 α !) exp 2 α 2 and ψ 1 ( α ) = 2 + 4 α 2 − √ 2 π α ψ 0 ( α ) , (4) erf ( · ) denoting the erro r function: erf ( x ) = 2 √ π Z x 0 e − t 2 d t. 1 All log-lik eliho o d maximizations with resp ect to β and α in this pap er were carried out using the BF GS q u asi-Newton metho d with analytic fir st deriv ativ es; see Press et al. (1992) . The initial v alues in the iterativ e BF GS sc heme w ere e β = ( X ⊤ X ) − 1 X ⊤ y f or β and √ e α 2 for α , w here e α 2 is obtained fr om b α 2 with b β replaced b y e β . 5 Details on erf ( · ) can b e found in Gradsh teyn and Ryzhik (2007). Since K ( θ ) is blo ck -diag o nal, β and α are glo bally orthogona l [Cox and Reid (1987)] and b β and b α are asymptotically indep enden t. It can b e show n that when α is small, ψ 0 ( α ) ≈ α/ √ 2 π and ψ 1 ( α ) ≈ 1 + 4 / α 2 ; when α is large, ψ 0 ( α ) ≈ 1 and ψ 1 ( α ) ≈ 2. 3 An impro v ed lik eliho o d ratio t est Consider a parametric mo del f ( y ; θ ) with corresp onding log-likelihoo d func- tion ℓ ( θ ; y ), where θ = ( θ ⊤ 1 , θ ⊤ 2 ) ⊤ is a k -v ector of unkno wn parameters. The dimensions of θ 1 and θ 2 are k − q and q , respectiv ely . Supp ose the intere st lies in testing the comp osite n ull hypothesis H 0 : θ 2 = θ (0) 2 against H 2 : θ 2 6 = θ (0) 2 , where θ (0) 2 is a giv en v ector of scalars. Hence, θ 1 is a v ector of n uisance pa- rameters. The log-likelihoo d r atio test statistic can b e written as LR = 2 n ℓ ( b θ ; y ) − ℓ ( e θ ; y ) o , (5) where b θ = ( b θ ⊤ 1 , b θ ⊤ 2 ) ⊤ and e θ = ( e θ ⊤ 1 , θ (0) ⊤ 2 ) ⊤ are the MLEs o f θ = ( θ ⊤ 1 , θ ⊤ 2 ) ⊤ obtained from the maximization of ℓ ( θ ; y ) under H 1 and H 0 , resp ectiv ely . Bartlett (1937 ) computed the exp ected v alue of LR under H 0 up to order n − 1 : E ( LR ) = q + B ( θ ) + O ( n − 2 ), where B ( θ ) is a constant of o r der O ( n − 1 ). It is p ossible to show that, under the null h yp othesis, the mean of the mo dified test statistic LR b = LR 1 + B ( θ ) /q equals q when w e neglect terms of o rder O ( n − 2 ). The order of the appro xima- tion r emains unc hanged when the unknow n parameters in B ( θ ) are replaced b y their restricted MLEs. Additiona lly , whereas Pr( LR ≤ z ) = Pr( χ 2 q ≤ z ) + O ( n − 1 ), it follo ws t ha t Pr( LR b ≤ z ) = Pr( χ 2 q ≤ z ) + O ( n − 2 ), a clear impro v emen t. The correction factor c = 1 + B ( θ ) /q is commonly refered to as the ‘Bartlett correction f actor’. Note that LR can b e written as LR = 2 n ℓ ( b θ ; y ) − ℓ ( θ ; y ) o − 2 n ℓ ( e θ ; y ) − ℓ ( θ ; y ) o , where ℓ ( θ ; y ) is the log-lik eliho o d function at the true par a meter v alues. La w- ley (1956) has show n that 2 E h ℓ ( b θ ; y ) − ℓ ( θ ; y ) i = k + ǫ k + O ( n − 2 ) , 6 where ǫ k is of order O ( n − 1 ) and is giv en b y ǫ k = X ′ ( λ r stu − λ r stuvw ) , (6) where P ′ denotes summation o v er all comp onen ts of θ , i.e., the indices r , s, t, u , v and w v ary ov er all k parameters, and the λ ’s are giv en b y λ r stu = κ r s κ tu κ r stu 4 − κ ( u ) r st + κ ( su ) r t , λ r stuvw = κ r s κ tu κ vw κ r tv κ suw 6 − κ ( u ) sw + κ r tu κ svw 4 − κ ( v ) sw + κ ( v ) r t κ ( u ) sw + κ ( u ) r t κ ( v ) sw , (7) where κ r s = E ( ∂ 2 ℓ ( θ ) /∂ θ r ∂ θ s ), κ r st = E ( ∂ 3 ℓ ( θ ) /∂ θ r ∂ θ s ∂ θ t ), κ ( t ) r s = ∂ κ r s /∂ θ t , etc., and − κ r s is the ( r , s ) elemen t of Fisher’s information matrix inv erse. Analogously , 2 E h ℓ ( e θ ; y ) − ℓ ( θ ; y ) i = k − q + ǫ k − q + O ( n − 2 ) , where ǫ k − q is of order O ( n − 1 ) and is obta ined from (6) when the sum P ′ only co v ers the comp onents of θ 1 , i.e., the sum ranges ov er the k − q nuisance parameters, since θ 2 is fixed under H 0 . Under H 0 , E ( LR ) = q + ǫ k − ǫ k − q + O ( n − 2 ). Th us, it is p ossible to ac hiev e a b etter χ 2 q appro ximation b y using the mo dified test stat istic LR b = LR/ c instead o f LR , the Bartlett correction factor b eing c = 1 + B ( θ ) /q , where B ( θ ) = ǫ k − ǫ k − q . The corrected statistic LR b is χ 2 q distributed up to order O ( n − 1 ) under H 0 . The impro v ed test follows from the comparison of LR b and the critical v alue o btained as the appropria t e χ 2 q quan tile. The corrected test statistic is usually written as LR b = LR/ { 1 + B ( θ ) / q } . Nonetheless, there are a lt ernativ e mo dified statistics that are equiv alen t to LR b to order O ( n − 1 ), suc h as LR ∗ b = LR exp {− B ( θ ) /q } and LR ∗∗ b = LR { 1 − B ( θ ) /q } . It is notew orthy that LR ∗ b has a n adv antage o v er the other tw o sp ecifications: it nev er a ssumes negativ e v alues. See Cribari–Neto and Cordeiro (1996) for further details on Bartlett corrections. In what follows, w e shall deriv e the Bartlett correction factor for t esting in- ference in the Birnbaum–Saunders regression mo del. The parameter vec tor is θ = ( β ⊤ , α ) ⊤ , whic h is ( p + 1)-dimensional. Hence, w e shall obtain ǫ p +1 from (6), with the indices v arying fro m 1 up to p + 1. Let Z = X ( X ⊤ X ) − 1 X ⊤ = { z ij } a nd Z d = diag { z 11 , z 22 , . . . , z nn } . Also, Z (2) = Z ⊙ Z , Z (2) d = Z d ⊙ Z d , etc., ⊙ denoting the Hadamard (elemen t- wise) pro duct of matrices. W e shall use the following notatio n for cum ulan ts of lo g-lik eliho o d deriv ativ es with resp ect to β and α : U r = ∂ ℓ ( θ ) /∂ β r , U α = 7 ∂ ℓ ( θ ) /∂ α , U r s = ∂ 2 ℓ ( θ ) /∂ β r ∂ β s , U r α = ∂ 2 ℓ ( θ ) /∂ β r ∂ α , U αα = ∂ 2 ℓ ( θ ) /∂ α 2 , U r st = ∂ 3 ℓ ( θ ) /∂ β r ∂ β s ∂ β t , U r sα = ∂ 3 ℓ ( θ ) /∂ β r ∂ β s ∂ α , etc; κ r s = E ( U r s ), κ r α = E ( U r α ), κ r st = E ( U r st ), etc; κ ( t ) r s = ∂ κ r s /∂ β t , κ ( tα ) r α = ∂ 2 κ r α /∂ β t ∂ α , etc. F ro m the lo g-lik eliho o d function in (3) w e obt a in the following cum ulants: κ r s = − ψ 1 ( α ) 4 n X i =1 x ir x is , κ r α = 0 , κ αα = − 2 n α 2 , κ r st = 0 , κ r sα = 2 + α 2 α 3 n X i =1 x ir x is , κ r αα = 0 , κ ααα = 10 n α 3 , κ r stu = ψ 2 ( α ) n X i =1 x ir x is x it x iu , κ r stα = 0 , κ r sαα = − 3(2 + α 2 ) α 4 n X i =1 x ir x is , κ r ααα = 0 and κ αααα = − 54 n α 4 , where ψ 2 ( α ) = − 1 4 ( 2 + 7 α 2 − r π 2 1 2 α + 6 α 3 ! ψ 0 ( α ) ) and ψ 0 ( α ) and ψ 1 ( α ) are defined in (4). F o r small α , we hav e ψ 2 ( α ) ≈ − 5 / 8 − 1 /α 2 ; f o r la rge α , ψ 2 ( α ) ≈ − 1 / 2. Using these cum ulants a nd also making use of t he orthogo na lity b et wee n β and α , w e obtain, af ter long and tedious algebra (App endix), ǫ p +1 = ǫ ( α, p, X ), where ǫ ( α, p, X ) = ǫ α ( α, p ) + ǫ β ( α, X ) , (8) with ǫ α ( α, p ) = 1 n ( 1 3 + δ 1 ( α ) p + δ 2 ( α ) p 2 ) and ǫ β ( α, X ) = δ 3 ( α )tr( Z (2) d ) . Here, tr( · ) denotes the tr a ce op erator and δ 0 ( α ) = 2 + α 2 ψ 1 ( α ) α 2 , δ 1 ( α ) = 4 δ 0 ( α ) ( 2 2 + α 2 + δ 0 ( α ) − 2 αψ 3 ( α ) ψ 1 ( α ) ) , δ 2 ( α ) = 2 δ 0 ( α ) 2 , δ 3 ( α ) = 4 ψ 2 ( α ) ψ 1 ( α ) 2 and ψ 3 ( α ) = 3 α 3 − √ 2 π 4 α 2 1 + 4 α 2 ! ψ 0 ( α ) . In expression (8) – our main result – w e write ǫ p +1 as the sum of t w o terms, namely ǫ α ( α, p ) and ǫ β ( α, X ). The quan tity ǫ β ( α, X ) is obtained from (6) with P ′ ranging o v er the comp onen ts of β , i.e. as if α w ere kno wn. The quan tit y ǫ α ( α, p ) is the contribution yielded b y the fa ct that α is unkno wn (see the App endix). Note that ǫ α ( α, p ) dep ends on the design mat r ix only thro ugh it s rank. More sp ecifically , it is a second degree p olynomial in p divided b y n . Hence, ǫ α ( α, p ) can b e non-negligible if the dimension of β is not considerably 8 smaller than the sample size. It is also not eworth y that ǫ ( α , p, X ) dep ends on α but not on β . The dep endency of ǫ ( α , p, X ) on α o ccurs through δ 1 ( α ), δ 2 ( α ) a nd δ 3 ( α ). F or small α , w e hav e δ 1 ( α ) ≈ 1, δ 2 ( α ) ≈ 1 / 2 and δ 3 ( α ) ≈ 0. F o r la r ge α , δ 1 ( α ) ≈ 1, δ 2 ( α ) ≈ 1 / 2 a nd δ 3 ( α ) ≈ − 1 / 2. F urthermore, tr( Z (2) d ) establishes the dep endency of ǫ ( α, p, X ) on X . In other w ords, ǫ ( α, p, X ) dep ends on the sum of squares of the diagonal elemen ts of the hat matrix Z . In particular, if p = 1, i.e. if X has a single column, x = ( x 1 , . . . , x n ) ⊤ sa y , then tr( Z (2) d ) = P n i =1 x 4 i / P n i =1 x 2 i 2 , the sample kurtosis of x . Finally , it should b e noted that expression (8) is quite simple and can b e easily implemen ted into any mathematical or statistical/econometric programming en vironmen t, suc h as R [R Dev elopmen t Core T eam (2006)], Ox [Cribari– Neto and Zarkos (2003 ); Do ornik (200 6)] and MAPLE [Ab ell and Br a selton (1994)]. 4 Sp ecial c ases In this section w e presen t closed-form expressions for the Bartlett correction factor in situations tha t are of particular in terest to practitioners. The simpli- fied expressions are obtained from our more general result giv en in (8). A t the outset, w e consider the test of H 0 : α = α (0) against H 1 : α 6 = α (0) , where α (0) is a giv en p ositiv e scalar and β is a vec tor of n uisance parameters. The Bartlett correction factor b ecomes c = 1 + B ( θ ), where B ( θ ) = ǫ ( α , p, X ) − ǫ β ( α, X ), and hence, B ( θ ) = ǫ α ( α, p ). No te that the correction factor dep ends on X only through its rank, p . In particular, when p = 1 ( i.i.d. case), w e hav e B ( θ ) = 1 n ( 1 3 + δ 1 ( α ) + δ 2 ( α ) ) . This f o rm ula corrects eq. (14) in Lemonte et al. (20 07), whic h is in error. F or small and large v alues of α , we hav e B ( θ ) ≈ 11 / (6 n ). Often times practitioners wish to test restrictions on a subset of the regression parameters. F o r instance, one may w an t to test whether a giv en group of co- v ariates are jointly significan t. T o that end, w e partition β as β = ( β ⊤ 1 , β ⊤ 2 ) ⊤ , where β 1 = ( β 1 , β 2 , . . . , β p − q ) ⊤ and β 2 = ( β p − q +1 , β p − q +2 , . . . , β p ) ⊤ are v ec- tors of dimensions ( p − q ) × 1 and q × 1, resp ectiv ely , and consider the test of H 0 : β 2 = β (0) 2 against H 1 : β 2 6 = β (0) 2 , where β (0) 2 is a q - v ector o f kno wn constan ts. The most common situation is that in whic h β (0) 2 = 0 . No t e t ha t β 1 and α are nuisance parameters. In accordance with t he partition of β , w e part it ion X as X = ( X 1 X 2 ), where t he dimensions of X 1 and X 2 are n × ( p − q ) and n × q , resp ective ly . The correction factor is c = 1 + B ( θ ) /q , 9 where B ( θ ) = ǫ ( α, p, X ) − ǫ ( α , p − q , X 1 ). It is easy to obta in B ( θ ) = 1 n n δ 1 ( α ) q + δ 2 ( α ) q (2 p − q ) o + δ 3 ( α )tr( Z (2) d − Z (2) 1 d ) , with Z 1 = X 1 ( X ⊤ 1 X 1 ) − 1 X ⊤ 1 = { z 1 ij } and Z 1 d = diag { z 111 , z 122 , . . . , z 1 nn } . Next, supp o se we wish to test H 0 : β = β (0) against H 1 : β 6 = β (0) , where β (0) is a p -vector of kno wn constan ts and α is a nuis ance parameter. The Ba rtlett correction factor is c = 1 + B ( θ ) /p with B ( θ ) = ǫ ( α, p, X ) − ǫ α ( α, 0), whic h yields B ( θ ) = 1 n n δ 1 ( α ) p + δ 2 ( α ) p 2 o + δ 3 ( α )tr( Z (2) d ) . 5 Numerical evidence W e shall no w rep ort Mon te Carlo evidence on the finite sample p erformance of three tests in Birn baum–Saunders regressions, namely: the lik eliho o d ratio test ( LR ), the Bartlett-corrected lik eliho o d ratio test ( LR b ), and an asymptotically equiv alen t corrected test ( LR ∗ b ). 2 The mo del used in the n umerical ev aluation is y i = β 1 x i 1 + β 2 x i 2 + · · · + β p x ip + ε i , where x i 1 = 1 and ε i ∼ S N ( α , 0 , 2), i = 1 , 2 , . . . , n . The co v ariate v alues w ere selected as random dra ws f r om the U (0 , 1) distribution. The n umber of Mon te Carlo replications w as 10 ,000, the nominal lev els of the tests w ere γ = 10%, 5% a nd 1%, and all sim ulations we re carried out using the Ox matrix programming langua g e (D o ornik, 2006). T able 1 presen ts the n ull rejection rates (en tries are p ercen tages) of the three tests. The null h yp othesis is H 0 : β p − 1 = β p = 0, which is tested a gainst a tw o-sided alternative , the sample size is n = 30 and α = 0 . 5. Different v alues of p w ere considered. The v alues of the resp onse w ere generated using β 1 = β 2 = · · · = β p − 2 = 1. Note tha t t he lik eliho o d ratio test is considerably o ve rsized (lib eral), more so as the n um b er of regressors increases. F or instance, when p = 8 and γ = 10%, its n ull rejection rate is 18.78%, i.e., nearly t wice the nominal lev el of the test. The t w o corrected tests are muc h less size distorted. F or example, their n ull rejection rates in the same situation we re 11.82% ( LR b ) and 11 .1 3% ( LR ∗ b ). The results in T able 2 corresp ond to α = 0 . 5 and p = 6. W e r ep ort r esults for samples sizes ranging from 20 to 200 . The n ull hy p o thesis under test is 2 W e do not rep ort results relativ e to LR ∗∗ b since they we re very sim ilar to those obtained using LR ∗ b . 10 T able 1 Null rejection rates; α = 0 . 5, n = 30. γ = 10% γ = 5% γ = 1% p LR LR b LR ∗ b LR LR b LR ∗ b LR LR b LR ∗ b 3 12.69 10.36 10.22 6.51 4.98 4.90 1.75 1.25 1.23 4 13.44 10.27 10.07 7. 46 5.41 5.32 1.90 1.10 1.04 5 14.77 10.74 10.45 8. 25 5.53 5.31 2.21 1.18 1.14 6 15.94 11.07 10.53 9.14 5.55 5.23 2.54 1.24 1.17 7 17.28 11.55 10.88 10.13 5.69 5.42 2.95 1.29 1.19 8 18.78 11.82 11.13 11.15 6.44 5.83 3.38 1.48 1.31 9 19.92 12.11 11.00 12.00 6.33 5.66 3.82 1.49 1.25 H 0 : β 5 = β 6 = 0. The figures in this table sho w that the null rejection rates of all tests approach the corresp onding no minal lev els as the sample size grows , as exp ected. It is also notew ort hy that the lik eliho o d ratio test displays lib eral b eha vior ev en when n = 100. Ov erall, the corrected tests are less size distorted than the unmo dified test. F or example, when n = 50 and γ = 5%, the null rejection rates are 7.4 9 % ( LR ), 5.32% ( LR b ) and 5.17% ( LR ∗ b ). T able 2 Null rejection rates; α = 0 . 5, p = 6 and different sample sizes. γ = 10% γ = 5% γ = 1% n LR LR b LR ∗ b LR LR b LR ∗ b LR LR b LR ∗ b 20 1 9.54 12.04 11.08 11.97 6.54 5.87 4.05 1.58 1.38 30 15.94 11.07 10.5 3 9.14 5.55 5.23 2.54 1.24 1.17 40 1 3.57 10.14 9 .97 7.45 4.99 4.81 1.79 1.03 1.01 50 13.36 10.72 10.5 1 7.49 5.32 5.17 1.51 1.02 0.99 100 11.86 10.46 10.4 4 5.90 4.92 4.88 1.25 1.04 1.03 200 10.92 10.14 10.1 2 5.57 5.07 5.07 1.04 0.96 0.96 Figure 1 plots relative quan t ile discrepancies a gainst the asso ciat ed a symptotic quan tiles fo r the three test statistics. Relativ e quan tile discrepancies a r e de- fined as the difference b et w een exact (estimated by Mon te Carlo) and asymp- totic quantiles divided by the lat t er. Again, p = 6 and w e test the exclusion of the last tw o co v a riates. Also, n = 30 and α = 0 . 5. The closer to zero the relativ e quantile discrepancies , the more a ccurate the test. While T ables 1 and 2 giv e rejection rates of the tests at fixed nominal leve ls, F ig ure 1 compares the whole distributions of the different statistics with the limiting null dis- tribution. W e note that the relativ e quantile discrepancies of the like liho o d ratio test statistic oscillates around 25% whereas f o r the tw o corrected statis- tics they a r e ar ound 5% ( LR b ) and 3% ( LR ∗ b ). It is thus clear that the n ull distributions o f the mo dified statistics are m uc h b etter appro ximated b y the limiting n ull distribution ( χ 2 2 ) t han that of the like liho o d ratio statistic. T able 3 contains t he nonnull rejection rates (p ow ers) of the tests. Here, p = 4, α = 0 . 5 and n = 30 , 50 , 100. Data generation was p erfo rmed under the 11 1 2 3 4 5 6 7 8 0.00 0.05 0.10 0.15 0.20 0.25 1 2 3 4 5 6 7 8 0.00 0.05 0.10 0.15 0.20 0.25 1 2 3 4 5 6 7 8 0.00 0.05 0.10 0.15 0.20 0.25 asymptotic quantile relative quantile discrepancy LR LR b LR b * Fig. 1. Relativ e quantil e d iscrepancies plot: n = 30, p = 6 and α = 0 . 5. alternativ e h yp othesis: β 3 = β 4 = δ , with differen t v alues of δ ( δ > 0). W e ha v e only considered the tw o corrected tests since the lik eliho o d ratio is considerably o v ersized, as noted earlier. Note that the t w o tests displa y similar p o w ers. F or instance, when n = 50, γ = 5% and δ = 0 . 5, the nonnull rejection rates a r e 72.39% ( LR b ) and 72.28% ( LR ∗ b ). W e also note that the p ow ers of the tests increase with n and a lso with δ , as exp ected. T able 4 presen ts the n ull rejection rates for inference on the scalar parameter α . Here, n = 30 and p = 2, 3 and 4. The n ull h yp otheses under test are H 0 : α = 0 . 5 and H 0 : α = 1 . 0. The lik eliho o d ratio t est is ag ain lib eral. Note that t he tw o corrected tests are m uc h less size distorted. F o r instance, when p = 4, γ = 5% a nd α = 1 . 0, the null rejection rates o f the LR , LR b and LR ∗ b tests w ere 1 2.03%, 5.20% and 4.02 %, resp ectiv ely . Our sim ulation results concerning tests on the regression parameters w ere obtained for α = 0 . 5. In practice, v alues of α b etw een 0 and 1 cov er most of the applications; see, for instance, Rieck and Nedelman (1991). W e shall no w presen t sim ulation results for a wide range of v alues of α , namely α = 0 . 1 , 0 . 3 , 0 . 5 , 0 . 7 , 0 . 9 , 1 . 2 , 2 , 10 , 50 a nd 100. The new set of sim ulation results includes rejection ra tes of the likelihoo d ratio test that uses parametric b o ot- strap critical v alues (with 600 b o otstrap replications). The para metric b o ot- strap can b e briefly described as f o llo ws. W e can use b o otstrap resampling to estimate the null distribution of the statistic LR directly from the o bserv ed sample y = ( y 1 , . . . , y n ) ⊤ . T o that end, one generates, under H 0 (i.e., im- p osing t he restrictions stated in the null h yp othesis), B b o otstrap samples 12 T able 3 Nonn ull rejection rates; α = 0 . 5, p = 4 and different sample size s. LR b LR ∗ b n δ 10 % 5% 1% 10 % 5% 1% 30 0 .1 13.20 6 .91 1.57 13 .01 6.73 1 .52 0.2 20.66 12.22 3.46 20 .40 12.02 3.3 0 0.3 33.07 21.63 7.49 32 .73 21.28 7.3 3 0.4 48.36 35.5 7 14.96 48.08 35.20 14.6 1 0.5 65.11 51.59 26.4 2 64.72 51.1 9 25.99 50 0 .1 13.82 7 .63 2.03 13 .71 7.60 1 .99 0.2 25.89 16.0 3 5.11 25.81 15.96 5.03 0.3 45.00 32.06 13.1 5 44.86 31.9 5 13.07 0.4 65.07 52.09 28.1 8 64.97 51.9 6 28.03 0.5 82.31 72.39 48.0 1 82.14 72.2 8 47.88 100 0.1 18.66 11.02 2.91 18 .65 11.01 2.9 0 0.2 43.63 31.29 13.0 5 43.61 31.2 8 13.02 0.3 73.47 62.39 37.4 0 73.47 62.3 5 37.34 0.4 92.12 86.39 69.1 5 92.11 86.3 7 69.11 0.5 98.76 97.34 89.9 8 98.76 97.3 3 89.93 T able 4 Null rejection rates; infer en ce on α ; n = 30 and d ifferen t v alues for p . H 0 : α = 0 . 5 H 0 : α = 1 . 0 p 10% 5% 1% 10% 5 % 1% 2 LR 12.76 6.9 9 1.82 13.55 7.26 1.93 LR b 10.13 5.15 1.21 10.52 5.10 1.08 LR ∗ b 9.90 5.02 1.20 10.31 4.94 1.05 3 LR 15.16 8.64 2.45 16.10 9.35 2.70 LR b 10.46 5.43 1.16 10.53 5.06 0.97 LR ∗ b 9.77 5.02 1.02 9.65 4.68 0.81 4 LR 18.16 10.7 2 3.39 19.8 6 12.03 3.7 3 LR b 10.45 5.37 0.98 10.73 5.20 0.75 LR ∗ b 9.29 4.57 0.72 8.77 4.02 0.43 ( y ∗ 1 , . . . , y ∗ B ) from the assumed mo del with the parameters replaced b y re- stricted estimates computed using the origina l sample (para metric b o otstrap), and, fo r eac h pseudo-sample, one computes LR ∗ b = 2 { ℓ ( b θ ∗ b ; y ∗ b ) − ℓ ( e θ ∗ b ; y ∗ b ) } , b = 1 , 2 , . . . , B , where e θ ∗ b and b θ ∗ b are the ma ximum lik eliho o d estimators of θ obtained from the maximizations of ℓ ( θ ; y ∗ b ) under H 0 and H 1 , re- sp ectiv ely . The 1 − γ p ercen tile o f LR ∗ b is estimated b y b q 1 − γ , suc h tha t # { LR ∗ b ≤ b q 1 − γ } /B = 1 − γ . One rejects the n ull h yp othesis if LR > b q 1 − γ . F or a go o d discussion o f bo otstrap tests, see Efron and Tibshirani (1993, Chapter 16). Figures in T a ble 5 provide imp ortant information. F or all v alues of α the 13 Bartlett and the b o o tstrap corrections are v ery effectiv e in pushing the rejec- tion rates to ward the nominal lev els. An adv an tage of the Ba rtlett cor r ection o v er the b o otstrap approa c h is that the first requires m uc h less computational effort. It is notew orthy t ha t as α grow s, t he rejection rat es of the likelihoo d ratio t est approac hes the corresp onding nominal lev els, making the corrections less needed. T able 5 Null rejection rates of H 0 : β 3 = β 4 = 0; p = 4, n = 25 and differen t v alues for α . α = 0.1 α = 0.3 γ LR LR b LR ∗ b LR boot LR LR b LR ∗ b LR boot 10% 14.33 11.42 11.32 9.90 14.45 10.70 10.44 10.18 5% 7.88 5.82 5.74 4.94 8.01 5.49 5.22 4.97 1% 1.95 1.29 1.23 1.24 2.07 1.20 1.13 1.13 α = 0.5 α = 0.7 γ LR LR b LR ∗ b LR boot LR LR b LR ∗ b LR boot 10% 14.25 10.23 10.01 10.23 14.17 10.61 10.3 6 10.14 5% 7.69 5.17 5.02 5.12 8.09 5.35 5.17 5.28 1% 1.89 0.91 0.85 1.24 2.07 1.12 1.06 1.02 α = 0.9 α = 1.2 γ LR LR b LR ∗ b LR boot LR LR b LR ∗ b LR boot 10% 13.96 10.80 10.60 9.64 13.49 10.45 10.29 9.79 5% 8.03 5.77 5.61 5.17 7.51 5.37 5.26 5.10 1% 2.29 1.30 1.26 1.10 1.90 1.18 1.16 1.38 α = 2 α = 10 γ LR LR b LR ∗ b LR boot LR LR b LR ∗ b LR boot 10% 13.21 10.87 10.64 10.01 12.44 11.23 11.1 3 9.75 5% 7.29 5.61 5.50 5.08 6.59 5.81 5.73 4.80 1% 1.63 1.08 1.04 1.21 1.42 1.17 1.16 0.98 α = 50 α = 100 γ LR LR b LR ∗ b LR boot LR LR b LR ∗ b LR boot 10% 11.26 10.45 10.43 10.11 10.87 10.17 10.1 2 9.89 5% 5.60 5.21 5.20 4.93 5.67 5.11 5.07 5.18 1% 1.19 1.06 1.06 1.04 1.23 1.07 1.07 1.18 W e shall now try to shed some light on the issue of the p ossible effect of near-collinearit y b etw een the co v a r ia tes X on the testing pro cedures. T o do so, w e p erformed a n additional simulation exp eriment. W e set p = 4 and selected the cov ariate v alues a s follows: x i 1 = 1 , for i = 1 , . . . , n , the v alues of x 2 w ere c hosen as ra ndo m dra ws from the U (0 , 1) distribution and the pairs ( x i 3 , x i 4 ) w ere selected a s random draws from the biv ar ia te normal distribution 14 N 2 ( 0 , Σ ), where the co v ar ia nce matriz Σ has the follo wing fo r m Σ = 1 ρ ρ 1 . The closer the v alue of ρ is to either extreme ( − 1 or 1), the stronger the linear relation b etw een the cov ariates x 3 and x 4 . T able 6 presen ts sim ulation results for differen t v alues of ρ . The figures in this ta ble suggest that the sample correlatio n b et w een x 2 and x 3 do es not hav e significant effect on the b eha viour of the testing pro cedures. Hence, near- collinearit y do es not se em to a matter of concern. T able 6 Null rejection rates of H 0 : β 2 = β 4 = 0; p = 4, n = 20 and differen t v alues for ρ . ρ = 0.0 γ LR LR b LR ∗ b LR boot 10% 16.00 11.15 10.72 10.20 5% 9.16 5.33 5.08 4.90 1% 2.37 1.27 1.21 1.16 ρ = 0.5 γ LR LR b LR ∗ b LR boot 10% 15.54 10.72 10.33 10.14 5% 8.85 5.73 5.48 5.22 1% 2.37 1.15 1.03 1.10 ρ = 0.9 γ LR LR b LR ∗ b LR boot 10% 15.73 11.14 10.77 10.31 5% 9.18 6.06 5.70 5.40 1% 2.58 1.15 1.10 1.21 In all sim ulated situations, the lik eliho o d ratio t est was lib eral. Of course, this is not a pro of that this is alw a ys the case. Indeed, there may b e situa- tions where it is conserv ativ e. Sim ulation results presen ted in the literature, ho w ev er, suggest that the lik eliho o d ra tio test is of t en anti-conse rv a tiv e. F or a theoretical justification in a simple situation, let z 1 , . . . , z n b e a random sample drawn from the N ( µ, σ 2 ) distribution, with b oth µ and σ 2 unkno wn. Consider the test of H 0 : µ = µ 0 v ersus H 1 : µ 6 = µ 0 . The asymptotic likeli- ho o d ratio test rejects H 0 whenev er LR > c γ , where c γ is the 1 − γ quan tile of the χ 2 1 distribution. Equiv alen tly , H 0 is rejected when √ n | z − µ 0 | / b σ > k ( γ , n ) , where z = P n i =1 z i /n , b σ 2 = P n i =1 ( z i − z ) 2 / ( n − 1) and k ( γ , n ) = q (exp( − c γ / 2) − 2 /n − 1)( n − 1). T able 7 show s the true leve ls of the like liho o d ratio test, i.e. Pr( LR > c γ ) ev a lua ted at H 0 , for differen t v alues of n and γ . Notice that, ev en in this simple situation, the lik eliho o d ratio t est is lib eral when the sample is not la r g e, in a g reemen t with sim ulation results presen ted 15 elsewhere . See, for instance, Riec k and Nedelman (19 91, T able 4) a nd Cordeiro et al. (1995). T able 7 T r ue lev el; norm al distribution. γ n 1% 5% 10% 5 2.91 9.79 16. 54 8 1.97 7.64 13. 72 12 1.58 6.64 12.35 20 1.32 5.93 11.35 50 1.12 5.36 10.52 6 An application W e shall now turn to an empirical a pplication that emplo ys real data. W e consider t he in v estigation made by Lepadatu et al. (20 0 5) on metal extrusion die lifetime. As noted b y the authors (p. 38), “the estimation of to ol life (fa- tigue life) in the extrus ion op eration is imp ortan t for sc heduling to ol c hanging times, for adaptive pro cess con trol and for to ol cost ev aluation.” They also note (p. 39) that “die fatig ue crac ks are caused b y the rep eat a pplication of loads whic h individually w ould b e to o small to cause failure.” According to them, curren t researc h aims at describing the whole fatigue pro cess b y fo cus- ing on the analysis of crack propagation from very small initial defects. It is notew orth y that fat ig ue failure due to pro pa gation of an initial crac k w as the main motiv atio n fo r the Birn baum–Saunders distribution. In Section 1 , w e explained that the interes t lies in mo deling the die lif etime ( T ) in the metal ex trusion pro cess, whic h is mainly determine d b y its material prop erties and by the stresses under load. The extrusion die is exp osed to high temp eratures, which can also b e damaging. The co v ariat es are the friction co efficien t ( x 1 ), the angle of the die ( x 2 ) and w ork temp erature ( x 3 ). Consider a regression mo del whic h also includes interaction effects, i.e., y i = β 0 + β 1 x 1 i + β 2 x 2 i + β 3 x 3 i + β 4 x 1 i x 2 i + β 5 x 1 i x 3 i + β 6 x 2 i x 3 i + ε i , (9) where y i = log ( T i ) and ε i ∼ S N ( α , 0 , 2), i = 1 , 2 , . . . , n . There are only 15 observ ations ( n = 15), and w e w an t mak e inference on the significance of the in teraction effects, i.e., we wish to test H 0 : β 4 = β 5 = β 6 = 0. The lik eliho o d ratio test statistic ( LR ) equals 6 . 387 ( p -v alue 0.094 ) , and the tw o corrected test statistics ar e LR b = 4 . 724 ( p -v alue 0.193) and LR ∗ b = 4 . 492 ( p -v alue 0.213). The p -v alue of t he b o otstrap- based lik eliho o d r a tio test is 0.276 . It is notew orth y that one rejects the n ull h yp othesis a t the 10 % nominal lev el whe n the inference is based on the lik eliho o d ratio test, but a differen t inference is 16 reac hed when t he mo dified (Bartlett-corr ected or b o o tstrap-based) tests are used. Recall from the previous section that the unmo dified test is ov ersized when the sample is small (here, n = 15), whic h leads us to mistrust the inference deliv ered b y the lik eliho o d ratio test. W e pro ceed by remov ing the interaction effects (as suggested b y the three mo dified tests) fro m Mo del (9) . W e then estimate y i = β 0 + β 1 x 1 i + β 2 x 2 i + β 3 x 3 i + ε i , i = 1 , . . . , 15. The p oint estimates are (standard errors in paren theses): b β 0 = 5 . 9011 (0 . 488 ) , b β 1 = 0 . 7917 (1 . 777 ), b β 2 = 0 . 0098 (0 . 012 ), b β 3 = 0 . 0052 (0 . 001 ) and b α = 0 . 1982 (0 . 036 ) . The n ull hy p o thesis H 0 : β 3 = 0 is strongly rejected b y the four tests (unmo dified and mo dified) at the usual significance leve ls. All tests also sugges t the individual and join t exclusions of x 1 and x 2 from t he regression mo del. W e th us end up with the reduced mo del y i = β 0 + β 3 x 3 i + ε i , i = 1 , . . . , 15. The p oint estimates are (standard errors in paren theses): b β 0 = 6 . 2453 (0 . 326 ) , b β 3 = 0 . 0 052 (0 . 001) and b α = 0 . 2039 (0 . 037). W e no w return to Mo del (9) and test H 0 : β 1 = β 2 = β 4 = β 5 = β 6 = 0 (exclusion of all v ariables but x 3 ). The n ull h yp othesis is not rejected at the 10% nominal leve l by all tests, but w e note that the corrected tests yield considerably larg er p -v alues. The test statistics are LR = 7 . 229, LR b = 5 . 610 and LR ∗ b = 5 . 4 17, the corresp onding p - v alues b eing 0.204, 0.346 and 0.367; the p -v alue obta ined from the b o otstrap-based lik eliho o d ratio test equals 0.484. 7 Conclusions W e addressed t he issue of p erforming testing inference in Birnbaum–Saunde rs regressions when the sample size is small. The likelihoo d ratio test can b e considerably o v ersized (lib eral), as evidenced by our n umerical results. W e deriv ed mo dified test statistics whose n ull distributions are more accurately appro ximated by the limiting null distribution than that of the lik eliho o d ratio test statistic. W e ha v e also considered a pa r a metric b o otstrap sc heme to obtain improv ed critical v alues and accurate p -v alues for the lik eliho o d ratio test. Our sim ulation results ha v e conv incingly sho wn that inference based on the mo dified test statistics can b e m uch more accurate than t ha t based on the unmo dified statistic. The mo dified tests b ehav e as reliably as a lik eliho o d ratio test t ha t relies on b o otstrap- based critical v alues, with no need of computer in tensiv e pro cedures. W e recommend the use o f the fo llowing statistics: LR b and LR ∗ b . The latter has the adv an tage of only taking on p ositive v alues, whic h 17 is desirable. W e ha v e also presen ted an empirical a pplicatio n in whic h t he use of the finite sample adjustmen t pro p osed in this pap er can lead t o inferences that are differen t from the ones reac hed based on first order asymptotics. Ac kno wledgmen ts W e gratefully ackno wledge gra n ts from F APESP and CNPq. W e thank an anon ymous referee for helpful commen ts that led to sev eral improv emen ts in this pap er. App endix F rom (6), we h av e ǫ p +1 = p +1 X r,s,t,u =1 λ r stu − p +1 X r,s,t,u,v,w = 1 λ r stuvw . Note that P p +1 r,s,t,u =1 λ r stu can b e written as P p r,s,t,u =1 λ r stu plus terms in w h ic h at least one s ubscript equals α . It follo ws from the orth ogonalit y b et ween α and β that sev eral terms equal zero. The n on-zero terms are P p r,s =1 λ r sαα , P p t,u =1 λ ααtu and λ αααα . Also, P p +1 r,s,t,u,v,w = 1 λ r stuvw is give n b y P p r,s,t,u,v,w = 1 λ r stuvw plus the follo w - ing terms: P p r,s,t,u =1 λ r stuαα , P p r,s,v,w =1 λ r sααvw , P p t,u,v ,w =1 λ ααtuvw , P p r,s =1 λ r sαααα , P p t,u =1 λ ααtuαα , P p v,w =1 λ ααααvw and λ αααααα . Here, w e p resen t the deriv ations of P p r,s,t,u =1 λ r stu and P p v,w =1 λ ααααvw . T h e other terms can b e obtained in a similar fashion. Note that P p r,s,t,u =1 λ r stu = (1 / 4) P p r,s,t,u =1 κ r s κ tu κ r stu . Inserting th e cum ulants giv en in Section 3 in to this expression we ha ve p X r,s,t,u =1 λ r stu = 1 4 p X r,s,t,u =1 κ r s κ tu ( ψ 2 ( α ) n X i =1 x ir x is x it x iu ) = ψ 2 ( α ) 4 n X i =1 p X r,s,t,u =1 x ir κ r s x is x it κ tu x iu = ψ 2 ( α ) 4 n X i =1 ( p X r,s =1 x ir κ r s x is )( p X t,u =1 x it κ tu x iu ) = ψ 2 ( α ) 4 n X i =1 x ⊤ i K ββ x i x ⊤ i K ββ x i = ψ 2 ( α ) 4 n X i =1 x ⊤ i K ββ x i 2 , where x ⊤ i = ( x i 1 , x i 2 , . . . , x ip ) repr esen ts the i th row of X and K ββ = K ( β ) − 1 = 4( X ⊤ X ) − 1 /ψ 1 ( α ) repr esen ts the inv erse of Fisher’s information matrix for β . Th er e- 18 fore, p X r,s,t,u =1 λ r stu = 4 ψ 2 ( α ) ψ 1 ( α ) 2 n X i =1 x ⊤ i ( X ⊤ X ) − 1 x i 2 . Note that z ii = x ⊤ i ( X ⊤ X ) − 1 x i is the i th d iagonal elemen t of Z d giv en in Section 3. Hence, p X r,s,t,u =1 λ r stu = 4 ψ 2 ( α ) ψ 1 ( α ) 2 n X i =1 z 2 ii = 4 ψ 2 ( α ) ψ 1 ( α ) 2 tr( Z (2) d ) . F rom P p v,w =1 λ ααααvw = (1 / 4)( κ αα ) 2 κ ααα P p v,w =1 κ vw κ αvw , we obtain p X v,w =1 λ ααααvw = α 4 4 n 2 5 n 2 α 3 p X v,w =1 κ vw ( 2 + α 2 α 3 n X i =1 x iv x iw ) = 5(2 + α 2 ) 8 nα 2 n X i =1 ( p X v,w =1 x iv κ vw x iw ) = − 5(2 + α 2 ) 8 nα 2 n X i =1 x ⊤ i K ββ x i = − 5(2 + α 2 ) 2 nα 2 ψ 1 ( α ) n X i =1 x ⊤ i ( X ⊤ X ) − 1 x i = − 5(2 + α 2 ) 2 nα 2 ψ 1 ( α ) n X i =1 z ii = − 5(2 + α 2 ) 2 nα 2 ψ 1 ( α ) tr( Z d ) = − 5(2 + α 2 ) p 2 nα 2 ψ 1 ( α ) . References [1] Ab ell, M. L. and Braselton, J. P . (1994). The Maple V Handb o ok . AP Professional, New Y ork. [2] Bartlett, M. S . (19 37). Prop erties of su ffi ciency and statistical tests. P r o c e e dings of the R oyal So ciety A , 160 , 268–282 . [3] Birn baum, Z. W. and Saunders , S . C. (1969) . A new family of life distrib utions. Journal of Applie d Pr ob ability , 6 , 319–3 27. [4] Cordeiro, G. M., Crib ari–Neto, F., Aub in, E. C. Q . and F errari, S. L. P . (19 95). Bartlett corrections for one-parameter exp onen tial family mo d els. Journal of Statistic al Computation and Simulation , 53 , 211–2 31. [5] Co x, D. R. and Reid, N. (1987). P arameter orthogonalit y and appro ximate conditional inference. Journal of the R oyal Statistic al So ciety B , 40 , 1–39. [6] Cribari–Neto, F. and Cordeiro, G. M. (1996). On Bartlett and Bartlett-t yp e corrections. E c onometric R eviews , 15 , 339–367. [7] Cribari–Neto, F. and Zarkos, S. (2 003). Econometric and statistical computing using Ox. Computational Ec onomics , 21 , 277–2 95. 19 [8] Desmonde, A. F. (1985). Sto chastic mo d els of failure in random environmen ts. Canadian Journal of Statistics , 13 , 171–18 3. [9] Do ornik, J . A. (2006). A n Obje ct-O riente d M atrix L anguage – O x 4 . Timb er lake Consultan ts Press, London. 5th ed. [10] Efron, B. and T ibshirani, R. J. (1993). An Intr o duction to the Bo otstr ap . Chapman and Hall, New Y ork. [11] Galea, M., Leiv a, V. an d Pa ula, G. A. (2004). In fl uence diagnostics in log- Birn baum–Saun ders regression mo dels. J ournal of A pplie d Statistics , 31 , 1049 – 1064. [12] Gradshteyn, I. S. and Ryzhik, I. M. (2007). T able of Inte gr als, Series, and Pr o ducts . Academic Press, New Y ork. [13] Johns on , N., K otz, S. and Balakrishnan, N. (1995). Continuous Uni v ariate Distributions – V olume 2 , 2nd ed. Wiley , New Y ork. [14] Kun du, D., Kan n an, N. and Balakrishnan, N. (2008). On the function of Birnbaum–Saunders d istribution and asso ciated inference. Computational Statistics and Data Analysis , 52 , 2692–2702 . [15] La wley , D. (1956). A general metho d for appr oximati ng to the distribu tion of lik eliho o d ratio criteria. Biometrika , 43 , 295–30 3. [16] Leiv a, V., Barros, M. K., Paula, G. A. and Galea, M. (2007). Influence diagnostics in log-Birn b aum–Saunders regression mo d els with censored data. Computation al Statistics and Data Analysis , 51 , 5694–5707 . [17] Lemont e, A. J ., Cr ibari–Neto, F. and V asconcellos, K. L. P . (2007). Impr o v ed statistica l inference for the t wo- parameter Birnbaum–Saunders d istribution. Computation al Statistics and Data Analysis , 51 , 4656–4681 . [18] Lemont e, A. J., Simas, A. B. an d Cribari–Neto, F. (2008). Bo otstrap-based impro ve d estimators for the tw o-parameter Birnbaum–Saunders distrib ution. Journal of Statistic al Computation and Simulation , 78 , 37–49. [19] Lepadatu, D., Kobi, A., Ham bli, R. and Barreau, A. (2005). Lifetime m ultiple resp onse optimizatio n of metal extrusion d ie. Pr o c e e dings of the Annual R eliability and Maintainability Symp osium , 37–42. [20] McCarter, K . S . (1999 ). E stimation and Pr e diction for the Bi rnb aum–Saunders Distribution Using T yp e-II Censor e d Sampl es, With a Comp arison to the Inverse Gaussian Distribution . Ph.D. dissertation, Kansas S tate Univ ersit y . [21] Nelson, W. (1990). A c c eler ate d T esting, Statistic al Mo dels, T est Plans and D ata Ana lysis . Wiley , New Y ork. [22] Press, W. H., T eulosky , S. A., V etterling, W. T . and Flanner y , B. P . (1992 ). Numeric al R e cip es in C: The Art of Scientific Computing , 2nd ed. Prentic e Hall, London. 20 [23] R Dev elopmen t Core T eam (2006). R: A L anguage and Envi r onment for Statistic al Computing . R F oundation for Statistical Computing, Vienna, Austria. [24] Riec k, J. R. (1989). Statistic al Analysis for the Birnb aum–Saunders F atigue Life Distribution . Ph.D. dissertation, Clemson Universit y . [25] Riec k, J. R. and Nedelman, J . R. (1991 ). A log-linear mo del for the Birnbaum– Saunders distribu tion. T e chnometrics , 33 , 51–60. [26] Saun d ers, S. C. (1974). A family of random v ariables closed under recipro cation. Journal of the Americ an Statistic al Asso ciation , 69 , 533–539. [27] Tisionas, E. G. (2001) . Ba y esian inference in Birn baum–Sau n ders regression. Communic ations in Statistics – The ory and Metho ds , 30 , 179–193 . [28] Xie, F. C. and W ei, B. C. (2007). Dia gnostics analysis for log-Birn baum – Saunders regression mo dels. Computational Statistics and Data Analysis , 51 , 4692– 4706. 21
Original Paper
Loading high-quality paper...
Comments & Academic Discussion
Loading comments...
Leave a Comment