Evolving complex networks with conserved clique distributions
We propose and study a hierarchical algorithm to generate graphs having a predetermined distribution of cliques, the fully connected subgraphs. The construction mechanism may be either random or incorporate preferential attachment. We evaluate the st…
Authors: Gregor Kaczor, Claudius Gros
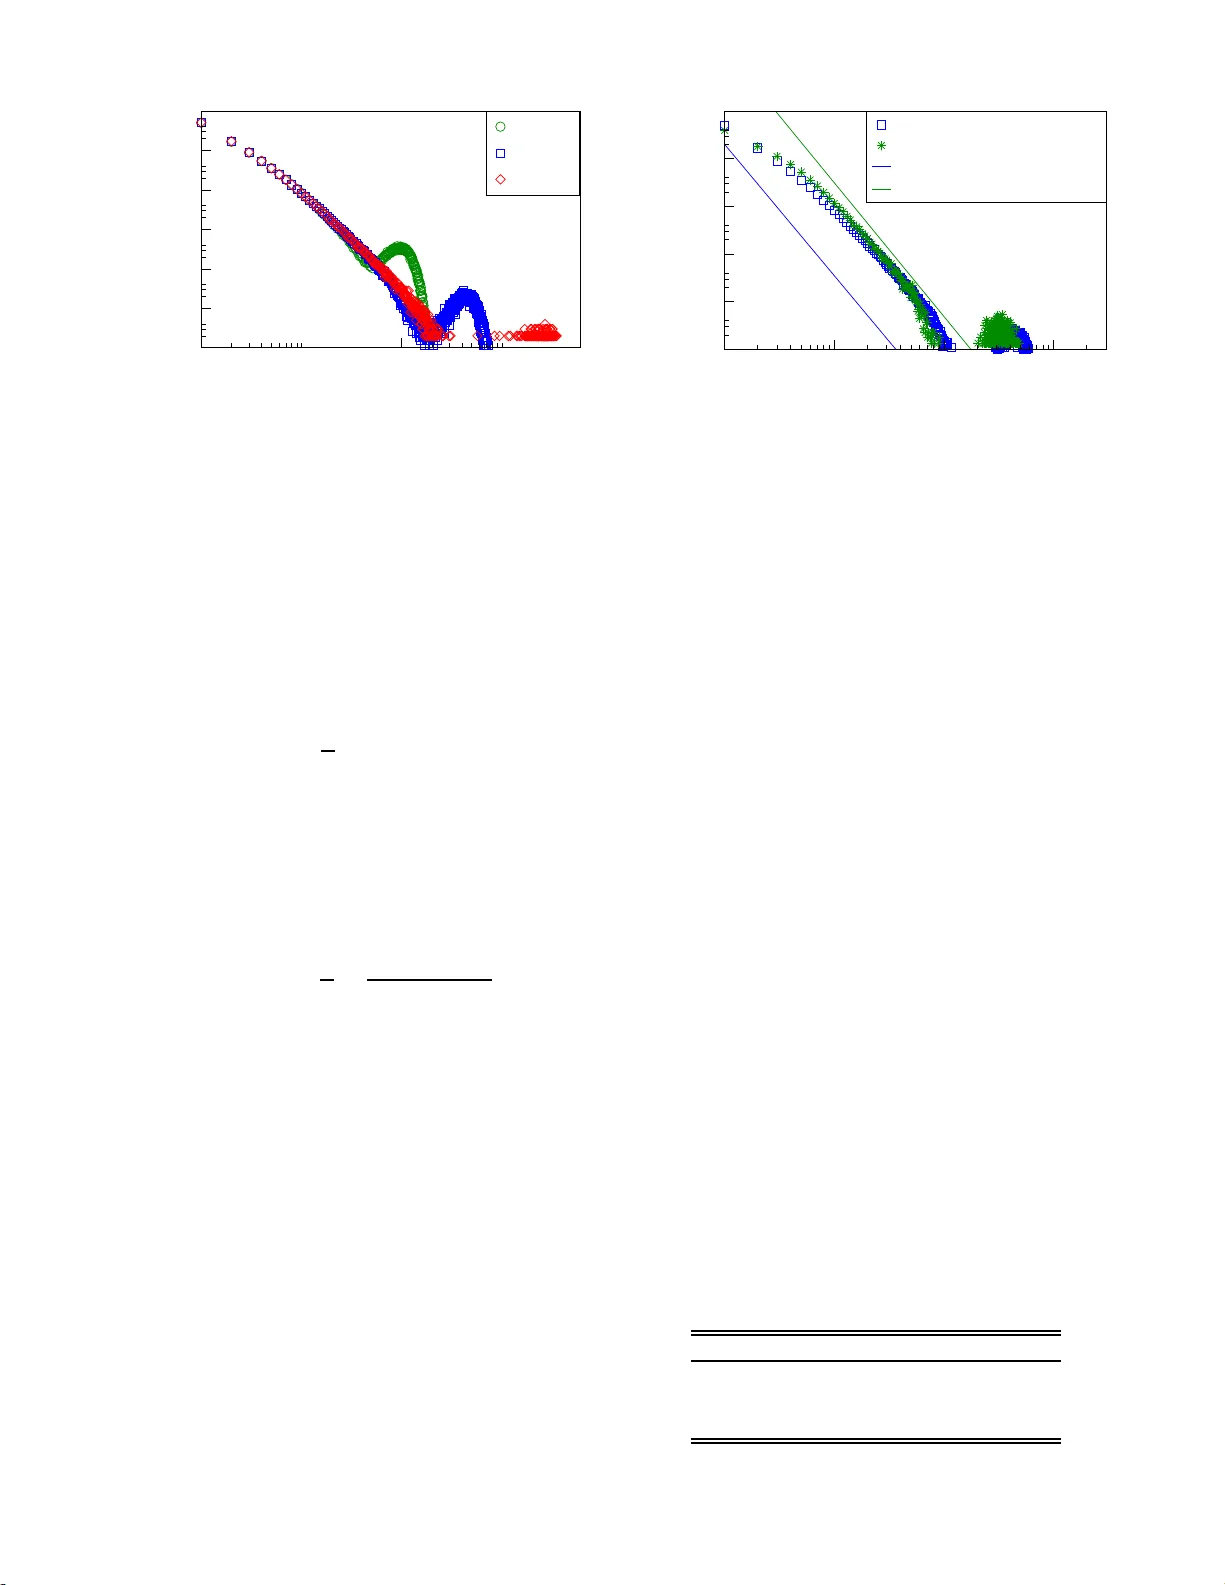
Ev olving complex net w orks with conserv e d clique distributions Gregor Kaczor and Claudius Gros Institute for The or etic al Physics, Johann Wolfgang Go ethe University, F r ankfurt am Main, Germany (Dated: Octob er 31, 2018) W e prop ose and study a hierarchical algorithm to generate graphs h a ving a predetermined distri- bution of cliques, the fully connected sub graphs. The construction mechanism ma y b e either random or incorporate p referen t ial attac hment. W e ev aluate the statistical prop erties of th e graphs gener- ated, such as the degree distribution and n et w ork diameters, and compare them to some real-world graphs. I. INTRO DUCTION The structural and statistical prop erties of netw or k s hav e be en studied intensiv ely over the last decade [1, 2], due to their ubiquitous impor tance in techn ology , differ- ent rea lms of life and complex system theory in g e neral [3]. With time it was realized that the topo logical prop er- ties of r eal-world netw orks o ften tra nscend the universal- it y class of both the straightforward, all-ra ndom Er d¨ os- R ´ enyi graph [4], as well as that of random netw o r ks with arbitrar y degr ee distributions [5 ]. Many r eal-world netw o r ks have a well defined commu- nit y str ucture [6]. A communit y is, lo o sely sp eaking , a subgraph which has a n intra-subgraph link density which is substantial ab ove the a verage link- densit y o f the who le net work. The communit y with link densit y equal to one is deno ted in gra ph theory as a ‘clique’. A clique is a fully interconnected subgr aph, the smallest clique having just t wo vertices. A clique is als o a sp ecific realiz a tion of a graph motif, i.e. of subgraphs with definite top olog ies [7, 8], a nd of k -cores , viz subgraphs with a t least k in terconnections [9]. In a related w ork Derenyi et al. have introduce d the notion of c lique p erc olation in the c ont ext o f overlapping graph commun ities [10]. F or scale free graphs, ha ving a deg ree dis tribu- tion p k ∼ k − γ , th e second moment h k 2 i d iverges for the impo rtant ca se 2 < γ < 3 and finite num b ers of cliques of arbitra ry size emerge [11]. F or any graph one ca n define a characteristic c lique distribution P C ( S ), viz the pro bability for a clique of size S to occur. A lo opless graph, exclusively has, cliques of size t wo with P C ( S ) = δ S, 2 and the n umber o f 3 -site cliques is related to the standard clustering co efficient [1, 2]. The clustering co efficient C is a normalized measure for the o ccurrence of 3-site loops, with ev ery 3-site lo o p being part o f at lea st o ne clique of size S ≥ 3 . It is therefore of in terest to inv estiga te the clique distri- bution of rea l- w orld g r aphs and to consider the pro blem of constructing graphs with sp ecific clique distr ibutions. II. ALGORITHM W e consider a given set o f cliques C 1 , . . . , C M contain- ing S i = S ( C i ) s ites each, an instant iation of a cer tain FIG. 1: Illustration of a clique- conserving algorithm gener- ating a connected graph out of a given set of cliques. St art- ing with a 5- site clique (1,2,3,4,5) in step one, a 4-site clique (5,6,7,8) and a 3-site clique (8,9,10) are added in step tw o and three via a single common vertex. clique distribution P C ( S ). W e presume the c liq ue-set to be monotonically or dered, S i ≥ S i +1 , i = 1 , . . . , M − 1 , (1) as illustrated in Fig . 1. W e study the task to gener- ate r e cursively a dense and co nnected g raph out of the M cliques { C i } in such a wa y that the final gr aph has exactly the s ame distribution P c ( S ) of fully connected subgraphs, viz o f cliques. In Fig. 1 we illustrate the sim- plest pro cedure for solving this task, b y co ncatenating the cliques C 1 , C 2 , .. via a single co mmon vertex b e- t ween tw o co ns ecutive cliques. Let us shortly digress and consider what would hav e happ ened if we had used sites 4 and 7, together with a new site 9 to attach the S 3 = 3 clique in the third s tep for the case illus trated in Fig. 1. In this ca se sites 4 and 7 would b e connected and a spur ious 3 - site clique, namely (4,5,7), w ould hav e been gener a ted. A thought- less attac hment of cliques in gener al there fore g enerates spurious additional cliques, resulting in an uncontrolled clique distribution for the final g raph. 2 FIG. 2: Illustration of the den se hierarchical algorithm for generating dense graphs out of a given set of cliques. S tarting with the largest clique (1,2,3,4,5), here of size S 1 = 5, in step 1, cliques of size S i ( i = 2 , 3 , . . . ) are added consecutively step by step by adding one ad d itional vertex at each step and using S i − 1 ve rtices from a previously add ed clique. The second clique is here ( 3,4,5, 6) and the t h ird clique (4,6,7). Both random and preferentia l attac h ment may b e used. A. Hierarc hical algor ithm In general one can join t wo cliq ues of sizes S 1 and S 2 via common vertices. The minimal num b er of common vertices is one, the maxima l is min ( S 1 , S 2 ) − 1 . (2) Using mo re co mmon sites, na mely min ( S 1 , S 2 ), w ould result in the destr uction of the smaller clique. W e ca n then formulate a clas s of hierarchical algorithms conser v- ing a given, a r bitrary but order ed, via (1), initial clique distribution: [1 ] A t s tep m = 1 , ..., M one adds the clique C m with S m = S ( C m ) sites. One starts by s electing a num- ber ˜ S m ∈ [1 , S m − 1]. Here we will mostly concen- trate on the case ˜ S m = S m − 1. [2 ] Next o ne selects r ecursively ˜ S m m utually inter- connected vertices out of the graph seg men t con- structed in the pr evious m − 1 steps . The new clique is then added b y mutually c o nnecting S m − ˜ S m new sites among themselves and with the ˜ S m selected sites of the existing gra ph segment. W e call the choice ˜ S m = S m − 1 the ‘dense hierarchi- cal algorithm’; it is illustra ted in Fig. 2. Here we will study ex clusively the dense algor ithm, which results in quite dense net works. The opp osite limit, namely the case ˜ S m = 1 in step [1] of the hierarchical algo rithm, is illustrated in Fig. 1. Starting with M cliques the dense hierarchical algo- rithm genera tes a netw o rk co n taining N s ites in its final state, with N = S 1 + ( M − 1) , (3) with S 1 being the size of the starting c liq ue, which is also the largest. This is so, b ecause ex actly one new vertex is added at each of the ( M − 1) steps. B. Random vs. preferential attac hment The sele c tion of the ˜ S m vertices in step [2] can be done either randomly , b y prefer en tial attac hment o r other rules. When considering preferential a ttachm ent w e first select a single v ertex i with an attac hment pro ba bilit y Π( k i ) prop ortiona l to the vertex-degree k i , Π( k i ) = k i P J j ( k j ) (4) (linear pre ferent ial a tta chment ). W e then select recur- sively ˜ S m − 1 vertices out of the neighbors of i via pref- erential attachmen t. The set of p oss ible vertices is g iven, at every step of this recur sive selection pro cess, b y the set of vertices linked to all sites previously selected. No te that the ordering (1) of the initial clique dis tribution is a precondition for the hierar chical a lgorithm to function. C. Decimation algorithm F or further reference we shortly mention a sec o nd clique-conser ving alg orithm for netw ork construction via vertex decimation. Star ting with a n initial net work o f M unconnected cliques C 1 , ..., C M one selects pair s of unconnected vertices either randomly o r via pr eferential attachmen t. One then a ttempts a decimation by merg- ing the tw o selected v ertices into a single v ertex. One then c a lculates the clique distribution of the new net work which has one less site. If the new clique distribution is ident ical to the original distribution the decimation is accepted, or else it is rejected. II I. SIMULA TION RESUL TS W e have studied the pro per ties of the hier a rchical clique-conser ving graph-gener ation algorithm extens iv ely using numerical r esults, ev alua ting their res pective sta- tistical pr op erties and co mparing them t o so me selected real-world gra ph. A. Initial clique distribution The hiera rchical g raph gener ation algorithm, conserves per co nstruction the initial clique distribution P C ( S ). W e hav e studied tw o cases. In Sect. IV we will discuss the 3 1 100 degree k 1e-06 1e-05 0.0001 0.001 0.01 0.1 1 p k M = 10 3 10 4 10 5 M=10 3 M=10 4 M=10 5 FIG. 3: The degree distributions p k for graphs with scale- free clique d istribution, compare Eq. ( 5), and an ex p onent α = 2 . 6. Blue squ ares are for a system of M ≈ 10 5 cliques, green stars and red d iamonds show systems fo r 10 4 and 10 3 cliques re sp ectivel y . The d ata is o btained b y a veraging ov er 1000 / 26 3 / 19 realizations for P C ( S ) for cliqu e-num b ers M equal to 10 3 / 10 4 / 10 5 . results obtained by using the measured clique distribu- tion of r eal-world netw orks for P C ( S ). Here we will con- centrate on some of the model clique distributions , in particular of scale- fr ee form P C ( S ) ∼ 1 S α , α > 2 . (5) W e p e r formed sim ula tions for v ario us exponents α , and scale-free clique-distributions con taining a tota l n umber M of c liques. F or the simulations a cut-off S 1 needs to be chosen for the scale-free distribution (5), i.e. the maximal clique-size S 1 . The exp ected num b er N S 1 ( S ) of cliques is then N S 1 ( S ) = 1 S α M P S 1 S ′ =1 (1 /S ′ ) α , (6) where M is the total num b er of cliques. W e selected S 1 by the condition N S 1 ( S 1 ) > 1 , N S 1 ( S 1 + 1) < 1 , (7) viz t hat there is at lea st one clique of size S 1 present on the a verage. W e compared res ults obtained for M ranging typical fro m 10 3 − 10 5 , in order to extract scaling prop erties in the large-netw ork limit. In order to extract reliable sta tistical prop erties the results w ere av erage d ov er N r eal different ra ndom rea lizations. When selecting the v alue S 1 for the maximal clique size one discar ds all cliques with s izes S > S 1 . This is admis- sible when the p ercentage of discarded clique s is small. With the criteria (7) the p ercentage o f disc a rded cliques v anishes in the thermo dynamic limit M → ∞ . F o r the system of order 10 4 , 10 5 , the p ercentage o f dis c a rded is well b elow 1 %. 1 10 100 1000 degree k 1e-05 0.0001 0.001 0.01 0.1 1 p k preferential attachment random attachment preferential attach. slope random attachment slope FIG. 4: The degree distribution p k for graphs having a scale- free clique distribution with α = 2 . 6 and M ≈ 10 4 cliques. Shown are res ults b oth for random and preferential attac h - ment with lines indicating the resp ective slopes − 2 . 7 (ran- dom) and − 2 . 5 (preferen tial). B. System-size analysis In Fig. 3 we present the degree distribution p k for graphs with a scale-free clique distr ibution (5) and an exp onent α = 2 . 6, g enerated through the hierarchical algorithm with pr eferential a ttachm ent. The degree dis - tribution r e s ults from av e r aging N r eal = 100 0 , 2 63 , 10 realizations for clique distributions containing M ≈ 10 3 , 1 0 4 , 1 0 5 cliques. W e note that the degr ee dis tr i- bution approaches a well defined curve for the thermo- dynamic limit M → ∞ . The degree dis tributions shown in Fig. 3 h av e bum ps at high degr ees for finite n umbers of cliques M . This is due to the fact that the algor ithm starts by incorp or at- ing the la rge c liq ues first so that vertices with a n hig h initial degree see it f urther increase d via the preferential attachmen t during the construction pro cess. This effect v anishes in the thermo dynamical limit a s the proba bilit y of a given vertex to b e c hosen as a part of a new clique decreases with system size. The statistical analysis of the netw orks presented in Fig. 3 are given in T a ble I, the num b er of cliques M and T ABLE I : Statistical p roperties of graphs (compare Fig. 3) conta ining M ≈ 10 3 , 10 4 , 10 5 cliques generated by the hier- arc hical algorithm with preferential attac hment, using a scale- free clique distribution (5 ), w ith an exp onent α = 2 . 6. C is the clustering co efficient, ℓ the a verag e path le ngth, h κ i the a verage degree, D the netw ork d iameter, d the link density and N the total num b er of vertices. m is t he slope of the degree d istribution p k measured for k ∈ [10 , 40] for M ≈ 10 3 and k ∈ [10 , 100] for M ≈ 10 4 , 10 5 . M C ℓ D h κ i d N m 986 0.34 3.2 7.5 5.1 0.00508 1007 -2.6 9979 0.36 3.3 8.8 5.7 0.00056 10032 -2.7 99999 0.37 3.4 9.8 5.8 0.000058 100096 -2.4 4 1 10 100 1000 10000 degree k 1e-06 1e-05 0.0001 0.001 0.01 0.1 1 p k 2.1 2.6 3.2 FIG. 5: The degree distribution for t hree scale free clique distributions with exp onents α 1 = 2 . 1 (maroon p lus, 11 sim- ulation runs), α 2 = 2 . 6 (red d iamonds, 26 sim ulation runs), α 3 = 3 . 2 (yello w triangles, 15 simula tion ru n s), for M ≈ 10 5 cliques. the num b er of vertices, N obey the relation (3) v alid for the dense hierarchical a lgorithm. The resulting degree distribution, a pproaches w ithin the n umerical errors , a scale-free functional dep endence with a n expo nen t | m | approximately given by the expo nen t α = 2 . 6 of the co n- served clique distribution P C ( S ). In Fig. 4 we compa re the degree distributio n betw e e n construction rules with pr eferential and random a ttach- men t resp ectively . The difference is quite small in the re- gion of small to intermediate degree s k , where the finite- size corr ections are minor, the reaso n b eing the algo rith- mic r estriction, that o nly common neigh bo rs of the al- ready pro cessed vertices can b e used to co ns truct a clique iteratively . This restr ic tion decrea ses the n umber of ver- tices av ailable for the preferential attachmen t and results in a similar deg ree distribution, which is ho wev er slig h tly different from the ideal sca le fr ee line . C. Dep endency on the scaling exp onent W e ha ve studied the prop erties of the graphs gener- ated by the hierarchical algorithm for scale- free clique distributions P C ( S ) a nd se veral scaling exp onents α . W e hav e analyzed the cor resp onding gra phs as a function of clique-num b ers M ≈ 10 3 , 10 4 , 10 5 , averaging ov e r sev- eral clique-distribution r ealizations. The resulting degree distributions are shown in Fig. 5 for the case M ≈ 1 0 5 , the corres ponding statistical analys is in T able II. In order to estimate the finite-size corrections we present in T a - ble I I I the corresp onding results for M ≈ 1 0 4 . W e note, in particular, a go o d a g reement in the e s timates for the scaling exp onent | m | of the res ulting deg ree distr ibution. Int erestingly enough, the exp onent | m | for the degree distribution o f the graph generated by the hierarchical al- gorithm with preferential a ttac hment satur ates at ≈ 3 . 1 , close to the v alue 3 exp ected for the standard prefer- ent ial attachmen t algor ithm [1]. When α < 3 the large T ABLE I I : Statistical prop erties of graphs (compare Fig. 5) conta ining M ≈ 10 5 cliques generated b y the h ierarc h ical al- gorithm with preferential attachmen t . α d enotes the scaling exp onent for the cl ique distribution P c ( S ), C the clustering coefficient, ℓ the a vera ge path length, h κ i the a verage degree, D is the net w ork diameter, d is the l ink density and N the total num b er of vertices. m is th e slop e of th e degre e distri- bution p k measured for k ∈ [10 , 100]. α C ℓ D h κ i d N m 2.1 0.51 3.2 9.2 9.9 0.000098 100099 - 2.1 2.6 0.36 3.4 9.8 5.8 0.000058 100096 - 2.4 3.2 0.23 3.7 11.3 3.8 0.000038 100042 - 3.1 4.2 0.10 4.1 13.4 2.8 0.000027 100020 - 3.2 tail of the degree distribution stemming directly from the clique distr ibution do minates the resulting exp onent | m | for the degr ee distribution, but fails to do s o for α > 3, when the preferential attachmen t mec hanis m dominates the generatio n of the fat tail. Next, we commen t on the size of the net work diameter D o f the generated graphs. With increa sing α w e ob- serve an incr easing av era ge path length ℓ a nd a n increa s- ing average diameter D while the c lustering co efficie nt C decreases. The netw ork diameter is intuitiv ely affected by the n umber o f low-degree v ertices . A lar ger n um b er of low-degree v ertices for degree distributions of identical functional dependences , generally results in a bigger net- work diameter. Alternatively one may cons ider the num- ber o f trivial cliques, na mely those with size S = 2, viz edges not forming part of any larger clique. They tend to connect to low-degree vertices, since tw o co nnected hig h- degree vertices would ha ve a higher pr o bability to be lo ng to cliques of size 3 or large r . In order to examine the influence o f these trivia l cliques on the net work diameter we have eliminated, from the graph generated by the hierar c hical a lgorithm with M ≈ 10 4 and α = 2 . 1 , 2 . 6 , 3 . 2 , 4 . 2 all cliq ues of size S = 2. The statistical prop erties o f the r e sulting graph are given in T a ble I I I. The net work diameter ℓ decr e ases substantially a nd the cluster ing C increases. W e note that the scaling exp onent m for the degree distribution remains unaffected, as it dep ends o n the vertices with large degr e es only . This result is nev er theless somewha t surprising, in view of dra matic r e duction in the num ber of vertices N resulting fro m the de c ima tion of all trivial cliques. IV. COMP ARISON WITH REAL W ORLD D A T A W e hav e ev alua ted the clique distributions P C ( S ) for t wo real-world netw or k s, a protein-pr o tein interaction net work [14] and a WWW-gra ph [1 2]. W e then hav e used the resulting clique distributions P C ( S ), as the starting po in t for the hier archical algorithm with pr eferential at- tachmen t and compared the hence ge ne r ated graphs with 5 T ABLE I I I: Left table: S tatistical prop erties o f g raphs with M ≈ 10 4 cliques a nd v arious sca ling exponents α f or the clique distribution P C ( S ). C is the clustering co efficien t, ℓ th e av erage path length, h κ i the av erage degree, D the netw ork d iameter, d the link density , N the total number of vertice s and m the slope measured b etw een degree 10 and 60. The degree distributions result from av eraging N r eal = 86 , 263 , 866 , 306 realizations for clique distributions h aving α = 2 . 1 , 2 . 6 , 3 . 2 , 4 . 2. Right table: The same data as for the left table, but with all cliques of degree S = 2 remo ved from the graphs. α C ℓ D h κ i d N m 2.1 0.51 3.1 7.5 10.5 0.00104 10093 -2.0 2.6 0.36 3.4 8.8 5.6 0.00056 10032 -2.5 3.2 0.23 3.7 10.0 3.8 0.00038 10017 -2.9 4.2 0.10 4.1 11.8 2.7 0.00027 10007 -3.1 α C ℓ D h κ i d N m 2.1 0.94 2.73 4.1 16.7 0.0028 5885 -2.0 2.6 0.92 2.77 4.5 10.0 0.0021 4625 -2.5 3.2 0.90 2.77 4.9 7.2 0.00206 3491 -3.0 4.2 0.97 2.74 5.0 5.5 0.0024 2207 -3.0 the prop erties of the origina l rea l-world net works. Fig. 6 shows the clique and the degree distr ibutions of the resp ective orig inal gr aphs, with their corresp ond- ing statistical prop erties given in the T able IV. W e note that the protein-interaction gra ph co nt ains cliques of up- to ten sites, where a t ypical clique-size is sligh tly larger in the WWW-net. The scaling of the degree distribution p k is clearly observ a ble f or the WWW -net, but only in- dicative for t he protein-in teraction netw orks, due to t he limited nu mber of vertices it contains. In T able IV w e hav e als o inc luded the prop erties of the graphs gener a ted by the hierarchical algo r ithm using preferential a ttac hment. The main difference b etw een the generated net works analyzed in T able IV and those previously discussed, is the fact that they ar e not av- eraged over an ensemble of rea lizations of a clique dis- tribution. The re ason is, that the exact exp erimental clique dis tr ibutions for the protein-interaction net work and for the WWW-netw o rk hav e b een taken as an input for the hierarchical a lg orithm, which is p er construction conserved with res p ect to the clique distributio n. Next w e note tw o ca veats with resp ect t o the protein int eraction graph. Firstly , it is not complete, b eing up- dated contin uo us ly as new exper imen tal results b eco me av ailable [14]. Secondly , the protein-interaction netw or k contains unconnected subsets of vertices. The la rgest comp onent does not enco mpass the en tire g raph but 8972 sites o ut of a total of 9362 vertices. W e hav e used this largest comp onent for the data a nalysis. While analyzing the data presented in T a ble IV we note substa ntial differences b etw een the prop erties of the real-world graphs with resp ect to the one ge ne r ated by the hiera r chical clique-co nserving algo r ithm. These dif- ferences inv olve essen tially all key statistical qua n tities, such as the total n umber of v ertices, the av er age degree, the netw or k diameter a nd the lar ge-k falloff of deg ree distribution. This lea ves u s with t wo p ossible c onclusions, the first being that the clique dis tribution P C ( S ) is pr o bably no t a go o d quantit y for the pur po se of characterizing a given graph, at least in the tw o e x amples considered here. The second is the p ossibility that an altogether differen t clique-conser ving algorithm may be needed for the clique distribution to b e used as a characterizing q uant ity . The data presented in T a ble IV was generated using T ABLE IV: St atistical p rop erties of a HPPI and of a WWW graph. C is the clustering coefficient, ℓ the a verage path length, h κ i the av erage degree, D the diameter, d t he link density , N th e total n umber of vertices, m the slop e measured for k ∈ [10 , 44] for the real data ( k ∈ [10 , 20] for the generated graph and k ∈ [10 , 100] for generated WWW data). data source C ℓ D h κ i d N m real 0.11 4.3 14 7.8 0.00085 8972 -2.5 HPPI gener. 0.20 3.8 11 3.0 0.00016 25747 -3.5 real 0.23 7.2 46 3.0 0. 000009 325729 -2.8 WWW gener. 0.27 3.751 12 4.1 0.000 0086 475588 -3.6 the hiera rchical a lgorithm with prefer en tial attachmen t, how ever, a s discussed a bove (see Fig . 4 ), the difference betw een r andom and pr eferential a ttac hment is actually quite small for clique distributions having a fat tail. V. DISCUSSION In this paper w e pres en ted an algo rithm, the hier archi- cal a lgorithm, by which one can g enerate gr aphs having a pr e -determined distribution of cliques, viz of fully con- nected subgraphs. W e hav e studied, in a fir st step, the degree distribution of the r esulting netw or ks for sca le-free clique distr ibution a s a function of the s caling exp onent. In a second step we used tw o se le cted real-world graphs, a protein-interaction netw o rk and a WWW- net work, and examined the rela tion be t ween their deg ree and clique distributions rela tive to tho se of gra phs gen- erated via the hierarchical algor ithm having the same r e - sp ective clique distribution. W e find no go o d agreement, and this leads us to the conclusion that either the clique distribution is insufficient for a in-depth characterization of real-world net works or that the hier a rchical algor ithms need further developmen t. 6 1 10 100 clique size 1e-05 0.0001 0.001 0.01 0.1 1 P C www clique distribution hppi clique distribution 1 10 100 1000 degree k 1e-05 0.0001 0.001 0.01 0.1 1 p k www degree distribution hppi degree distribution FIG. 6: Left fi gure: Clique distribution P C ( S ) of the WWW data set [12] and Hu man Protein Protein Interaction Database (HPPI) [14]. The distributions h a ve the exp onents α www = − 5 . 5, α hppi = − 6 . 2. The statistical prop erties are given in T able IV Right figure: Degree distribution p k of the same data shown in left figure. Contin uous lines show t he resp ective slop e of m www = − 2 . 8, m hppi = − 2 . 5. The statistical prop erties are giv en in T able IV [1] R. Alb ert and A . Barab` asi, “Statistic al me chanics of c omplex networ ks” , Reviews of Mo dern Physics 74 , 47 (2002). [2] S.N. Dorogo vtsev and J.F.F. Mendes, “Evolution of net- works” Adva nces in Physics 51 , 1079 (2002). [3] C. Gros, “Complex and A daptive Dynamic al Systems, A Primer” , Springer (2007, in press). [4] P . Erd¨ os an d A. R´ enyi, “On r andom gr aphs” Publica- tiones Mathematicae 6 , 290 (1959). [5] M.E.J. Newman, S.H. Strogatz and D .J. W atts, “R an- dom gr aphs with arbitr ary de gr e e distributions and their applic ations” , Phys. Rev . E 64 , 026118 (2001). [6] G. P alla, I. Deren yi, I. F ark as and T. Vicsek, “Unc overing the overlapping c ommunity structur e of c omplex networks in natur e and so ciety” Nature 435 , 814 (2005). [7] R. Milo et al . “Network Motifs: Simple Buildi ng Blo cks of Complex Networks” 298 824 (2002). [8] A. V azqu ez, R. Dobrin, D. Sergi, J.-P . Eckmann, Z.N. Oltvai and A.-L. Barabasi , “The top olo gic al r el a- tionship b etwe en the lar ge-sc ale attributes and lo c al inter- action p atterns of c ompl ex networks” , Pro c. N at. Acad. Sci. 101 , 17940 (2004). [9] S.N. D orogo vtsev , A.V. Goltsev and J.F.F. Mendes, “k- Cor e Or ganization of C omplex Networks” , Phys. R ev. Lett. 96 , 040601 (2006). [10] I. Derenyi, G. Pa lla and T. Vicsek, “Cli que p er c ol ation in r andom networks” Phys. Rev. Lett. 94 , 160202 (2005). [11] G. Bianconi and M. Marsil i, “Emer genc e of lar ge cliques in r andom sc ale-fr e e networks” , Europhys. Lett. 74 740 (2006). [12] R. Alb ert, H. Jeong, A.-L. Barab´ asi, “Diameter of the world-wide web” Nature 401 , 130 (1999). [13] L. L au ra, S. Leonardi, G. Caldarelli, P . De Los Rios, ”A Multi-L ayer Mo del for the Web Gr aph” , 2002 [14] S. Mathiv anan et al. “A n evaluation of human pr otein- pr otein i nter action data in the public domain ” , BMC Bioinformatic s 7 (Suppl 5), S19 (2006).
Original Paper
Loading high-quality paper...
Comments & Academic Discussion
Loading comments...
Leave a Comment