Human dynamics revealed through Web analytics
When the World Wide Web was first conceived as a way to facilitate the sharing of scientific information at the CERN (European Center for Nuclear Research) few could have imagined the role it would come to play in the following decades. Since then, t…
Authors: Bruno Goncalves, Jose J. Ramasco
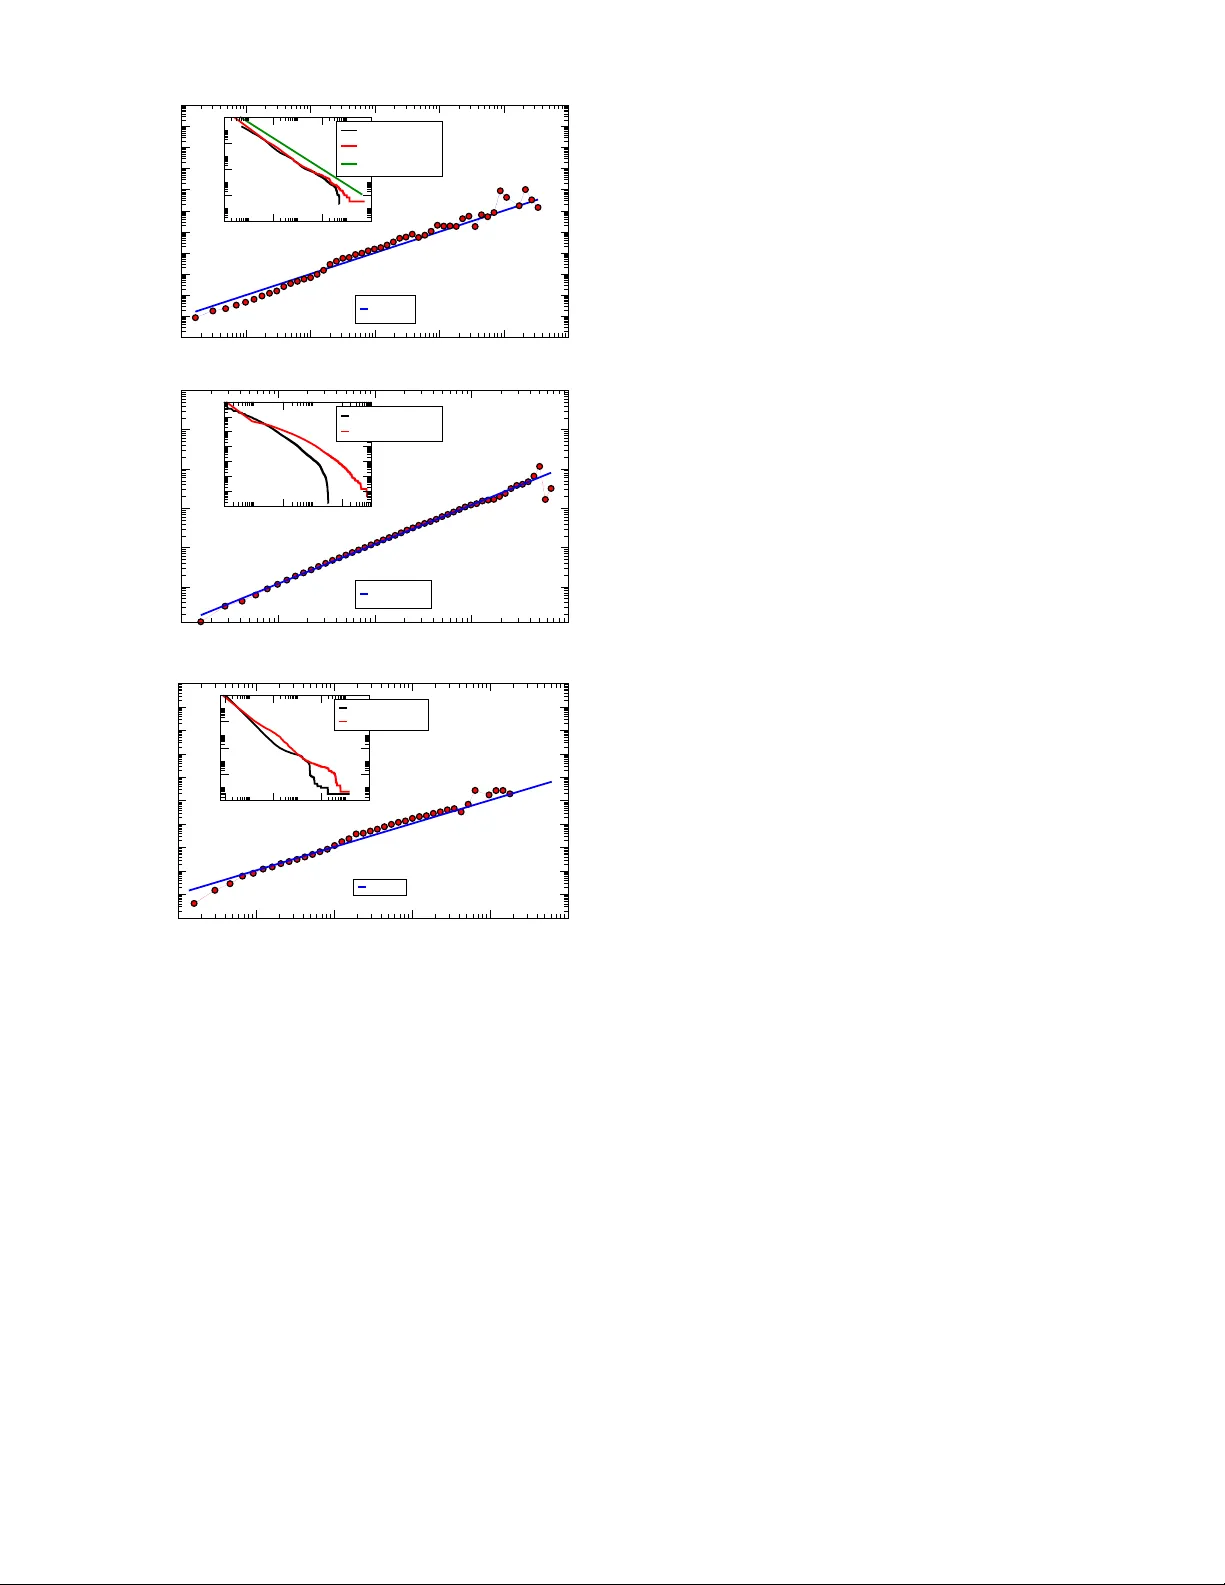
Human dynamics rev ealed through W eb analytics Bruno Gon¸ calv es ∗ Physics Dep artment, Emory University, Atlanta, Ga 30033 Jos ´ e J. Ramasco † Complex Systems L agr ange L ab or atory, Complex Networks (CNLL), ISI F oundation, Viale S. Sever o 65, I-10133 T urin, Italy (Dated: No vem b er 2, 2018) When the W orld Wide W eb w as first conceived as a w ay to facilitate the sharing of scientific information at the CERN (Europ ean Center for Nuclear Research) few could hav e imagined the role it would come to pla y in the following decades. Since then, the increasing ubiquity of In ternet access and the frequency with whic h people in teract with it raise the p ossibility of using the W eb to b etter observe, understand, and monitor several asp ects of h uman so cial behavior. W eb sites with large num b ers of frequently returning users are ideal for this task. If these sites b elong to companies or universities, their usage patterns can furnish information ab out the working habits of entire p opulations. In this work, we analyze the prop erly anonymized logs detailing the access history to Emory Universit y’s W eb site. Emory is a medium size universit y lo cated in A tlanta, Georgia. W e find interesting structure in the activity patterns of the domain and study in a systematic wa y the main forces b ehind the dynamics of the traffic. In particular, we find that linear preferen tial linking, priorit y based queuing and the deca y of the interest for the conten ts of the pages are the essential ingredien ts to understand the wa y users navigate the W eb. P A CS num b ers: 89.75.Hc,89.70.-a I. INTR ODUCTION The access to Internet has b ecome increasingly pop- ular during the last decade. Ho wev er, despite its im- p ortance, m uch is still unkno wn ab out the W eb in trin- sic prop erties, the w a y people interact with it, and ho w it impacts our culture [1, 2, 3, 4]. Sev eral theoretical approac hes hav e b een prop osed in the last few years [5, 6, 7, 8, 9, 10, 11, 12] but some fundamental issues remain y et to b e fully understoo d. In this work, w e will fo cus on answ ering the following question. Do any laws go vern the wa y and frequency with which a person vis- its a given W eb site or is eac h individual intrinsically unique? F rom a so ciological p oin t of view, we w ould exp ect that, although the b ehavior of a single individ- ual is ultimately p ersonal and unpredictable, many in- ferences can b e obtained ab out the most common b e- ha viors [2, 13]. A b etter understanding of the wa y an individual uses a given W eb site has imp ortant economic consequences, as it can help the developers of the site optimize it in a w ay that facilitates its use, and mone- tization. Apart from the utilitarian p oin t of view, the activit y patterns on the sites pro vide also important in- formation on the dynamics of a p opulation. The interac- tion with electronic devices or virtual instruments, such as so cial sites or mobile phones, opens promising researc h a ven ues in this direction [14, 15, 16, 17, 18, 19, 20]. The sheer size and div ersity of the W orld-Wide W eb ∗ Electronic address: bgoncalv es@physics.emory .edu † Electronic address: jramasco@isi.it 10.1.123.2 10.1 12.115.2 10.1 12.1 1.27 www .rec.emory .edu www .physics.emory .edu www .cie.emory .edu www .emory .edu 10.10.50.21 1 FIG. 1: Schematic representation of the interactions b et ween users and W eb pages. The system is dynamic, to provide a more visual impression of its v ariabilit y dashed lines represen t new added connections. renders the attempts to characterize it on a global scale hardly feasible. Still sev eral w orks ha ve recen tly cen tered in describing from a statistical persp ective the structure of the W eb [21, 22]. If instead of understanding its struc- ture the goal is to track how users na vigate it, the chal- lenge b ecomes even greater. A solution consists in ignor- ing the identit y of the users, fo cusing only on the num- 2 b er of visitors p er site and on the num b er of clicks on its hyperlinks [18, 23]. Another p ossibility is to concen- trate the atten tion on to a group of v olunteers [24] or on to the users of a social site that are usually well iden tified [25, 26, 27]. Our aim here is to follow the activity of individually track able W eb surfers in a relatively op en en vironment and characterize the w a y in which the in- teraction b etw een users and W eb sites o ccurs. This is the reason wh y we analyze the logs of the W eb server of Emory Universit y . These logs registered the requests b y Internet users, internal or external, of W eb pages in the second level of the Emory domain ( www.emory.e du ). The data comprehends a p erio d that go es from Apr. 1, 2005 to Jan. 17, 2006. Each time a computer connects to the In ternet, it is assigned a unique IP address that iden- tifies it. When a user requests a page from a W eb site, the IP , the page requested (URL), the time at which the request o ccurred and sev eral other details are registered b y the W eb serv er. In our case, to preserve priv acy the data has b een anonymized in a coheren t wa y , allowing us to follo w the b eha vior of eac h IP by a single ID num b er but masking the real identit y . The log structure is repre- sen ted schematically in Fig. 1. On the left, we hav e the anon ymized IP addresses whic h connect to the URLs on the right. T o av oid the consideration of different elements of a W eb such as photos or logos as indep endent pages, w e hav e restricted our definition of URL to (s)htm(l) , cfm , php , asp(x) , jsp and txt do cuments. Eac h line of the logs corresp onds to a differen t connection, that is times- tamp ed with the date and time at whic h it to ok place. During our observ ation p eriod, the domain received ov er 3 million visitors to ab out 2 . 5 million pages for a grand total of ov er 53 million clicks. I I. A CTIVITY P A TTERNS OF THE POPULA TION Let us start b y taking a view of the collective b eha vior of the entire population during the time p erio d for whic h w e ha ve data. In tuitiv ely , we exp ect the activit y on a domain to v ary from da y to da y , w eek to week and even mon th to month. In particular, it should b e p ossible to observ e v ariations in the activity , seen as the n umber of requests, due to week ends, holida ys and other ma jor ev ents that disrupt the normal life of the Univ ersit y . The traffic at Emory is dominated by students and professors in the course of their professional activities and hence the ma jor ev ents in the course of the school y ear, such as the b eginning and end of a semester, breaks or holidays, should be noticeable in the W eb traffic. In order to c heck this idea, the n umber of page requests detected p er da y is sho wn in Fig. 2 as a function of the observ ation date. One ob vious feature of the figure is a clear oscillatory b ehavior with a p erio d of one week. It also displa ys different trends for tw o special times of the y ear: one at the later part of August, corresponding to the b eginning of the school y ear, and the other at the end of December, when the Apr 1 May 1 Jun 1 Jul 1 Aug 1 Sep 1 Oct 1 Nov 1 Dec 1 Jan 1 1 2 3 4 Clicks/day (x10 5 ) FIG. 2: T otal num b er of clic ks registered p er da y during the whole p eriod of traffic observ ation. The gray bands corre- sp ond to the beginning and the end of the semester: from Aug 16 to Aug 31, and from Dec 16 to Dec 31. semester finishes. Since accesses to Emory domain are mostly w ork re- lated, traffic can b e used as an indirect measure of the Univ ersity ”productivity”. Busier days would result in larger amoun ts of traffic, while during holidays and w eek- ends the num b er of page requests is ov erall smaller, thus rendering the relative changes in traffic significant. The a verages of page requests by day of the w eek during the complete observ ation p erio d are plotted, together with their corresp onding 95% confidence in terv als, in Fig. 3. Our results supp ort the old adage that after W ednes- da y , the hardest part of the w eek is already b ehind us, with the activity slowly decreasing from then on to the w eekend. Sundays are the least active day of the week. Mon 21 Tue 22 Wed 23 Thu 24 Fri 25 Sat 26 Sun 27 Mon 28 Tue 29 0.5 1.0 1.5 2.0 2.5 3.0 Pageviews/day (x10 5 ) Thanksgiving Average FIG. 3: Comparison b et ween the av erage week activity and activit y during Thanksgiving week. The green v ertical lines represen t the b eginning and end of the official Thanksgiving break at Emory Universit y . The error bars for the a verage are calculated as tw o times the standard deviation, 2 σ , or the 95% confidence in terv al. 3 06:00 08:00 10:00 12:00 14:00 16:00 18:00 20:00 22:00 00:00 02:00 04:00 Hours 4 6 8 10 12 14 Pageviews/hour (x10 3 ) Weekdays Saturdays Sundays FIG. 4: Average hourly activity in the complete Emory do- main as a function of the hour of the day . The curves are a veraged ov er the weekda ys (circles), Saturda ys (squares) and Sunda ys (triangles). It is also in teresting to note the not-so active b ehavior of Mondays, only slightly more activ e than Saturdays. Armed with an estimate of ho w activity evolv es o v er the w eek, we are now in a p osition to ev aluate the effects of a break. In the same Figure, we also represent the data for the days surrounding Thanksgiving, one of the ma jor holidays in the US. T raditionally , Thanksgiving recess go es from Thanksgiving Thursda y till Sunday , so one might exp ect an y decreases in activity to b e most noticeable during this p eriod. This is what we observe, but w e find other effects as w ell. Both the Monda y before and after Thanksgiving seem to b e less pro ductiv e than normal. This is ho wev er complemented with busier than usual T uesdays b efore and after the break. In tra day v ariations, with some times of the day b eing busier than others are also seen. By av eraging the ac- tivit y observ ed at a given hour ov er all the w eekdays in our data set, w e obtain Fig. 4. The most active p eriod is b et ween 7AM and 6PM. The large dip b etw een 11AM and 2PM is due to the lunch break. After lunch, the ac- tivit y peaks reac hing the higher level of the day . After 6PM activity lev els off until 10PM, marking the end of the workda y . Saturda ys do not differ significantly from other da ys of the week, only Sundays displa y a different activit y profile. Similar patterns for human circadian rh ythms hav e b een recently reported for other systems in Refs. [15, 17, 18]. Such ubiquity indicates imp ortan t univ ersal features (profiles) regarding human habits that W eb analytics can help to c haracterize in a quan titative w ay . I II. INDIVIDUAL A CTIVITIES Although interesting, the analysis of av erages taken o ver the entire p opulation has limitations. The his- tograms of single user activity are typically very wide, b eing in some cases well-modeled by p o wer-la w distri- butions with exponents smaller than 2 [23]. When this happ ens, it is difficult to identify a ”typical” user based on suc h metrics: while most users only visit the domain sites a few times, a significan t fraction of individuals (as iden tified by their IP addresses) accumulate large num- 13:05 13:25 13:55 14:05 14:25 14:45 15:05 time April 4 500 1000 1500 2000 Clicks/minute 13:05 13:25 13:55 14:05 14:25 14:45 15:05 0 0.5 1.0 1.5 2.0 Cumulative (x10 5 ) a) May 1 Jun 1 Jul 1 Aug 1 Sep 1 Oct 1 Nov 1 Dec 1 Jan 1 50 100 150 200 250 300 350 Clicks/day May 1 Jun 1 Jul 1 Aug 1 Sep 1 Oct 1 Nov 1 Dec 1 Jan 1 time 0 2 4 6 8 Cumulative (x10 4 ) b) Jul 1 Aug 1 Sep 1 Oct 1 Nov 1 Dec 1 Jan 1 time 0 100 200 300 400 500 600 700 Cumulative 20 40 60 80 100 Clicks/day c) FIG. 5: Activity history of sev eral individuals: a) what seems to b e a malicious attack on a finance W eb page of the Uni- v ersity , b) an automatic softw are up date program, and c) a h uman user filling data in an administration site. The red curv es represen t the cumulativ e n umber of clicks. T o facili- tate the visualization, the scale of the cumulativ e and temp o- ral num b er of clicks are differen t. The axis on the righ t side of each plot displays the scale for the cumulativ e num b er of clic ks. 4 b ers of page requests. This v ariability deserves greater atten tion since it can carry imp ortan t information. Fig- ure 5 shows the activity patterns of three users. W e do not know the actual IPs but it is possible to deduce the in- ten tion of the visit based on the particular URL accessed and on the profile of the activity . In Figs. 5 a and 5 b , the users are computer programs. One, the case shown in a ), corresp onds to a malicious attack on an finance service W eb page of Emory . It to ok place on April the 4th. The profile of the num b er of access attempts p er unit of time displa ys a v ery peculiar shap e, quite regular as occurs for most automatic navigators, with a very high n umber of requests concen trated in a short p eriod of time. Other, more friendly , robots are those corresponding to up dating programs. An example can be seen in Figure 5 b where a soft ware site in Emory is regularly visited presumably in searc h for new updates. Finally , h uman users show a v ery differen t activity profile from that of the machines. The activit y of a human user selected at random can b e seen in Figure 5 c . In this case the URL is an administrativ e site that demands manual introduction of data. The ac- tivit y congregates in some days follow ed b y relative long p eriods of time without an y request. Giv en the strong v ariabilit y in the activity of h uman users, it is in teresting to measure some statistics about it. In Figure 6, w e ha ve represen ted the histograms of the duration of the p eriods b et ween requests for t wo differen t scenarios: in Fig. 6 a for the time b et ween consecutive visits of the same user to the same URL, P ( τ v ), and, in Fig. 6 b , for the time b et ween clic ks by the same user to an y of the sites in Emory’s domain (not necessarily to the same URL), P ( τ c ). Both distributions are rather wide. The distribution P ( τ c ) can b e well fitted by a p ow er- la w deca ying function of the type P ( τ c ) ∼ τ − 1 . 25 c . The distribution of time b et ween consecutive visits, P ( τ v ), deca ys even more slo wly with an exponent of v alue − 1. This latter v alue can b e understo o d thanks to a mo del on human dynamics recen tly prop osed by A.-L. Barab´ asi [28] (see also [17, 27, 29, 30, 31]). In this mo del, an agent has to p erform a set of tasks each with a random priorit y assigned. A step consists in the selection of the task with the highest priorit y with probability p or of a random one with probabilit y 1 − p . After the execution, a new tasks o ccupies the free sp ot in the queue. This group of rules is extremely simple but is able to repro duce a distribution of w aiting times for the tasks in the queue that, in the limit of small p , decays as ∼ 1 /τ . It can be argued that consecutive visits to the same site in Emory are equiv alent to one of these tasks since many of the visits are related to work or studies, and probably b ear an inheren t sense of priorit y for eac h user. Also returning immediately to the same URL and reloading it is not a common practice, at least not among humans. It is imp ortan t to note that if th e user pushes the bac k bottom in the browser, typically we are not able to detect such a mo ve b ecause it do es not lea v e a trace in the logs of the serv er due to bro wser caching. If each en trance is seen as a fresh start of a different task, the parallelism betw een 10 0 10 1 10 2 10 3 10 4 10 5 10 6 10 7 10 8 τ v (sec) 10 -12 10 -10 10 -8 10 -6 10 -4 10 -2 10 0 P( τ v ) a) ~ τ v -1 10 2 10 4 10 6 10 -12 10 -8 10 -4 10 0 10 1 10 2 10 3 10 4 10 5 10 6 10 7 10 8 τ c (sec) 10 -12 10 -10 10 -8 10 -6 10 -4 10 -2 10 0 P( τ c ) b) ~ τ c -1.25 ~ τ c -1.25 FIG. 6: Distribution of times b etw een consecutiv e clic ks: a) visits of the same user to the same URL, and b) the same user to any page of the Emory domain. The straight lines corresp ond to the p ow er-law f ( τ ) ∼ τ − 1 in a) and to f ( τ ) ∼ τ − 1 . 25 in b). In the inset of b), the distribution of time in the queue is plotted for a v ariation of Barab´ asi’s mo del [28] (see text) with a num b er of executed tasks p er unit of time of ν = 3, with probabilit y of choosing a task according to priorit y p = 0 . 99999, a total of 100 tasks and 10 7 time steps. the rules of the mo del and the wa y users return to the same pages can be justified. The question is then whether there is a wa y to under- stand also the exponent − 1 . 25 of P ( τ c ). The answ er is y es, if one considers that a single click on the domain do es not necessarily hav e to b e related to the realization of a task. Many tasks will require a (fast) sequence of clic ks on different sites of the domain for their comple- tion. This is why w e prop ose the following mo dification of the mo del: each time step, instead of a single task, a group of ν tasks is selected for execution. The selection of eac h of them is done as before: by priorit y with proba- bilit y p , and at random otherwise. W e hav e p erformed a systematic numerical study of this mo del and found that pro vided that ν > 2 the exp onent of the distribution of the time of p ermanence in the queue decays alwa ys as ∼ τ − 1 . 25 . An example with ν = 3 is sho wn in the in- set of Fig. 6 b . These tw o models are o versimplifications but seem able to capture some of the essential features presen t in the dynamics of a large communit y of users leading to the existence of universal exp onen ts. 5 10 0 10 1 10 2 10 3 10 4 10 5 10 6 k IP 10 -2 10 0 10 2 10 4 10 6 10 8 < ∆ k IP > ~ k IP 10 0 10 2 10 4 10 6 k IP 10 -8 10 -6 10 -4 10 -2 10 0 C(k IP ) week C(k IP ) full period ~ k IP -1.2 a) 10 0 10 1 10 2 10 3 10 4 k URL 10 0 10 2 10 4 < ∆ k URL > ~ k URL 10 0 10 2 10 4 k URL 10 -7 10 -5 10 -3 10 -1 C(k URL ) week C(k URL ) full period b) 10 0 10 1 10 2 10 3 10 4 10 5 w 10 -2 10 0 10 2 10 4 10 6 10 8 < ∆ w> ~ w 10 0 10 2 10 4 10 6 w 10 -8 10 -6 10 -4 10 -2 10 0 C(w) week C(w) full period c) FIG. 7: a) Av erage v ariation in a single day of the n umber of differen t visited sites, h ∆ k I P i as a function of the num b er of sites already seen during the previous week, k I P . b) The same t yp e of function but for the n um b er of visitors to an URL, h ∆ k U RL i . And c) the av erage day v ariation of the n umber of clicks on each connection IP–URL as a function of the clic ks accum ulated during the previous week, h ∆ w i ( w ). The insets display the cumulativ e distributions for each quan tity , the black curv es are obtained by splitting the database in one w eek p eriods and av erage ov er all of them, while the red ones are the distributions for the full 292 days p erio d. IV. A TTRACTIVENESS AND PREFERENTIAL LINKING Another asp ect that is worth to explore in the dynam- ics of our database is whether the new connections or new clic ks follo w a preferen tial rule. Preferential linking or the ”rich get richer” effect is a relatively old concept considered originally in a socio-economic context b y E.H. Simon [32]. In the area of graphs theory , it was in tro- duced in 1999 [7] with a mo del inspired in the hyperlinks of the W eb (see also [33, 34]). A few years ha ve passed, and although several attempts hav e been made to c heck the existence of preferen tial linking in a v ariety of sys- tems [26, 35, 36, 37], as far as we know, a systematic study of preferen tiality on the user-W eb relationship is still missing. T o b e precise, if the v ariable under con- sideration x can c hange in time for each element of the system, it is said that it sho ws linear preferen tiality if the v ariation follo ws on av erage an expression of the type h ∆ x i ≈ A x + B , (1) where the av erage h . i is taken ov er all elements i of the system with x i = x , and A and B are constan ts. This mec hanism supp oses that if the update refers to quanti- ties such as num b er of connections or num b er of clicks of a site, the probability that a particular site is chosen to up date is prop ortional to the n umber of connections or clic ks that it has previously accum ulated. More p opular sites concen trate th us higher attention leading to an ag- glomeration pro cess that, after a while, pro duces a very wide distribution of v alues of x . If the relation of Eq. (1) is linear, the distribution P ( x ) can b e approached b y a deca ying pow er-la w function with an exp onen t de- p ending on the v alues of A and B [4]. If it is not linear, t wo simple scenarios can o ccur. Either ∆ x gro ws with x faster than linear and the most p opular elemen t will ev entually congregate a finite fraction of all the av ailable v alue of x , or it is sublinear and the distribution of v alues of x will not b e wide (stretched exp onen tial instead of a p o w er-law) [4, 38, 39]. In our case, the ”elements” of the system are W eb pages and IPs, and the quantit y x can b e, among other things, the num b er of clicks of a certain user on a given URL, which w e call w , the num b er of differen t users that an URL receives k U RL or the num b er of different sites that an IP visits k I P . W e hav e also p erformed a similar study for the activity of the URLs and IPs (defined as the n umber of requests received or sen t), but the results are similar. W e will focus therefore our attention only on k U RL , k I P and w . The v ariation of each of these v ariables ∆ x in a single day is measured after having accumulated the v alues of x for a full w eek. Then an av erage is tak en o ver all the w eeks of the database. The results displa y- ing ∆ x as a function of x are depicted in Fig. 7. The v ariation of k I P , k U RL and w can b e well approached by linear preferen tial functions similar to Eq. (1) (straight lines in the main plots). This means that the rate at whic h users explore the W eb (∆ k I P ), the rate at which p opular pages attract new users (∆ k U RL ) and the rate at which users revisit W eb pages (∆ w ) depend linearly on the previous week p erformance. It should also imply that the distributions P ( k I P ), P ( k U RL ) and P ( w ) are wide and w ell fitted by a pow er-law. In order to c heck this last p oint, w e hav e measured the cum ulative distri- butions C ( x ) = R ∞ x dy P ( y ) for the three quantities. The 6 cum ulative distribution C ( x ) is the probability of hav- ing a v alue of the v ariable greater than x and usually exhibits b etter statistics than P ( x ). Note that if P ( x ) go es as P ( x ) ∼ x − γ , then C ( x ) ∼ x 1 − γ . The results are sho wn in the insets of Fig. 7. In these plots, we hav e also included the cumulativ e distributions estimated ag- gregating the v alues of k U RL , k I P and w for the whole p eriod of the database (292 da ys). The comparison of the cumulativ e distributions obtained for the tw o time windo ws reserves us an important surprise. F or C ( k I P ), the tw o curv es ov erlap and can b e fitted with a p ow er- la w of exp onent γ ≈ 2 . 2. Ho w ever, this is not true for the p opularit y of the URLs, k U RL , or for w . This dif- ference in the output depending on the extension of the time window has imp ortant consequences for mo deling the dynamics of the system. Its origin is related to the fact that in a universit y the time during which a site, or more specifically its con tent, is relev ant closely trac ks the ev olution of the academic year. In general, a similar rule should apply to all the W eb sites. The life time can b e more flexible, dep ending also on the num b er of visitors, but a certain loss of in terest as the time passes since the first online publication can b e expected [12]. After this time, the page do es not attract new users or visits from the old ones at the same rhythm (if attracts any at all). This breaks one of the implicit assumptions of preferen- tial linking: new elements are added at a constan t rate, while the old ones keep attracting attention indefinitely . It also implies that linear preferential linking is not v alid for longer time windows for k U RL and w , and that their distributions cannot b e mo deled as simple (stable ov er time windows) p ow er-laws. T o visualize the life story of URLs, we represent in Figure 8 the n um b er of pages first seen or last seen in the system as a function of time. W e will sa y that a certain URL U is first seen at time t if it receives its first request at t . Complementarit y , the time in whic h U is last seen, disapp earing from the database, is when it receives the 0.5 1.0 1.5 2.0 2.5 3.0 3.5 Number of URLs (x10 5 ) Last seen First seen Apr 1 May 1 Jun 1 Jul 1 Aug 1 Sep 1 Oct 1 Nov 1 Dec 1 Jan 1 0. 0.5 1.0 1.5 2.0 2.5 2. 2.5 Number of URLs (x10 5 ) FIG. 8: The num b er of URLs that are first (last) seen as a function of time. The tw o ma jor ”extinction” and ”creation” ev ents, corresp ond to the beginning and end of the semester and closely matc h the p eaks detected in Fig. 2. last registered visit. Note that, although similar in look, this plot is different from Fig. 2 where w e are plotting the activit y measured as the total num b er of clic ks on the Emory domain as a function of time. Tw o large p eaks can b e seen in Fig. 8. The time of these p eaks coincides with the end and b eginning of the semester. Man y W eb pages seem thus to ha ve a relative short life, probably b eing set up by professors or students that abandon them at the end of the semester. In many cases, even the http addresses are no longer maintained. V. DISCUSSION AND CONCLUSIONS W eb serv er logs ha ve pro ven to be an imp ortan t source of information regarding human dynamics. Here w e hav e offered an extensive study on the medium size W eb do- main of Emory Universit y tracking the users in a consis- ten t wa y for 292 days. A clear signal of human circadian rh ythms has been obtained as w ell as activit y patterns that seem to b e universal since they are in agreement with previous results on mobile phone records or email p osting in social sites. In addition, in this case, the online traffic can b e related to the pro ductivity of the members of the Univ ersity , namely , studen ts, professors and staff. The comparison b etw een the activit y of an ideal a v erage w eek and the w eek con taining Thanksgiving is revealing in this sense, with some da ys concen trating an imp ortan t lev el traffic, muc h higher than the a verage, and others falling clearly b ehind. After the c haracterization of activit y at the whole Uni- v ersity scale, w e hav e mo ved our focus down to the study of statistics of single users. The difference in the na viga- tion patterns b et w een humans and automatic processes, either malicious or friendly , has b een highligh ted. Hu- mans are in general more unpredictable, although a sim- ilar b eha vior might be repro duced by sophisticated auto- matic means. In particular for h uman users, it is imp or- tan t to analyze the statistics of the times b et ween ev ents (clic ks) and compare them with recen tly introduced mod- els based on priority queues. W e ha ve sho wn that indeed suc h mo dels are able to explain the in ter-clicks p erio d distribution if the dyad user-site is considered. F urther- more, a simple modification, in which the num b er of tasks to execute in a short interv al of time is higher than one, can also accoun t for the statistics of times b et w een re- quests of the same user on the whole Emory domain. Finally , we ha ve explored another mechanism that has b een proposed as an imp ortant ingredien t in the dev elop- men t of the W W W , namely ”preferential attachmen t”. Linear preferen tial attractiv eness is detected in all the as- p ects of the traffic contemplated: the rate of exploration of new sites by the users, the capture of new visitors b y the sites or the new clicks received on each connec- tion user-W eb page. In all these cases, the linear relation holds in short perio d of time. F or longer perio ds, the life- time of the W eb pages must b e taken into account, com- plicating substantially the scenario. Preferential linking, 7 priorit y queuing and W eb page aging seem thus to b e es- sen tial factors for an y mo del aimed to characterize W eb surfing. A cknow le dgments— The authors w ould like to thank Alain Barrat, Stefan Bo ettcher, Ciro Cattuto, Helmut Katzgrab er, Filipp o Menczer, Muhittin Mungan, Filipp o Radicc hi, and in general the mem b ers of the Cx-Nets collab oration for useful discussions and comments. W e w ould also like to thank the IT service of Emory Uni- v ersity for access to the database. F unding from the La- grange Pro ject of the CR T F oundation (T orino, Italy) and from the National Science F oundation under gran t n umber 0312150 w as receiv ed. The use of computer re- sources provided b y the Op en Science Grid supp orted by the NSF and b y the Office of Science of the U.S. Depart- men t of Energy is ac kno wledged. [1] T. Berners-Lee , W. Hall,J. Hendler , N. Shadb olt and D.J. W eitzner, Science 313 , 769 (2006). [2] D.J. W atts, Nature 445 , 489 (2007). [3] R. P astor-Satorras and A. V espignani, Evolution and Structur e of the Internet : A Statistic al Physics Ap- pr o ach , Cambridge Universit y Press (2004). [4] S. Dorogovtsev and J.F.F. Mendes, Evolution of Net- works: F r om Biolo gic al nets to the Internet and WWW , Oxford Univ ersity Press (2003). [5] D.J. W atts and S.H. Strogatz, Nature 393 , 409 (1998). [6] B.A. Hub erman, P .L. Pirolli, J.E. Pitko w and R.M. Luk ose, Science 280 , 95 (1998). [7] A.-L. Barab´ asi and R. Albert, Science 286 , 509 (1999). [8] F. Menczer (2004), Proc. Nat. Acad. Sci. 99 , 14014 (2004). [9] S.N. Dorogovtsev and J.F.F. Mendes, Phys. Rev. E 63 , 056125 (2001). [10] C. Cattuto, V. Loreto and V.D.P . Serv edio, Europh ys. Lett. 76 , 208 (2006). [11] M.V. Simkin and V.P . Royc ho wdhury , EuroPhys. Lett. 82 , 28006 (2007). [12] F. W u and B.A. Hub erman, Pro c. Nat. Acad. Sci. 104 , 17599 (2007). [13] E.F. Borgatta and R.J.V. Montgomery (editors), Ency- clop e dia Of So ciolo gy - V olume I , Macmillan Reference USA, 2nd edition (2000). [14] J.-P . Onnela et al. , Pro c. Nat. Acad. Sci. 104 , 7332 (2007). [15] S. Golder, D. Wilkinson and B.A. Hub erman, e-print ArXiv cs/0611137 (2006). [16] J. Candia et al. , e-print ArXiv cond-mat/0710.2939 (2007). [17] A. V´ azquez, Ph ysica A 373 , 747 (2007). [18] M.R. Meiss, F. Menczer, S. F ortunato, A. Flammini and A. V espignani A, R anking Web sites with re al user tr affic , Pro c. WSDM (2008). [19] T. Zhou, X.-P . Han, and B.-H. W ang, arXiv: 0801.1389 (2008). [20] T. Zhou, H.-A.T. Kiet, B.J. Kim, B.-H. W ang and P . Holme, EuroPh ys. Lett. 82 , 28002 (2008). [21] R. Alb ert, H. Jeong and A.-L. Barab´ asi, Nature 401 , 130 (1999). [22] S. Dill et al. , ACM T ransactions on Internet T echnology 2 , 205 (2002). [23] M.R. Meiss, F. Menczer and A. V espignani, On the lack of typic al b ehavior in the glob al Web tr affic network , Proc. WWW (2005). [24] L.D. Catledge and J.E. Pitko w, Computer Netw orks and ISDN Systems 27 , 1065 (1995). [25] C. Cattuto, V. Loreto and L. Pietronero, Pro c. Nat. Acad. Sci. 104 , 1461 (2007). [26] A. Cap occi et al. , e-print ArXiv physics/0602026 (2006). [27] A. V´ azquez et al , Phys. Rev. E 73 , 036127 (2006). [28] A.-L. Barab´ asi, Nature 435 , 207 (2005). [29] J.G. Oliv eira and A.-L. Barab´ asi, Nature 437 , 1251 (2005). [30] A. V´ azquez, Ph ys. Rev. Lett. 95 248701 (2005). [31] J.G. Oliv eira and A. V´ azquez, e-print ArXiv 0710.4916 (2007). [32] E.H. Simon, Biometrik a 42 , 425 (1955). [33] S. Bornholdt and H. Eb el, Phys. Rev. E 64 , 035104(R) (2001). [34] S. Dorogovtsev, J.F.F. Mendes and A.N. Samukhin, e-print ArXiv condmat 0009090 (2000). [35] A.-L. Barab´ asi A-L et al , Physica A 311 , 590 (2002). [36] R. P astor-Satorras, A. V´ azquez and A. V espignani, Phys. Rev. Lett. 87 , 258701 (2001). [37] S. Redner, Physics T oday 58 , 49 (2005). See e-print ArXiv ph ysics/0506056 for a more extense v ersion (2005). [38] P .L Krapivsky , S. Redner and F. Leyvraz, Phys. Rev. Lett. 85 , 4629 (2000). [39] P .L. Krapivsky and S. Redner, Ph ys. Rev. E 63 , 066123 (2001).
Original Paper
Loading high-quality paper...
Comments & Academic Discussion
Loading comments...
Leave a Comment