Decoding Beta-Decay Systematics: A Global Statistical Model for Beta^- Halflives
Statistical modeling of nuclear data provides a novel approach to nuclear systematics complementary to established theoretical and phenomenological approaches based on quantum theory. Continuing previous studies in which global statistical modeling i…
Authors: N. J. Costiris, E. Mavrommatis, K. A. Gernoth
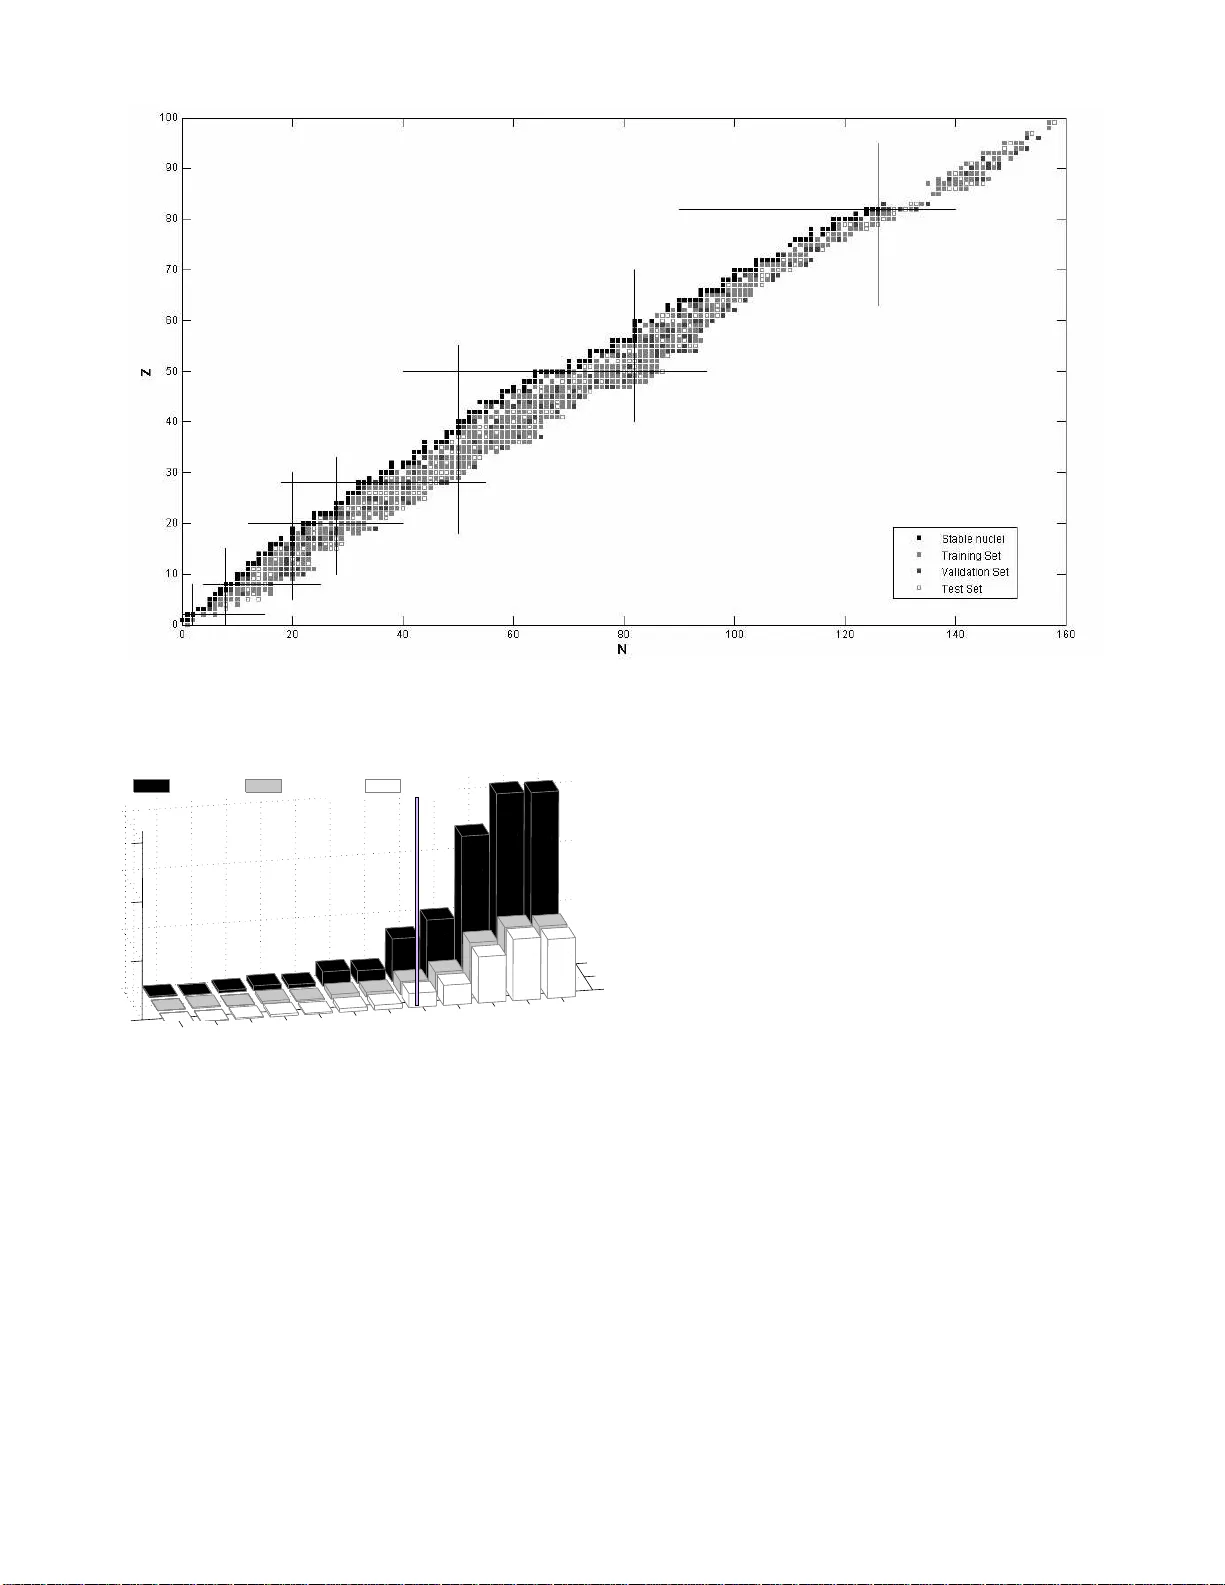
Deco ding Beta–Deca y Systematics: A Global Statistical Mo del for β − Halfliv es ∗ N. J. Costiris † and E. Ma vrommatis ‡ Physics Dep artment, Se ction of Nucle ar & Particle Physics University of Athens, GR-15771 Athens, Gr e e c e K. A. Gernoth § Institut f¨ ur The or etische Physik, Johannes-Kepler-Universit¨ a t, A-4040 Linz, A ustria and Scho ol of Physics & Astr onomy, Schuster Bui lding The University of Manchester, Manchester, M13 9PL, UK J. W. Clar k ¶ McDonnel l Center for the Sp ac e Scienc es & Dep artment of Physics Washington University, St. L oui s, MO 63130, USA, Complexo I nter disciplinar, Centr o de Mathem´ atic a e Aplic a¸ c˜ oes F undament als University of Lisb on, 1649-003 Lisb on, Portugal and Dep artamento de F ´ ısic a, Instituto Sup erior T´ ecnic o, T e chnic al University of Lisb on, 1096 Lisb on, Portugal (Dated: Ma y 2008, Submitted to Phys. Rev. C) Statistical mod eling of nuclear data provides a nove l app roac h to nuclear systematics complemen- tary to established theoretical and p henomenologica l approaches based on quantum theory . C ontin- uing previous studies in whic h global statistical mo deling is pursued within the general framew ork of mac hine learning theory , w e implemen t adv ances in training alg orithms designed to impro ved generalization, in application to the problem of repro ducing and predicting the halflives of n uclear ground states that decay 100% by the β − mod e. More sp ecifically , fully-conn ected, multila ye r feed- forw ard artificial neu ral net w ork mo dels are develo p ed using the Leven b erg-Marquardt optimization algorithm t ogether with Ba yesia n regularization and cross-v alidation. The predictive p erformance of models emerging from extensive computer ex p eriments is compared with that of traditional mi- croscopic and phenomenological models as well a s with the performance of other learning systems, including earlier neural netw ork mo dels as wel l as the supp ort vector machines recently a pplied to the same problem. In discussing the results, emph asis is placed on predictions for nuclei that are far from the stabilit y line, and esp ecially those inv olved in th e r-p rocess nucleos ynthesis. It is f ound that the new statistical mo dels can match or even surpass the predictive p erformance of conv en- tional models for beta-decay sy stematics a nd accordingly should provide a val uable additional tool for exploring the expanding nuclea r la ndscap e. P A CS num bers: 23.40.-s, 21.10.Tg, 26.30.+k, 07.05.Mh, 98.80.Ft I. INTRO DUCTION “Numb ers ar e the within of al l things.” Pythagor as of Samos This work is devoted to the development o f ar tificial neural net work mo dels which, a fter b eing trained with a subset of the av ailable exp eriment al data on b eta de- cay from nuclear gro und states, demonstr ate significa n t reliability in the prediction of β − halflives for nuclides absent from the training set. The w ork r epresents an ex- plorator y study of the degree to which the existing da ta ∗ URL: http://www. pythaim.phy s.uoa.gr † E-mail: nco st@phy s.uoa.gr, nic k.costiris@gmail.com ‡ E-mail: ema vrom@ ph ys.uoa.gr § E-mail: klaus.a.gernoth @@manche ster.ac.uk ¶ E-mail: jw c@wustl.edu determines the mapping fro m pr oton a nd neutron n um- ber s to the co rresp onding β − halflife. There is an urgent need among nuclear ph ysicists and astrophysicists for reliable e s timates o f β − -decay halflives of nuclei far from s ta bilit y [1, 2]. Among nuclear physi- cists this need is driven bo th b y the exper imen tal pro- grams of ex isting and future radioactive ion b eam facil- ities a nd b y the stress e s placed on established nuclear structure theory as tota lly new areas of the nuclear land- scap e are op ened for explora tio n. F or nuclear astr oph ysi- cists, such informa tion is intrinsic to a n under s tanding of sup e rnov a explosions – the initializa tion of the explo s ion, the subseq ue nt neutronization of the core material, and the strength and fate of the sho ck wav e formed – and the nu cleosynthesis of heavy elemen ts a bov e F e, notably the r-pro cess [3, 4, 5]. Both the element distribution on the r-path and the time sca le of the r-pro cess are highly sen- sitive to the β -decay pro perties of the neutron-rich nuclei inv o lv ed. 2 In the nuclear chart there ar e spaces f or so me 600 0 nu- clides b et ween the β -stability line and the neutron-dr ip line. Except for a few key n uclei, β de c a y of r - pro c ess nu clei ca nnot b e studied in terrestrial lab oratorie s, so the requir ed information m ust co me fro m nuclear mo d- els. Over the years, a n um b er o f appro a c hes for mo d- eling o f β − -decay ha lfliv es have b een prop osed and ap- plied. These include the more phenomenolog ical trea t- men ts, such as the Gr oss Theor y (GT), as w ell as mi- croscopic appro ac hes base d on the shell mo del and the proton-neutro n Quasiparticle Random-Phase Approxi- mation ( pn QRP A) in v ario us versions. More r ecen tly , hybrid macroscopic-micr oscopic and r elativistic mo dels hav e come on the s cene. Some o f these a pproaches em- phasize only g lobal applica bility , while others seek self- consistency or compr ehensiv e inclusio n of nuclear c orre- lations. T able 1 o f Ref. 6 provides a co n venien t summary of a num b er o f the co mpeting mo dels of beta -decay sys- tematics. In Gross Theo r y , developed by T ak ahashi, Y amada a nd Kondoh [7], gro ss prop erties of β − decay ov er a wide nu clidic regio n are pre dicted by av er aging ov er the fi- nal states of the daught er nucleus. Subsequent ly , v ari- ous r efinemen ts and mo difications of this tr eatmen t hav e bee n intro duced. The most c urrent of these is the so- called Semi-Gro s s Theory (SGT), in which the shell ef- fects of only the parent nucleus ar e taken into account [8]. On the other hand, in the c a lculations o f β − -decay halflives within the s he ll mo del, the detailed structure of β strength function is considered. Results exist fo r lighter n uclei a nd nuclei at N = 50 , 82, a nd 126. (See Refs. 9, 10 for recent calcula tions.) Due to the limits set by the size of the configuratio n space, calculations are not p ossible for heavy n uclei. Several groups hav e carried out extensive pn QRP A studies including pairing . Efforts a long this line by Klap dor and co -w orkers [1 1] b egan in the framework of the Nilss on single-particle mo del, including the Gamow- T eller residual interaction in T amm-Dancoff appr o xi- mation (TDA), with pairing tr e ated at the BC S lev el [12]. This approach has been complemen ted and re- fined by Staudt et al. [13] and Hirsch et al. [14], us- ing pn QRP A with the Gamow-T eller r esidual in terac- tion. The later study by Homma et al. [15], denoted NBCS + pn QRP A, includes a schematic interaction also for the fir st-forbidden ( ff ) decay . The Klap dor group has extended the pn QRP A theory to calculate β -decay halflives in stellar environments using configur a tions b e- yond 1 p − 1 h [16]. The starting point of the β - deca y calculations of M¨ oller and co-workers is the study o f nuclear-gro und- state mass es and deformations ba sed on the finite- range dro plet mo del (FRDM) and a folded-Y uk aw a single-par ticle p otent ial [17]. The β -decay halfliv es for the allow ed Gamo w-T eller transitions hav e b een obtained from a pn QRP A calcula tion a fter the addi- tion of pair ing a nd Gamow-T eller r esidual int eractio ns, in a pro cedure denoted FRDM + pn QRP A [18, 19]. In the latest ca lculations the effect of the ff decay has been added by using the Gross Theory ( pn QRP A + ff GT) [20]. Non-relativistic pn QRP A calcula tio ns that a im a t self-consis tency include the Hartree- F o c k- Bogoliub ov + co n tin uum QRP A (HFB + QRP A) cal- culations p erformed with a Skyrme energy- de ns it y func- tional for s ome s pherical even-even semi-magic nuclides with N = 50 , 82 , 12 6 [21]. The extended Thomas-F ermi plus Strutinski in tegral metho d (E TFSI) (an approxima- tion to HF metho d based o n a Skyr me-t yp e force plus a δ − function pa iring force) has b een elab orated and ap- plied to la rge-scale predictions of β − halflives [22]. Re - cently , the density functional + contin uum QRP A (DF + CQRP A) appr o ximation, with the spin-is ospin effective NN in teraction of the finite F ermi system theory o pera t- ing in the ph c hannel, has been developed for ground- state pr oper ties and Gamo w-T elle r and ff transitions of nuclei far from the stabilit y line, and applied near closed neutron shells at N = 50 , 82 , 126 a nd in the r egion “east” of 208 Pb [6 , 23]. In the rela tivistic framework, a pn QRP A calculation ( pn R QPRA) based o n a rela- tivistic Hartree -Bogoliub ov desc ription of nuclear ground states with the density-dep enden t effective in teraction DD-MEI* has b een employ ed to obtain Gamow-T eller β − -decay halflives of neutron-r ic h nuclei in the N ≃ 5 0 and N ≃ 82 regio ns r elev ant to the r- proce ss [2 4]. Re- cently , an extension of the ab ov e framework to include momentum -dep enden t nucleon self-energ ie s was applied in the calculation of β -decay halflives of neutron-rich nu- clei in the Z ≃ 28 and Z ≃ 5 0 regions [25]. Despite contin uing metho dological improv ements, the predictive p ow er of these con ven tiona l, “theory- thic k” mo dels is ra ther limited for β − -decay halflives of nuclei that a re ma inly far from stabilit y . The predictions of- ten deviate from exp eriment b y one or more orders of magnitude and show consider able s ensitivit y to quanti- ties that are p o orly known. In this environment, sta- tistical mo deling based on adv anced techniques of sta- tistical learning theory or “machine-learning,” notably artificial neural net works (ANNs) [26, 27] and suppo rt vector machines (SVMs) [27, 28, 29], o ffers an interesting and p oten tially effective alterna tiv e for global mo deling of β − -decay lifetimes. Such a pproaches hav e prov en their v alue for a v ar iet y o f s cien tific problems in astronomy , high-energy ph ysics, and bio chemistry that inv olve func- tion a pproximation and pattern classification [30, 31]. Statistical mo deling implemen ting machine-learning al- gorithms is “theor y -thin,” since it is driven b y data with minimal guidance from mechanistic co ncepts; th us it is very different from the “theor y-thic k” appr oaches sum- marized abov e. An y n uclear obser v able X can be view ed as a mapping from the atomic and neutr o n num b ers Z and N identif ying an arbitrary n uclide, to the corre- sp onding v alue of the observ able (the β halflife, in the present study). In machine lear ning , one attempts to approximate the ma pping ( Z , N ) → X based only on an av ailable subset of the data for X, i.e., a b ody of tr aining data co ns isting of known examples of the map- 3 ping. One attempts to infer the mapping, in the s ense of Bay esian probability theory as exp ounded by J aynes [32]. Thu s, one is asking the question: “T o wha t exten t do es the data, and only the data, determine the mapping ( Z, N ) → X ?” The answer (or ans wers) to this ques- tion should surely b e of fundament al int erest, when con- fronted with databases as large, complex, and r efined as those existing in n uclear physics. A lea rning machine consists of (i) a n input in terface where, for example, input v aria bles Z and N are fed to the device in co ded fo rm, (ii) a system of int ermediate el- ement s or units that pro cess the input, and (iii) an output int erface where an estimate of the co rresp onding observ- able o f interest, say the beta halflife T β app ears for decod- ing. Given an adequate b ody of tra ining data (co nsisting of input “patterns” o r vectors and their appropr ia te o ut- puts), a suitable lea rning algorithm is used to adjust the parameters of the machine, e.g ., the weigh ts of the con- nections b et ween the proce ssing elements in the ca se of a neural netw o rk. These parameters are adjusted in such a wa y that the lear ning mac hine (a) genera tes respons e s at the output int erface that closely fit the halflives of the training exa mples a nd (b) serves a s a reliable predictor of the halfliv es of the test nuclei absent from the training set. In the more mundane language of function approx- imation, the learning-machine mo del pro vides a means for interp olation or extr ap olation . Neural-netw ork models hav e a lr eady b een constructed for a ra nge of nuclear prop erties including atomic masses , neutron separ ation energies, gro und state spins a nd pari- ties, and branching probabilities for different decay chan- nels, as well as β − -decay ha lfliv es [30 , 31, 33, 34, 35, 36]. V ery rece n tly , glo bal statistical mo dels of some of these prop erties ha ve also b een dev elop ed based o n s upp ort vector machines [37, 38, 39]. In time, there has bee n steady improvemen t of the quality of these mode ls , such that the do cumented perfo r mance of the b est exam- ples approa c hes or ev en surpasses that of the traditional “theory-thick” mo dels in predictive re liabilit y . B y their nature, they sho uld not b e exp ected to comp ete with tra - ditional phenomenological or microscopic models in gen- erating new physical insights. Ho wev er, their pro spects for revealing new reg ula rities are by no means s terile, since the explicit form ula created by the learning alg o - rithm for the physical observ able being mo deled is av a il- able for ana lysis. W e prese nt here a new glo ba l mo del for the halflives of nuclear gr ound states that deca y 100% b y the β − mo de, developed by implementing the most recent ad- v ances in machine-learning algor ithms. Sec. I I describ es the elements of the model, the training algor ithm em- ploy ed, steps taken to improve ge neralization, the data sets ado pted, and the co ding schemes used a t input and output in terfaces. Performance measures for assessing the quality o f global mo dels of b eta lifetimes ar e reviewed in Sec. I I I. The r esults of our large- scale mode ling studies are r epor ted and ev aluated in Sect. IV. Detailed c ompar- isons ar e made with exp eriment, with a selection of the FIG. 1: Architecture of a typical fully co nnected feedf orwa rd netw ork having an inpu t la yer with three units, tw o hidden la yers each containing five u nits, and a single output un it, thus of structure [3 − 5 − 5 − 1 | 56 ]. theory-driven GT and pn QRP A global mo dels, and with previous ANN a nd SVM mo dels. This asse ssmen t is fol- low ed b y the pr esen tation of sp ecific pr edictions for nuclei that ar e situated fa r from the line of stability , fo cusing in pa rticular at those inv olved in r -pro cess nucleosynthe- sis. Finally , Sec t. V summarizes the conclusio ns o f the present study and considers the pr o spects fo r fur ther im- prov ement s in statistical pr ediction of halflives. II. THE MODEL A. Netw ork Architecture and Dynamics Artificia l neur al n etworks , whose str ucture is inspired by the anato m y of natura l neural systems, co nsist of in- terconnected dynamical units (sometimes called neurons) that ar e typically ar ranged in a distinct lay ered topo logy . Also in ana logy with biological neural sys tems, the func- tion of the network, for exa mple pa tter n re cognition, is determined by the co nnections betw een the units. In the work to b e r epor ted, we hav e fo cused exclusively on feedforward netw orks, in which information flows unidi- rectionally from an input lay er throug h one or more inter- mediate (hidden) lay e rs to an o utput layer. Latera l and feedback co nnections ar e absent, but o therwise the net- work is fully co nnec ted. The a ctiv ation of hidden units is nonlinear , whereas the output units tr ansform their inputs linear ly . The a rc hitecture of suc h a netw o rk is indicated by the notation [ I − H 1 − H 2 − · · · − H L − O | W ] , (1) where I is the num b er of inputs, H i is the n umber of neu- rons in the i th hidden layer, O is the num b er o f units in the output lay er, and W is the total n umber of pa rame- ters needed to complete the spec ification o f the netw ork, consisting of the weigh ts of the connections and the bi- ases of the units. Fig. 1 depicts a t ypical fully c o nnected net work o f the class used in our statistical mo deling, in this case having architecture [3 − 5 − 5 − 1 | 5 6 ]. 4 The connection from neuron j to neuro n i carries a real-num be r weigh t w ij . Thus, if o j is the ac tiv ity of neuron j , it pr o vides an input w ij o j to neuron i . In addition, each neuron i is as signed a bias parameter b i , which is summed tog ether with its input signa ls from other neurons j to form its total inpu t u i . This quan tit y is fed into the activ a tion function ϕ i characterizing the resp onse o f neuro n i . F or the neurons in hidden lay ers, this function is tak en to hav e the nonlinear hyp erb olic tangent for m ϕ ( u ) = 2 1 + e x p ( − 2 u ) − 1 , (2) while for the neurons in the output lay er the symmetric satur ating line ar form ϕ ( u ) = − 1 , u, 1 , u < − 1 − 1 ≤ u ≤ 1 , u > 1 (3) is adopted. The output (or activity ) o i of neuron i is given by o i = ϕ b i + X j w ij o j . (4) W e note that with its sign reversed, a neuron’s bias can be viewed as a thres hold for its activ a tio n. Also, it is sometimes conv enien t to regard the bias b i as the weight of a connectio n to neuro n i fro m a virtual unit v that is alwa ys fully “o n”, i.e ., o v ≡ 1. The w eights w ij and biases b i are adjustable scala r parameters of the untrained net- work, av ailable for optimization of the netw ork’s per for- mance in some task, notably class ifica tion and function approximation in the c ase of applica tions to g lobal nu- clear mo deling. This is usually do ne b y minimizing some measure of the erro rs made by the netw ork in res ponse to inputs corresp onding to a se t of training examples, or “training patterns.” The dynamics of the net work is exceptiona lly simple. When a pattern p is presented a t the input, the system computes a r espo nse according to t wo rules: (a) The states of all neurons within a given lay er, a s sp ecified by the outputs o i of E q. (4), are updated in parallel, and (b) The la yers are upda ted succes s iv ely , pro ceeding from the input to the o utput la yer. In mo deling the sy s tematics of beta lifetimes with this approach, w e apply a sup ervised learning a lgorithm to optimize the weigh ts a nd biases, as describe d in the sub- sections to follow. T he patterns p to b e learne d or pr e- dicted, examples of the mapping from n uclide to lifetime, take the form Z p N p , log 10 T p β , exp , (5) and thus cons is t of an asso ciation b etw een the atomic a nd neutron n umbers of the parent n uclide, with the bas e-10 log of the experimental halflife T p β , exp . It is o f co urse nat- ural to work with t he loga rithm o f T β , since the observed v alues o f T β itself v a ry o ver man y orders of ma gnitude. According to the nature of statistical estimation, real- ized here in the application of mac hine learning tech- niques to function approximation, a neur al netw ork mo del is o nly one form in which empirica l knowledge o f a physical phenomenon of in terest ( β decay in this case) may be enco ded [27]. As indicated in the in tro duction, the pr esen t work is at some level an in vestigation of the degree to whic h the av aila ble data determines the physi- cal mapping from Z and N to the co rresp onding β -decay halflife. Actua lly , we do not hav e knowledge of the exact functional rela tionship in v olved. Thus w e should write log 10 T β ( Z, N ) = g ( Z, N ) + ε ( Z, N ) , (6) where g ( Z, N ) is a function that deco des the decay s ys- tematics and ε is a random exp ectation error – a Ga us- sian noise term that repres e n ts our ignorance ab out the depe ndence o f T β on Z and N . F ro m a heuristic p e r- sp ectiv e b eyond strict mathematical definitions, this ε noise term could reflect “chaotic” influences o n the phe- nomenon, along with mis s ing regula rities that could b e more easily mo deled and ev entu ally included in the esti- mate of the ph ysical qua n tit y T β . The pra g matic ob jective of the training pro cess in th is application will b e to min imize the s um of sq ua red erro r s e p committed by the net work mo del rela tiv e to exper i- men t, for the n patterns p fro m the av a ilable e x perimen- tal data (D) that constitute the training set E D = n X p =1 ( e p ) 2 = n X p =1 log 10 T p β , exp − log 10 T p β , calc 2 . (7 ) Here log 10 T p β , calc is the neural-netw ork o utput for pat- tern (nuclide) p , whereas log 10 T p β , exp is the targ e t output. This q ua n tit y is often referred to as a c ost function or ob- je ctive function and can obviously be used as a measure of net work p erformance. In practice, its form will be modi- fied in Subsec. C.2 b elow so as to improv e the netw o rk’s ability to generalize, o r pr edict. A net w ork model is said to generalize well if it perfor ms well for inputs (n uclides) outside the training set, with the mean-squar e error for these “fresh” nuclei pro viding an appropria te measure of predictive perfor mance. B. The T raining Algorithm In supervis ed lear ning, the netw ork is e x posed, in suc- cession, to the input patterns (nuclides) of the training set, a nd the error s ma de by the netw ork ar e re c o rded. One pass thr ough the training set is called an ep o ch . In b atch training, weights and biases are incremented after each ep o c h acco rding to a suitable lear ning a lg orithm, with the expecta tion of impr o ving subseq uent p erfor- mance on the tr aining set. 5 Statistical mo deling inevitably inv olves a tradeo ff b e- t ween clos ely fitting the training da ta a nd reliability in int erp olation and e x trapo lation [27, 28]. In the present application, it is not the go a l of net work training to achiev e an exact repro duction, b y the model, of the known halflives. This would neces s arily en ta il fit ting the data precis ely with a large num ber of parameters – which would in general require a complex A NN with ma n y la y- ers and/o r neurons/layer. Obviously , there is no p oint in constructing a lo okup table of the known b eta halflives. Rather, the goal is to achiev e a n accurate repre s en tation of the regularities inher en t in the t raining data by means of a netw ork that is no more complicated than it need be, thereby promoting go o d generaliza tio n. W e employ a tra ining alg orithm within the ge neral class of backpropaga tion learning pro cedures. There are now quite a num b er of well-tested pro cedures in this class, including steep est-descent, conjuga te- gradient, Newton, and Leven b erg-Marqua rdt tra ining al- gorithms [26]. All of these appro ac hes aim to minimize an appr opriate cost fun ction with r espect to the net w ork weigh ts and biase s. The term backpropag a tion refers to the pro cess b y which der iv atives of netw ork err ors with resp ect to w eights/biases ca n b e computed starting from the output la yer and pro ceeding backwards tow ard the input. In gener al, the Leven ber g-Marquardt backprop- agation (LMBP) a lgorithm will have the fastes t conv er- gence in function a pproximation problems, an adv an tage that is esp ecially noticeable if very accur ate training is required [40]. In the Newto n metho d, minimization of the cost func- tion is ac complished through the up date r ule w k +1 = w k − H − 1 k g k , (8) where w k is the vector formed from the weigh ts and bi- ases, H k is the Hessian matrix (the ma trix of seco nd deriv atives of the ob jective function E D with resp ect to the w eights and biases) and g k is the gradient of E D at the curr en t ep och k . As a Newton-based pr oce- dure attempting to appro ximate the Hessian matrix, the Leven berg -Marquardt algor ithm [26, 41] w as desig ne d to approach second-or der training sp eed w itho ut having to compute second deriv atives. When the cost function ha s the form o f Eq. (7), the Hessia n matrix for nonlinear net- works can be approximated as H ≈ J T J , (9) where J is the Jac o bian matrix c o mposed o f the fir st deriv atives o f the netw o rk error s with respec t to the weigh ts/biases. This genera tes a W × W matr ix, where W is the n umber of the free pa rameters (w eights and bi- ases) of the netw o r k. The g r adien t g can b e computed as g = J T e , (10) where e is the v ector whose components ar e the netw o rk error s e p . (As in Eq . (7), the netw o rk erro r for a g iv en in- put pa tter n is the target v alue of the estima ted quantit y , min us the v alue pro duced by the netw o rk.) Adopting the Gauss-Newton approximation (9 ), the Leven berg -Marquardt algorithm then adjusts the weights according to the Newton-like updating rule w k +1 = w k − J T k J k + µ k I − 1 J T k e k , (11) where I is the unit matrix. The factor µ k app earing in the Eq. (11) is an ad- justable parameter that controls the s tep size so as to quench o scillations of the cost function near its mini- m um. When µ k is very small, LMBP coincides with the Newton metho d executed with the approximate Hessian matrix. When µ k is large enoug h, matrix g in Eq. (10 ) is nearly diago nal a nd the a lgorithm behaves like a s teepest- descent method with a small s tep size. Steep est-descent algorithms are based on linear approximation of the co st function, while the Newton algorithm in volv es qua dratic approximation. Newto n’s metho d is faster and more ac- curate near a n er ror minim um. Therefore the preferred strategy is to shift tow ard Newton’s metho d as quickly as po ssible. T o this end, µ k is decreased after each success- ful step and is increased only when a ten tative step would raise the cost function. In this wa y , the cost function will alwa ys b e reduced at each iteration of the algor ithm. The algorithm b egins with µ k set to some small v alue (e.g., µ k = 0 . 01 ). If a step do es not y ield a smaller v alue for the cost function, the step is repeated with µ k m ultiplied by some fa c tor θ > 1 (e.g ., θ = 10 ). Even tually the cost function should decr ease. If a step does pr oduce a smaller v alue for the cost function, then µ k is divided by θ for the next step, so that the alg orithm will a pproach Gauss- Newton, whic h should pr ovide faster co n vergence. Thus, the Leven b e r g-Marquar dt alg orithm is adv antageous in implemen ting a fav orable compromis e b etw e e n s lo w but guaranteed conv er gence far from the minimum and a fast conv ergence in the neighbor hoo d of the minimum. The key step in LMBP alg orithm is the computation of the Jacobia n ma trix. T o p erform this computation we use a v ariation o f the classical backpropagation algo- rithm. In the standa rd backpropagation pro cedure, one computes the der iv atives of the squared er rors with re- sp ect to the weight s and bias e s of the net work. T o create the Jaco bian matrix w e need to c o mpute the deriv atives of the e r rors, instead o f the deriv atives of their squar es, a trivial difference computationally . C. Impro ving Generalization T o build a viable statistical mo del, it is imp erative to av oid the phenomenon o f overfitting , which for ex- ample o ccurs when, under exc e ssiv e training, the net- work simply “memorizes” the t raining data and mak es a lo okup table. Such a netw ork fa ils to learn the r egulari- ties of the tar g et mapping that are inherent in the data; the netw ork is ther efore deficient in genera lization. W e 6 seek to av oid ov erfitting through a combination of well- established techniques, namely cr oss-validation [27] and Bayesian r e gularization [42]. 1. Cr oss-V alidation Cross-v alidation is a sta nda rd statistical technique based on div iding the data into three s ubsets [27]. The first subset is the le arning or tr aining set e mplo yed in building the mo del (i.e., in computing the J acobians and upda ting the netw ork weigh ts and biase s ). The second subset is the validation set , used to ev a luate the p erfor- mance of the mo del outside the training set and g uide the choice of mo del. The e r ror on the v a lida tion set is mon- itored during the training pro cess. When the netw o rk beg ins to overfit the data , the error on the v alidation set will t ypically b egin to r ise. If this contin ues to o c- cur for a specified n um b er of iteratio ns, the tr aining is stopp ed, and the weights and bias e s at the minimum of the v alidation er ror are reinstated. The third subset is the test set . The erro r on the test set is not used dur- ing the training pro cedure, but it is used to assess the generaliza tion p erforma nce of the model and to compare different mo dels. While effective in suppressing overfit- ting, cros s-v alidation tends to pro duce netw orks whose resp onse is not sufficiently smo oth. This is dealt with by per forming Bayesian regular ization together with cr oss- v alidation. 2. Bayesian r e gularization The standard Leven ber g-Marquar dt algorithm aims to reduce the sum of squa red er rors E D , written ex- plicitly in Eq. (7) for the β -decay problem. How- ever, in the framework o f Bay es ian re g ularization [4 2], the Leven be rg-Marquar dt optimization (backpropaga- tion) a lgorithm (denoted LMOBP) minimizes a linear combination of squar ed erro rs and squa r ed net work pa- rameters, F = ˜ β E D + ˜ αE W , (12) where E W is the sum o f squares of the netw ork w eights (including biases). The m ultipliers ˜ α and ˜ β are h yper pa- rameters defined by ˜ α k = γ k 2 E W and ˜ β k = n − γ k 2 E D , (13) where γ k = W − 2 ˜ α · tr ( H k ) − 1 (14) is the num b er of par ameters (weights and biases) that are being effectively used b y the netw ork, n is the n umber o f error s, W is the total num b er of par ameters character- izing the netw ork mo del (See Eq. (1 )) a nd H = ∇ 2 F is the Hessian ma trix ev aluated for the extended (“regu- larized”) ob jective function (12 ). The full Hessia n com- putation is again bypassed using the Gauss- Newton ap- proximation, writing H k = ˜ β k ∇ 2 E D + ˜ α k ∇ 2 E W ≈ 2 ˜ β k J T k J k + 2 ˜ α k I . (15) Thu s, the Levenberg-Mar quardt optimization a lgorithm upda tes the weigh ts/biases by means of the rule w k +1 = w k − h ˜ β k J T k J k + ( µ k + ˜ α k ) I i − 1 ˜ β k J T k e k + ˜ α k w k . (16) A detailed discussion of the use o f Bay esian regula rization in co mbination with the Leven b erg- Marquardt alg orithm can b e found in Ref. 43. D. T raining M ode Backpropagation learning, as a technique for itera tiv e upda ting o f netw o rk parameter s , can b e ex ecuted in ei- ther the b atch or p attern- by-p attern (or “on-line”) mode. In the on-line mo de, a pa ttern is pr esen ted to the net- work a nd its resp onse reco rded; the Jacobia n matr ix is then computed and the weights/biases up dated b efor e the nex t pa ttern is presen ted. In the batch mo de, on the other ha nd, calculation o f the Jacobian and parameter upda ting is per formed only after all tr aining examples hav e been presented, i.e., at the end of each epo ch. The mo del results rep orted here ar e ba sed on the batch mo de, the choice b eing ma de on the e mpir ical basis of findings from a substantial n umber of computer exp eriments c a r- ried out with bo th strategies. E. Data Sets The exp erimental data use d in developing ANN mo d- els of β -decay sys tematics have bee n taken from the Nubase2003 ev aluation [44] o f nuclear a nd deca y prop er- ties car ried out by Audi et al. at the Atomic Mass Data Cent er. Restricting atten tion to those cases in whic h the ground state of the parent decays 100% thro ugh the β − channel, we for m a subset o f the b eta-decay data denoted by NuSet-A, consisting of 90 5 nuclides sorted by halflife. The halflives of nuclides in this set r ange fro m 0 . 15 × 10 − 2 s for 35 Na to 2 . 43 × 10 23 s for 113 Cd. O f these NuSet-A nu clides, 543 (60%) ha ve b een chosen, a t r andom with a uniform pr obabilit y , to form the training se t, and 181 (20%) o f those rema ining hav e b een similarly chosen to form the v alidation set. The re s idual 181 (20%) are re- served for testing the predictive capabilit y of the mo dels constructed. Suc h par titioning of the NuSet-A database (uniform se le c tion) was implemented to ensure that the distribution ov er halflives in the whole s et is faithfully reflected in the learning, v alidation, and test sets. Fig. 2 shows an ex ample o f the results of this pro cedure, as viewed in the Z − N diagram. 7 FIG. 2: The p artitioning of the whole set of h alfliv es in the learning, v alidation, and test sets as a function of the atomi c ( Z ) and the n eutron ( N ) num b ers. Stable nucli des are a lso indicated. ms sec min hours days months years Ky My Gy Ty Py 0 50 100 150 Learning Set Validation Set Test Set NuSet−A NuSet−B FIG. 3: D istribution of halflives ov er the timescale for NuSet- A nuclides. NuS et-B nuclides lie to the right of th e vertical gra y rectangle. W e also for med a mor e restricted data set, called NuSet-B, b y eliminating from NuSet-A those n uclei hav- ing ha lflife greater tha n 10 6 s . The ha lflives in this subset, which consists of 83 8 nuclides, r ange fro m 0 . 15 × 1 0 − 2 s for 35 Na to 0 . 20 × 10 6 s fo r 247 Pu. Histog rams depict- ing the lifetime distribution of the NuSet-B nuclides are shown in Fig. 3, having made a unifor m sub division o f the data into lear ning , v alidation, and test sets, co ns isting re- sp ectiv ely of 5 03 ( ∼ 60 %), 167 ( ∼ 20 %), and 1 68 ( ∼ 20%) examples. Ha ving excluded the few long-lived exa mples from NuSet-A (situated to the r igh t of the vertical line in Fig. 3), one is then dealing with a more homogeneous collection o f n uclides, a prop erty that facilitates the train- ing of net w ork mo dels. Acco rdingly , we hav e fo cused our efforts on NuSet-B. T able VI II gives information on the distribution of NuSet-B nuclides with resp ect to the even versus odd character of Z and N . When considering the per formance o f a netw ork mo del for exa mples taken from the whole data set (whether NuSet-A or NuSet-B), we spea k o f oper ation in the Over- al l Mo de . Similar ly , we sp eak of o pera tion in the L e arn- ing , V alidation , a nd Pr e diction Mo des when s tudying per formance on the lea rning, v alidation, and test sets, resp ectively . F. Codi ng Schemes at Input and Output In terfaces. In our initial exp erimen ts in the design of ANN mo dels for β -de c ay halflife predictio n, w e employ ed input co ding schemes that in volv e only the proton num b er Z and the neutron num b er N . T o keep the num b er of weigh ts to a minimum, we make use of analo g (i.e., flo ating-p oint ) co ding of Z and N throug h tw o dedicated inputs, whose activities r epresent scaled v a lues o f these v ar iables. The LMOBP algo rithm w orks better when the net work in- puts and targets are sca led to the int erv al [ − 1 , 1] than (say) the interv al [0 , 1] [26]. Mo reov er, the rang e of the hyperb olic tang en t activ ation function employ ed by the 8 hidden units lies in the in terv a l − 1 ≤ ϕ ( u ) ≤ 1. The ranges [0,2 30] and [0 ,2 30] of Z a nd N ar e therefore s caled to this interv al. The base -10 log of the β − halflife T β , calc , as calc ula ted b y the netw o rk for input nuclide ( Z p , N p ), is represented by the activity of a single a na log o utput unit. F or the same reason a s indicated for the input units, the range [0.17609, 8.9771] of the target v alues log 10 T p β , exp is scaled aga in to the interv al [-1,1]. Also in the primary stag es o f our study of b eta-halflife systematics, we hav e assumed that the halflife of a given nu cleus is prop erly giv en by an expression of the form of Eq. (6 ). Suc h an express ion echos the essence of W eiz- sack er’s semi-empirical ma s s formula based on the liquid- drop model, with the binding energ y g iven by a function B ( Z, N ) r epresenting a statistical estimate o f the physi- cal quantit y , plus an additive noise term. T ak ing Z and N as the only inputs to the inference machine formed by the neural net work has, of course, the lo gistical adv a n tage that ther e is no limitation to the range o f prediction o f nuclear prop erties across the n u- clear landsc a pe. If, o n the o ther hand, suc h quantities as Q -v a lue s and neutro n separa tion energ ies were included as inputs, one w ould hav e to calcula te these quantities for choices o f ( Z , N ) at which exp erimental v alues ar e not av a ilable. But this implies a departure from the “idea l” of determining the physical mapping from ( Z , N ) to the target nuclear property , base d only on the existing b o dy of exp erimental data for that pro perty . The pr edictions of th e net w ork model w ould necessarily b e co n tingent on some theoretical mo del to provide the a dditional v alues of the input quantities. How ever, estimating a given nuclear pro perty – the log lifetime of b eta decay in the pr esen t case – a s a smo oth function of Z a nd N has clea r limitations. The nuclear data itself se nds strong messages of the impo r tance of pairing and she ll effects (“quantal effects” ) ass ociated with the integral natur e of Z and N . The problem of atomic mas ses provides the c la ssic example: the liquid drop form ula must b e supplemen ted b y pairing and shell correctio ns to account for the existence of different mass surfaces for even-even, o dd- A , a nd o dd-o dd nuclei and other effects of the integral/par ticulate c haracter o f Z and N . Examination of results fr om the simple co ding sc heme with Z a nd N alone serving a s a nalog inputs is nev er- theless instructive. W e hav e applied the LMBP train- ing algorithm to dev elop a net work mo del with architec- ture [2 − 5 − 5 − 5 − 5 − 1 | 111 ]. As shown in Fig. 4 , the mo del yields a smo oth curve that r epresent s a gro ss fit of the exp erimen tal data inv olved. The predictive a bil- it y of the mo del naturally relies on extrap olation based on this curve. These results demonstrate the need for a more r efined mo del within which qua ntal effects s uc h as pa iring and she ll structure a re given an opp ortunity to exert themselves, so that the natural fluctuations are follow ed in v a lida tion a nd pr e diction mo des, as well as in the learning (or “fitting”) phase . A s traightf orward mo dification of the input interface of the netw ork mo del that can at least partially fulfill this need is suggested by the extension of t he liquid- drop mo del to include a pair ing-energy ter m. In addition to the t wo input units representing Z and N as floating- po in t num b ers, w e introduce a third input unit repr e- senting a discrete pa rameter ana logous to the pairing constant, namely δ = +1 , 0 , − 1 , for e − e nuclei , for o − mass nuclei , for o − o nuclei , (17) which distinguishes betw een ev en- Z -even- N , o dd- A , and o dd- Z -o dd- N nuclides. This simple refinement has the conceptual a dv antage of remaining in the spirit o f “theory-thin” mo deling, driven purely b y data r ather than data plus ph ysical intuition and a ccepted theory . All that is r equired is the knowledge that Z and N are actually in tegers and recognitio n of their even or o dd par- it y . The expr ession replacing Eq. (6) as a representation of the inference pro cess p erformed b y the ANN mo del is evidently log 10 T β ( Z, N ) = ˜ g ( Z, N , δ ) + ˜ ε ( Z , N ) . (18) W e shall see that so me shell effects that might impact the b ehavior of halflives for b oth allow ed and/o r forbid- den tra nsitions can, a t least to some extent, b e taken int o acco un t by the δ input defined in Eq. (17). It sho uld be mentioned that in the ANN global mo dels of nuclear mass exce s s [35], it has prov en adv antageous to int ro duce t wo binary input units that enco de the even/o dd parity of Z and N . G. Initialization of Netw ork Parameters Prop er initialization of the free para meters of the ANN – its weights a nd biases – is a very imp ortant a nd highly nontrivial task . One needs to choo se a n initial p oint on the error surface defined by Eqs. (7), (12) as close as po ssible to its global minim um with resp ect to these pa- rameters, a nd such that the output o f each neuronal unit lies within the sensitive r egion of its activ ation function φ . W e ado pt a metho d dev ised by Nguyen a nd Widrow [46], in whic h the initial weigh ts ar e selected so as to distribute the active regio n of each neuron (its “receptive field” neu- robiolog ical parla nce) approximately evenly ac r oss the in- put space of the la yer to which that neuron b elongs. The Nguyen-Widro w method has clear adv a n tages o ver mor e naive initializa tio ns in that a ll neurons b egin op erating with acce s s to go o d dynamical range, and all regio ns of the input space receive coverage from neurons . Conse- quently , training of the netw o rk is accelerated. II I. PERF ORMANCE MEASURES The perfor mance o f the mo dels w e ha v e been develop- ing is assessed in terms of several commonly used sta- 9 60 65 70 75 80 85 10 0 10 2 10 4 10 6 10 8 10 10 T β (ms) MASS NUMBER 28 Ni FIG. 4: Plot showing calculated and exp erimental β − -decay halflives for the 28 Ni isotopic chain. Solid dots: exp erimen- tal data p oin ts. Un filled dots: new and more precise ex- p erimen tal halflives recently dedu ced by H osmer et al. [45]. Pluses: results generated by the [2 − 5 − 5 − 5 − 5 − 1 | 111 ] ANN model with inpu t s ( Z, N ). Solid lines trace the calcu- lated v alues of th e Overall Mo de (learning, v alidation, and test sets), while dotted lines trace extrap olated values pro- duced b y the mo del. tistical meas ures, namely , the R o ot Me an Squar e Err or ( σ RMSE ), the Me an A bsolute Err or ( σ MAE ), and the Nor- malize d Me an Squar e E rr or ( σ NMSE ). F or a n y g iven data set, these quantities provide ov erall meas ures of the de- viation of the calc ulated v alues y i ≡ log 10 T β , calc of the log-halflife pro duced by the model for nu clide i , from the corresp onding exp eriment al v alue ˆ y i ≡ log 10 T β , exp . T o understand the net work’s r espons e in more detail, a Line ar R e gr ession Analysis (LR) is als o carried out in which the corr e lation b et ween exp erimental and calcu- lated halflife v alues is ev a luated in terms of the correla - tion co efficient (R-v alue). Definitions of these quantities follow, with n standing for the total num ber of nuclides in each case (the full data se t or one of its subsets – the learning, v alidation, or test s e t). R o ot Me an Squ ar e Err or σ RMSE = " 1 n n X p =1 ( y p − ˆ y p ) 2 # 1 / 2 . (19) Normalize d Me an Squar e Err or σ NMSE = P n p =1 ( y p − ˆ y p ) 2 P n p =1 ( y p − ¯ y p ) 2 . (20) Me an Absolute Err or σ MAE = 1 n n X p =1 | y p − ˆ y p | . (21) Those mo dels having smaller v alues of σ RMSE and σ MAE , and σ NMSE closer to unity , ar e fa vored. Line ar R e gr ession (LR) y p = a ˆ y p + b. (22) In linear r e gression, the slo pe a a nd the intercept b a re calculated, as well as the co rrelation co efficien t R = P n p=1 Y p ˆ Y p P n p=1 (Y p − h Y p i ) 2 P n p=1 h ˆ Y p − D ˆ Y p E 2 1/2 , (23) where Y p = y p − h y i and ˆ Y p = ˆ y p − h ˆ y i . V alues of R greater than 0 . 8 indicate stro ng correlations. The a bov e indices necessarily provide only gross as- sessments of the quality of our mo dels. In the literature on global modeling o f β − halflives, sev eral additional in- dices, p erhaps more appropriate to the ph ysical context, hav e be en used to a nalyze p erformance. The collab ora- tion led b y Kla p dor [11, 12, 13, 1 4, 15, 1 6] has employed the quality measure ¯ x K = 1 n n X p =1 x p , (24) wherein x p = T β , exp / T β , calc , if T β , exp ≥ T β , calc T β , calc / T β , exp , if T β , exp < T β , calc , (25) along with the corresp onding standard devia tion ¯ x K σ K = " 1 n n X p =1 ( x p − ¯ x K ) 2 # 1/2 . (26) Again the sums run o ver the appr opriate set of n uclides. Perfect accuracy is attained when ¯ x K = 1 and σ K = 0. In a more incis iv e as sessment , a lso pursued b y K lap- dor and cowork ers, o ne calculates the p ercentage m of nu- clides having measured gr ound-state halflife T β , exp within a presc r ibed r ange (e.g., not grea ter tha n 10 6 s , 60 s , or 1 s ), for which the halflife generated b y the mo del is within a prescr ib ed to lerance fa c to r f (in particular, 2, 5, or 10) of the exp erimental v alue. A measur e M similar to ¯ x K , but defined in terms of log 10 T β rather than T β , has been used by M¨ o ller and collab orator s [19, 20]; sp ecifically , M = 1 n n X p =1 r p , (27) where r p = y p / ˆ y p . This quantit y gives the average posi- tion of the p oints in Fig. 5 for the res pective data sets. Its asso ciated standar d deviation σ M = " 1 n n X p =1 ( r p − M ) 2 # 1/2 , (28) 10 is also exa mined, a nd the “total” err or of the mo del for the data set in questio n is taken to be Σ = " 1 n n X p =1 r 2 p # 1/2 , (29) which is the same a s the σ RMSE defined in E q. (19). Mo del quality is also expres sed in terms of exp onenti- ated versions of these last three quantities, namely the mean deviation ra nge M (10) = 10 M , (30) the mean fluctuation range σ M (10) = 10 σ M , (31) and total e r ror range Σ (10) : Σ (10) = 10 Σ . (32) Super ior mo dels s hould hav e Σ, M , and σ M near zero , and M (10) , σ (10) M , and Σ (10) near unit y . Aga in, in a closer analysis of mo del capabilities, t hese indices are ev aluated within prescr ibed halflife domains. IV. RESUL TS AND DISCUSSION As already indicated, statistical modeling of β − -decay systematics is more effectiv e when the range of lifetimes considered is more r e stricted. Accordingly , the follow- ing detaile d presentation and ana ly sis will fo cus o n the prop erties and p erformance o f the b est ANN mo del de- veloped us ing the NuSet-B databas e, which is restricted to nuclides with β − halflife b elow 1 0 6 s. The quality of this m o del will b e compa r ed, in considerable detail, with that o f traditional theoretical global mo dels cited in the int ro duction, e a rlier ANN mo dels, a nd mo dels pr o vided by another class o f lea rning ma c hines (Suppor t V ector Machines, or SVMs). After a lar ge num b er of computer exp eriments on net works develop e d with different architectures, in- put/output co ding s chemes, activ ation functions, initial- ization prescriptions, and training algor ithms [4 7 ], we hav e arr ived at an ANN mo del well suited to approxi- mate repro duction of t he obser v ed β − -decay halflife sys- tematics and prediction of halfiv es of nuclides unfamil- iar to the net w ork. The preferred netw o rk is of archi- tecture [3 − 5 − 5 − 5 − 5 − 1 | 116 ]. The h yp erb olic tan- gent sigmoid is taken a s the a ctiv ation function of neu- rons in hidden la yers, and a sa turated linear function is a dopted in the output lay er. In training, the tech- niques for improving genera lization that were descr ib ed in Sec. I I, namely , Bay es ian reg ularization and cross- v alidation, were implemented in co m bination with the Leven berg -Marquardt o ptimization algorithm (LMOBP ) and the Nguy en-Widrow initialization method. The net- work was taught in batch mo de and the tra ining pha se was contin ued for 69 6 epo chs. Of the 116 degrees of fr ee- dom corresp onding to the netw ork weigh ts and biases, 98 survive the tra ining pr ocess ; this is the v alue of the nu mber γ k defined in Eq. (14). A. Comparison with Exp eriment In this s ubsection, w e ev aluate the performa nce of our ANN mo del b y direct comparis o n with the av ailable ex - per imen tal data . T able I collects results for the overall quality measures (19)–(21) commonly used in sta tistical analysis as well as the v alues o f the c orrelation co effi- cient R (See Eq. (23)).W e may quote for comparison the ro ot-mean-squa r e err ors o f 1.08 (learning mo de) and 1 .82 (prediction mo de) obtained in a n e a rlier ANN mo del of beta -decay sys tematics [33]. T A BLE I: Performa nce measures for the learning, v alida- tion, test, and whole sets, ac h iev ed b y the fav ored ANN mod el of β − -decay halfliv es, a netw ork with arc hitecture [3 − 5 − 5 − 5 − 5 − 1 | 116 ] trained on nuclides from NuSet- B. P erformance Learning V alidation T est Whole Measure Set Set Set Set σ RMSE 0.53 0.60 0.65 0.57 σ NMSE 1.004 0.995 1 .012 0.999 σ MAE 0.38 0.41 0.46 0.40 R-v alue 0.964 0.953 0 .947 0.958 These ov erall mea sures are silent with r espect to sp e- cific physical merits or s hortcomings of the mo del. On the other hand, such information can b e revealed by suit- able plots o f the results from applica tions o f the mo del, as exemplified in Figs. 5 – 9. Figs. 5 and 6 presen t the ratios of ca lculated to exp eri- men tal halflife v alues. The devia tions fr om the mea sured v alues are clear ly visible a s depar tures fro m the so lid line T β , calc / T β , exp = 1. Both figures show that the mo del re - sp onse follows the general trend of exper imen tal halflives. The scattered p oint s at higher halflife v alues imply that forbidden tra nsitions a re not adequa tely taken into ac- count b y the model. On the other hand, shell effects are included in the r igh t direction as shown in Figs . 6– 8. The accuracy of mo del output v ersus distance fro m stability ca n b e inferred fr om Fig. 7. The lo cal iso topic σ RMSE (Fig. 8) and the absolute deviation of c a lculated from exp erimental log 10 T β v alues (Fig. 7 ) indica te a bal- anced b ehavior of net work resp onse in all β − -decay r e- gions. How ev er, Fig. 7 shows that some less accura te results are obtained very near the β - stabilit y line, a fea- ture also present in the tr aditional mo dels of Refs. 15, 20. F or nuclei with very sma ll or very large mass v alues there are no sig nifican t deviations. Finally , the re g ression a nalysis we hav e p erformed, in which linear fits are made for the lear ning , v alidation, and test sets as well as the full NuSet-B database, serv es 11 10 −2 10 0 10 2 10 4 10 6 10 −4 10 −3 10 −2 10 −1 10 0 10 1 10 2 10 3 10 4 T β ,Calc / T β ,Exp T β ,Exp (s) Total Error = 2.50 for 252 nuclei with T exp < 1 s. Total Error = 2.87 for 653 nuclei with T exp < 1000 s. Learning Set Validation Set Test Set FIG. 5: Ratios of calculated to exp erimental halfliv es v alues for nuclides in the learning (black), va lidation (gray), and test (white) sets selected from NuSet-B, p lotted versus halflife T β , exp . T otal E rror equals to Σ (10) (See Eq. 32). 0 10 20 30 40 50 60 70 80 90 100 10 0 10 5 T β ,Calc / T β ,Exp ATOMIC NUMBER Learning Set Validation Set Test Set FIG. 6: Same as Fig. 5, bu t ratios of calculated to exp erimen- tal h alfliv es are p lotted against t h e atomic num b er Z . The dashed lines in d icate th e magic num b ers. to demonstrate in a different wa y the slig h t discrepancies betw een ca lculated a nd obse rv ed β − -decay halflives, as illustrated in Fig. 9. Moreover, the res ultan t R-v alues (See a lso T able I) imply that the observed sys tematics is smo othly and uniformly mirrored in the mo del’s re- sp onses. B. Comparison with RP A and GT Global Mo dels - A Detailed Analysis In this subsection, the p erformance of the fa vored net- work model o f β − lifetime systematics is compared with that of pro minent theory- thic k global models. T A BLE I I : Analysis of th e deviation b etw een cal- culated and exp erimen tal β − -decay h alfliv es of t he [3 − 5 − 5 − 5 − 5 − 1 | 116 ] AN N mod el in the Overall and Prediction Modes, based on th e qualit y measures M (10) and σ M (10) of Eqs. (30)–(31) used by M¨ oller and cow ork ers. The second column denotes th e even/odd character of the parent nucleus in Z and N , while n i s th e number of nuclides with exp erimental halfliv es lying in the prescrib ed range (first col umn). T β , exp (a) ANN Mo del. Overall Mo de. (s) Cl ass n M (10) σ M (10) < 1 o-o 76 1.04 2.53 odd 125 1.16 2.25 e-e 51 1.87 2.45 < 10 o-o 121 1.11 2.96 odd 187 1.10 2.31 e-e 87 1.65 2.56 < 100 o-o 158 1.08 3.06 odd 261 1.08 2.45 e-e 110 1.58 2.31 < 1000 o-o 19 1 1.12 3.06 odd 329 1.07 2.73 e-e 133 1.63 2.60 < 10 6 o-o 238 0.93 3.87 odd 437 0.97 3.67 e-e 163 1.25 3.44 T β , exp (b) ANN Mo del. Prediction Mode. (s) Cl ass n M (10) σ M (10) < 1 o-o 11 0.86 1.98 odd 3 2 1.05 2.40 e-e 7 2.36 3.26 < 10 o-o 20 0.86 3.76 odd 4 2 0.92 2.61 e-e 17 1.80 2.58 < 100 o-o 28 0.76 3.20 odd 5 7 0.97 2.91 e-e 21 1.58 2.98 < 1000 o-o 35 0.78 3.13 odd 6 8 0.84 3.07 e-e 28 1.49 3.04 < 10 6 o-o 46 0.58 4.71 odd 8 7 0.86 4.07 e-e 35 1.14 4.33 Adopting the qualit y measures (27)–(32) intro- duced b y M¨ o ller a nd co llabo r ators, w e first com- pare the p erformance of our global ANN mo del [3 − 5 − 5 − 5 − 5 − 1 | 116 ] with the global microscopic mo dels base d o n the proton- neutron quasipar ticle random-phas e appr o ximation ( pn QRP A), in particular, the NBCS+ pn QRP A mo del of Homma et al. [15] a nd 12 0 20 40 60 80 100 120 140 160 0 10 20 30 40 50 60 70 80 90 100 Neutron Number Proton Number 0 0.5 1 1.5 2 2.5 3 FIG. 7: Ab solute errors of the calc ulated to experimental beta-decay h alfliv es of all nuclides ( p ) in the full NuSet- B database, plotted v ersus proton and neutron n umbers Z and N for the [3 − 5 − 5 − 5 − 5 − 1 | 116 ] net w ork model. The bar on the righ t indicates the mapping from th e absolute error v alues | e p | = | log 10 T p β , exp − log 10 T p β , calc | t o the gray scale. T est nuclides are indicated as squ ares. the FRDM+ pn Q RP A mo del o f M¨ o ller et a l. [19]. The efficacy of the A NN mo del is also c ompared with th at of the micro- statistical Semi-Gros s Theory (SG T) a s imple- men ted by Nak a ta et al. [8]. T able II lists the ANN v alues for M (10) and σ (10) M sp ecific to o dd-o dd, o dd- A , and even- 0 10 20 30 40 50 60 70 80 90 100 0 2 Learning Set 0 10 20 30 40 50 60 70 80 90 100 0 2 Validation Set 0 10 20 30 40 50 60 70 80 90 100 0 2 Test Set 0 10 20 30 40 50 60 70 80 90 100 0 2 MASS NUMBER Whole Set FIG. 8: σ RMSE v alues in each isotopic chain, for the nu- clides in the learning, v alidation, and test sets, and the full NuSet-B d atabase, plotted against the mass num b er A , for the [3 − 5 − 5 − 5 − 5 − 1 | 11 6 ] netw ork mod el. even nuclides. T able II I collects the M (10) and σ (10) M v al- ues fo r the three th eory - thic k mo dels in the same format. As seen in these tables, b oth pn QRP A and SGT mo dels tend to ov erestimate the β − halflives of o dd-o dd n uclei, while the FRDM calculatio n tends to underestimate the shorter halflives for even-even a nd odd mass nuclei. The ANN model, on the other hand, tends to ov e restimate the halflives o f e v en-even nuclides, although to a smaller degree; this sho rtcoming is due, at least in part, to the relative scarcit y of even-even par en ts. T able IV co n tains v alues of the p erformance measur e s defined in Eqs. (27)–(32) for thre e g lo bal mo dels of β − - decay halflive. Here t he entries ar e not separ ated accord- ing to even-ev en, o dd- A , or o dd-o dd clas s mem b ership of the nuclides inv olved. Included ar e r esults for cal- culations within the FRDM+ pn Q RP A model, up dated to a more recent mass ev aluation [20], together with corres p onding v alues for a hybrid “micro-macro scopic” pn QRP A+ ff GT treatment, whic h combines the QRP A mo del of allowed Gamow-T eller β deca y with the Gross Theory of fir s t-forbidden ( ff ) decay [20]. In order to per- mit a dir ect compariso n with the ANN mode l, w e also rep ort in this table the results for ANN p erformance fig- ures determined indep endent ly of the ev en-even, odd- A , o dd-o dd n uclidic class distinction, focusing atten- tion only on the sub division in to halflife range s. The improv ed FRDM+ pn QRP A mo del underes timates long halflives, whereas the p n QRP A+ ff GT appro a c h slightly 13 0 2 4 6 8 10 0 2 4 6 8 10 log 10 T β ,exp − Learning Set. log 10 T β ,calc log 10 T β ,calc = 0.935 log 10 T β ,exp + 0.321 R = 0.964 0 2 4 6 8 10 0 2 4 6 8 10 log 10 T β ,exp − Validation Set. log 10 T β ,calc log 10 T β ,calc = 0.912 log 10 T β ,exp + 0.37 R = 0.953 0 2 4 6 8 10 0 2 4 6 8 10 log 10 T β ,exp − Test Set. log 10 T β ,calc log 10 T β ,calc = 0.922 log 10 T β ,exp + 0.253 R = 0.947 0 2 4 6 8 10 0 2 4 6 8 10 log 10 T β ,exp − Whole Set (NuSet−B). log 10 T β ,calc log 10 T β ,calc = 0.928 log 10 T β ,exp + 0.318 R = 0.958 FIG. 9: Regression analysis for t he learning, v alidation, test (prediction mod e) a nd for the full database (o veral l mode). S olid lines represent the desirable relation: (log 10 T β , calc = log 10 T β , exp ), while dashed lines indicate th e corresp onding b est linear fittings. The resp ective v alues of the para meters a and b of Eq. (22 ) and t he correlation coefficien t R of (Eq. (23)) are g iven in eac h panel. underestimates halflives over the full range considered. The tabulated qua lit y indices indicate that the ANN re- sp onses are in closer agreement with exp eriment mo re frequently than the FRDM+ pn QRP A calcula tio ns, while the ANN model and the pn QRP A+ ff GT a ppr oaches p er- form ab out equally well. The per formance o f our ANN model may a lso b e ev aluated in ter ms of the qua lit y meas ures ¯ x K and σ K employ ed by Klap dor and cow orkers and defined in Eqs. (24)–(26). T able V includes v alues of these quan- tities fo r the net work mo del, along with v alues for the pn QRP A calculation of Staudt et al. [13] and for the NBCS+ pn QRP A appro a c h of Homma et al. [15]. De- tailed compar ison shows that, judging fr om these indices, there is only a modest decline in the quality of ANN resp onses in g oing from the Overall Mo de to the P re- diction Mode, and that the performance of th e pn QRP A mo del is distinctly b etter than that of the neural net work for shor ter ha lfliv es but worse for longe r ha lflife v alues. W e note, howev e r, that the pn Q RP A mode l could b e re- garded as ov er-pa r ameterized c o mpared to mor e up-to - date mo dels, since the strengths of the N N interactions are derived from a lo cal fitting o f the ex perimental data in each chain. T urning to the NBCS+ pn QRP A calcula- tion, it is e viden t fro m T able V that the ANN mo del gen- erally exhibits smaller discrepancies b et ween calculated and o bserved β − -decay halflives. F or ex a mple, the net- work mo del has the a bilit y to r epro duce a ppro ximately 50% of ex p erimentally known halflives shor ter than 10 6 s within a factor of 2. It should b e noted, howev er, that the NBCS+ pn QRP A mo del has few er adjustable para m- eters [15]. Viewed as a whole, the analyses pre sen ted in T a bles I I - V demonstrate th at in a clear ma jor it y of cases in whic h the statistica l mo de l of β − halflives is pres en ted with test nu clides absent fr om the training and v a lidation sets, it 14 T A BLE I II: Same analysis as presented in T able I I, b ut in- stead assessing the quality of traditional theoretical mo dels, correspondin g sp ecifically to (a) the NBCS+ pn QRP A calcu- lation of H omma et al. [15], (b) the FRDM+ pn QRP A calcula- tion of M¨ oller and cow orkers [19], and (c) th e SGT calculation by Nak ata et al. [8]. A lso, these assessmen ts are limited to nuclides with exp erimen tal halfliv es b elow 1000 s. T β , exp (a) NBC S+ pn QR P A Cal culation [15]. (s) Clas s n M (10) σ M (10) < 1 o-o 28 1.75 4.96 odd 31 0.60 2.2 4 e-e 10 1.15 2.36 < 10 o-o 66 1.89 4.60 odd 81 0.92 3.8 4 e-e 34 1.01 2.93 < 100 o-o 85 3.15 10.51 odd 127 1.07 4.29 e-e 52 1.13 3.58 < 1000 o-o 93 3.02 10.25 odd 157 1.10 5.55 e-e 63 1.39 6.10 T β , exp (b) FRDM+ pn QRP A Calculation [19]. (s) Clas s n M (10) σ M (10) < 1 o-o 29 0.59 2.91 odd 35 0.59 2.6 4 e-e 10 3.84 3.08 < 10 o-o 59 0.76 8.83 odd 85 0.78 4.8 1 e-e 34 2.50 4.13 < 100 o-o 88 2.33 49.19 odd 133 1.11 9.45 e-e 54 2.61 4.75 < 1000 o-o 115 3.50 72.02 odd 194 2.77 71.50 e-e 71 6.86 58.48 T β , exp (c) SGT C alculation [8]. (s) Clas s n M (10) σ M (10) < 1 o-o 38 1.45 2.57 odd 56 1.75 2.3 2 e-e 19 2.03 2.30 < 10 o-o 83 1.94 4.10 odd 110 1.71 2.36 e-e 45 1.58 2.23 < 100 o-o 115 2.54 8.86 odd 174 1.95 3.15 e-e 64 1.45 2.40 < 1000 o-o 144 3.42 15.21 odd 232 2.36 5.42 e-e 85 1.38 2.81 T A BLE IV: . Comparison of v alues of quality ind ices c har- acterizing the “theory-thin” neural-netw ork model of the present work and tw o “theory-thick” models devel op ed by M¨ oller and cow orkers: ANN mo del in Overall (a) and Pre- diction (b ) Mo d es, and (c) FRDM+ pn QRP A and (d) p n - QRP A+ ff GT models of Ref. 20. The num b er n of nuclides with exp erimen tal halflives b elo w the prescrib ed limit is give n in the second column . The q ualit y indices lab eling columns 3-8 are defin ed in Eqs. (27) - (32). T β , exp (a) ANN Mo del. Overall M o de. ( s ) n M M (10) σ M σ M (10) Σ Σ (10) < 1 252 0.09 1.24 0.39 2.4 4 0.40 2.50 < 10 395 0 .08 1.21 0.42 2.60 0.42 2.65 < 100 529 0.07 1.17 0.43 2.68 0.43 2.71 < 1000 653 0.07 1.18 0.45 2.8 4 0.46 2.88 < 10 6 838 0 .00 1.01 0.57 3.70 0.57 3.70 T β , exp (b) ANN Model. Prediction Mode. ( s ) n M M (10) σ M σ M (10) Σ Σ (10) < 1 5 0 0.05 1.12 0.41 2.5 6 0.41 2.58 < 10 7 9 0.02 1.05 0.48 3.0 0 0.48 3.01 < 100 106 0.00 1.00 0.49 3.08 0.49 3.08 < 1000 131 -0.0 3 0.93 0.50 3 .16 0.50 3.17 < 10 6 168 -0.09 0.82 0.64 4.38 0 .65 4.44 T β , exp (c) F RD M +pn QR P A C alculation [20]. ( s ) n M M (10) σ M σ M (10) Σ Σ (10) < 1 184 0.03 1.06 0.57 3.7 2 0.57 3.73 < 10 306 0 .14 1.38 0.77 5.87 0.78 6.04 < 100 431 0.19 1.55 0.94 8.81 0.96 9.21 < 1000 546 0.34 2.20 1.28 19.09 1.33 21.17 < 10 6 − − − − − − − T β , exp (d) pn QRP A + ff GT Calculatio n [20]. ( s ) n M M (10) σ M σ M (10) Σ Σ (10) < 1 184 -0.08 0.84 0.4 8 3.04 0.49 3.08 < 10 306 -0.03 0.93 0.55 3.52 0 .55 3.53 < 100 431 -0.04 0.91 0.61 4.10 0.61 4.12 < 1000 546 -0.0 4 0.92 0.68 4.81 0.68 4.82 < 10 6 − − − − − − − makes pr e dictions that are clos er to exp erimen t than the corres p onding r esults fro m traditional mo dels based on quantum many-bo dy theor y and phenomenology . This is as cribed to some extend to the larg er n umber of ad- justable par ameters of the current model. C. Comparison with Prior ANN and SVM Mo dels Some explor atory applications of artificial neural net- works to β -decay systematics w ere carried out ear lie r by the A thens-Manchester-St. Lo uis co llabo r ation and re- po rted in Refs. 33, 34. The fir s t of these studies ar- rived at a fully-connected m ultilay e r feedforward ANN mo del having the s imple a rc hitecture [16 − 10 − 1 | 181 ], and the second dealt with a s imilar mo del with architec- ture [17 − 10 − 1 | 191 ]. Both of these efforts emplo yed 15 T A BLE V: Comparison of p erformance measures character- izing the ANN model of the present wo rk, when op erating in the Overall (a) and Prediction ( b) Modes, with corresponding v alues for (c) the pn QRP A mo del of Staudt et al. [13] and (d) the NBCS+ pn QRP A model of Homma et al. [15]. The qual- it y indices m %, ¯ x K , and σ K are defined by Eqs. (24) - (26). The third column rep orts the p ercentage m % of nuclides hav- ing exp erimental h alfliv es within th e prescrib ed range (second column), for which the calculated halflife lies within a certain tolerance factor (first column) of the exp erimental v alue. (a) ANN Mo del: Overall Mo de. factor T β , exp (s) m % ¯ x K σ K < 10 < 10 6 92.0 2.46 1.72 < 60 96.5 2.21 1.52 < 1 97.6 2.10 1.39 < 5 < 10 6 82.8 1.99 0.95 < 60 90.2 1.88 0.84 < 1 93.7 1.88 0.80 < 2 < 10 6 53.5 1.41 0.27 < 60 60.6 1.41 0.27 < 1 61.9 1.41 0.26 (b) ANN Mo del: Prediction Mode. factor T β , exp (s) m % ¯ x K σ K < 10 < 10 6 90.5 2.69 1.85 < 60 96.1 2.48 1.64 < 1 98.0 2.24 1.30 < 5 < 10 6 79.2 2.10 0.97 < 60 87.3 2.05 0.91 < 1 94.0 2.04 0.89 < 2 < 10 6 49.4 1.48 0.28 < 60 53.9 1.48 0.27 < 1 60.0 1.50 0.27 (c) pn QRP A Calculation [13]. factor T β , exp (s) m % ¯ x K σ K < 10 < 10 6 72.2 1.85 1.21 < 60 96.3 1.67 1.02 < 1 99.1 1.44 0.40 < 5 < 10 6 69.7 1.68 0.76 < 60 94.5 1.56 0.66 < 1 99.1 1.44 0.40 < 2 < 10 6 56.4 1.37 0.29 < 60 82.2 1.36 0.29 < 1 90.6 1.35 0.27 (d) NBCS+ pn QRP A Calculation [15]. factor T β , exp (s) m % ¯ x K σ K a < 10 < 10 6 76.7 3.00 - < 60 87.2 2.81 - < 1 95.7 2.64 - < 5 < 10 6 - - - < 60 - - - < 1 - - - < 2 < 10 6 33.8 1.43 - < 60 42.0 1.41 - < 1 50.7 1.43 - a σ K results are not a v ailable i n Ref. 1 5. T A BLE VI: P erformance measures for the [16 − 10 − 1 | 181 ] ANN mo del constructed by Mavrommatis et al. [33]. The quality indices ¯ x K and σ K , introduced by K lap dor and co wo rkers, are defined in Eqs. (24) and (26), resp ectively , while m % is the percentage of n uclides ha ving exp erimen- tal halflives within the prescrib ed range (second co lumn), for whic h the calculated halflife lies within the t olera nce factor (first col umn) of the exp erimental va lue. Prediction Mode. A NN mo del of R ef. 33. factor T β , exp (s) m % ¯ x K σ K < 10 < 10 6 82.8 2.78 1.83 < 60 8 8.1 2.80 1.83 < 1 90.0 2.88 1.88 < 5 < 10 6 72.4 2.22 1.07 < 60 7 6.2 2.20 1.01 < 1 76.7 2.23 1.02 < 2 < 10 6 39.7 1.39 0.29 < 60 4 2.9 1.44 0.32 < 1 43.3 1.46 0.32 T A BLE VI I: Perfo rmance measures for the [17 − 10 − 1 | 191 ] ANN model constructed by Clark et al. [34]. The quality indices M (10) and σ M (10) , in trod uced b y M¨ oller and co wo rkers, are defined in Eqs. (30)–(31). T β , exp Prediction Mode. A NN mo del of R ef. 34. (s) Cla ss M (10) σ M (10) < 1 o-o 2.05 2.31 odd 1.08 2.38 e-e 1.79 2.71 < 10 o-o 2.26 5.42 odd 1.19 2.44 e-e 1.31 2.30 < 100 o-o 1.76 5.19 odd 1.12 3.15 e-e 0.98 2.67 < 1000 o-o 2.22 6.25 odd 1.22 5.50 e-e 0.93 4.78 binary encoding of Z and N a t t he input, used the same data sets which differ e d fro m the o nes o f the present work and implemen ted a quite ortho dox backpropagation algo - rithm, incorp orating a momentum term to enhance con- vergence of the lear ning pro cess [27]. The main difference betw een these tw o ea r lier ANN mo dels is the addition, in the seco nd, of an analog input unit represe n ting the Q - v alue of the dec a y . T ables VI and VI I pres e nt v alues for per formance measures of these ANN mo dels op erating in the Pr ediction Mode . (W e concentrate on this asp ect of p erformance, since it rela tes dire ctly to the extr ap a- bility o f the mo dels.) F or the [16 − 10 − 1 | 181 ] net work mo del, T a ble VI displays results for the q ualit y mea sures used b y Klap dor and cowork ers, ev aluated on the test set. F or the [17 − 10 − 1 | 191 ] mo del, T able VI I gives results 16 T A BLE VI I I: Ro ot- mean-square errors ( σ RMSE ) for (a) the [3 − 5 − 5 − 5 − 5 − 1 | 116 ] ANN model of the present work, and (b) the SVM mo del co nstructed by Li et al. [37]. Here n is the number o f nuclides in eac h of th e data (sub)sets. (a) ANN Mo del. Learning Set V alidation Set T est Set Class n σ RMSE n σ RMSE n σ RMSE EE 95 0.52 33 0.52 35 0.64 EO 121 0.55 46 0.77 47 0.57 OE 141 0.46 42 0.53 40 0.66 OO 1 46 0.56 46 0.52 46 0.71 T otal 503 0.53 167 0.58 168 0.65 (b) SVMs C alculation. Li et al. [37]. Learning Set V alidation Set T est Set Class n σ RMSE n σ RMSE n σ RMSE EE 131 0.55 16 0.57 16 0.62 EO 179 0.41 22 0.42 22 0.51 OE 172 0.41 21 0.47 21 0.47 OO 1 90 0.52 24 0.4 24 0.52 T otal 672 0.47 83 0.46 83 0.53 for the p erformance mea sures o f M¨ oller and co workers, based o n the resp onses o f the mo del t o the same test set. Upo n comparis on with the entries for M (10) in T able I I, one sees that the p erformance of the 17-input net work mo del is r a ther similar to that of the pres en t 6- la yer ANN mo del, except for o dd-o dd n uclides – whose lifetimes ar e ov erestimated by the older netw o r k. In the c ase of the 16-input model, compariso n of the en tries for m % in T a- bles VI and V provides substantial evidence for the sup e- riority of the new ANN mo del developed here, although this is not so clea rly reflected in the resp ectiv e ¯ x K v alues. F ro m a strategic standp o in t, the adv a n tages of the current ANN model o ver the ear lier ones a re t wofold. First, the num b er of degr ees of f reedom (w eight and bias parameters ) is reduced co nsiderably by the use of ana- log encoding of Z a nd N . Despite the greater n um- ber of hidden layers, the curre nt mo del, with architec- ture [3 − 5 − 5 − 5 − 5 − 1 | 116 ], has 65 para meters fewer than the 16- input mo del and 7 5 less than the 17-input mo del. Seco ndly , there is the adv antage relative to the latter mo del that the curr en t version do es not rely on Q -v a lue inpu t. Exper imen tal Q -v a lues are not kno wn for all the n uclides o f interest, so the need to call upo n the- oretical results for input v ariables is eliminated. As mentioned in the introductio n, initial studies of the classification and r egression problems presented b y n u- clear systematics hav e rece n tly b een carried o ut [37, 38] using the r elativ ely new metho dology of Suppo r t V ec- tor Machines (SVMs). SVMs, which b elong to the class of kernel metho ds [2 7], are learning systems having a rigoro us basis in the statistical learning theory devel- op ed by V apnick a nd Cher v onenkis [28] (VC theor y). There are similarities to multila yer feedforward neura l net works, notably in ar c hitecture, but there are a lso im- po rtant differences having to do with the b etter c o n trol ov er the tradeoff b etw ee n complexity and genera lization ability within the SVM fr amew ork. Importantly , within this framework there is an automated pro cess for deter- mining the explicit weigh ts of the netw ork in terms of a set of supp ort vectors optimally distilled from among the training pa tterns [4 8]. The few remaining par ame- ters are embo died in the inner-pro duct kernel that allows one to deal efficiently w ith the high-dimensional featur e space appr opriate to the pr oblem to b e solved. The SVM metho dology was o riginally dev elop ed for c la ssification problems, but has b een ex tended to function appro xima- tion (regres s ion) [27]. The r e cen t applications of SVMs to global mo del- ing of nuclear prop erties, including atomic masses, α decay chains of sup erheavy n uclei, gr ound-state spins and parities, and β − lifetimes, demonstrate considera ble promise for this approach. As in the present w ork, cross- v alidation is perfo r med, sepa rating the full data ba se into learning, v a lida tion, and test s ets. In the existing stud- ies, the data for a given prop erty is divided in to four nonov erlapping subsets co n taining input-output pa irs for even-ev en, even-o dd, odd-e v en, a nd odd- odd cla sses of nu clides distinguished by the parity of Z and N . T able VI II provides v a lues of the conv en tional σ RMSE per formance mea sure (19), both for the SVM mo del of β − -decay systematics constructed by Cla rk et al. [37] and for the presen t ANN mo del. The SVM mo del demon- strates better per formance based on this compariso n, with a few exceptio ns inv olving the even-even nuclides. How ever, this compar ison is somew ha t misleading, since a lar g er fra ction o f the data was used for training, leaving nu merically smaller v alida tio n and test sets in the SVM construction. It m ust b e noted in this rega rd that the sub div ision of the nuclides into four ( Z, N ) parit y classes requires four s eparate SVM appr o ximation pr oces s es to be executed. This can lead to spurious fluctuations in the predictions of lifetimes for nuclides of isoto pic and isotonic chains, as found in detailed insp ection of the outputs o f the SVM mo del. W e should note further, how ev er, that a subsequent SVM mo del of β − system- atics shows σ RMSE v alues significa n tly low er than tho se given in T able VI I I for the SVM mo del of Li et al. D. The Extrapability of the ANN Mo del It is of course des irable to hav e a mo del that repro- duces experimentally k no wn β − halflives of nuclei acro ss the known n uclear lands cape. One can certainly achiev e that g oal with a sufficiently complex model that inv olves a s ufficien t num ber of adjustable parameter s. How ever, excess complexity generally implies p o or predictive abil- it y , and especially po or extrapability – lac k of the ability to extr apola te awa y from existing da ta. Acco rdingly , a m uch more important and challenging go al is to dev elop a global mo del, s tatistical or other wise, with minimal complexity consistent with g oo d generalization pr oper - ties. The extent t o which this goal can b e achiev ed with 17 65 70 75 80 85 90 95 10 −2 10 0 10 2 10 4 10 6 10 8 10 10 T β (ms) MASS NUMBER 26 Fe Exp. Data ANN ANN pred. pnQRPA+ffGT GT* FIG. 10: Exp erimental data and derived halflives from differ- ent mo dels for the isotopic c hain of 26 F e. 120 125 130 135 140 145 150 155 160 10 −2 10 0 10 2 10 4 10 6 10 8 10 10 T β (ms) MASS NUMBER 47 Ag Exp. Data ANN ANN pred. pnQRPA+ffGT GT* FIG. 11: The same as in Fig. 10 but for the i sotopic c hain o f 47 Ag. 120 125 130 135 140 145 150 155 160 165 170 10 −2 10 0 10 2 10 4 10 6 10 8 10 10 T β (ms) MASS NUMBER 50 Sn Exp. Data ANN ANN pred. pnQRPA+ffGT GT* FIG. 12: The same as in Fig. 10 but for the i sotopic c hain o f 50 Sn. 60 65 70 75 80 85 90 95 100 10 −2 10 0 10 2 10 4 10 6 10 8 10 10 10 12 10 14 T β (ms) MASS NUMBER 28 Ni Exp. Data New Exp. ANN ANN pred. pnQRPA+ffGT GT* FIG. 13: The same as in Fig. 10 but for the isoto pic chain of 28 Ni. 110 120 130 140 150 160 10 −2 10 0 10 2 10 4 10 6 10 8 10 10 10 12 T β (ms) MASS NUMBER 48 Cd Exp. Data ANN ANN pred. pnQRPA+ffGT GT* FIG. 14: The same as in Fig. 10 but for the isoto pic chain of 48 Cd. 210 220 230 240 250 260 270 280 10 −2 10 0 10 2 10 4 10 6 10 8 10 10 T β (ms) MASS NUMBER 83 Bi Exp. Data ANN ANN pred. pnQRPA+ffGT GT* FIG. 15: The same as in Fig. 10 but for the isoto pic chain of 83 Bi. 18 machine-learning techniques for differen t nuclear pro per- ties is yet to be decided. Of course, one can test the p er- formance of a fav ored netw o rk mo del on outlying nuclei (outlying with r e spect to the v alley of stability), nuclei that ar e unknown to the netw ork, but have known v al- ues for the prop ert y of int erest. Adequate p erformance in such tests ca n provide some de g ree of confidence in pr e- dictions made by the mo del for nea rb y nuclei that have not yet been reached b y exp eriment. In this subse ction, we pr e s en t so me sp ecific evidence of the extra pa bilit y of the [3 − 5 − 5 − 5 − 5 − 1 | 116 ] AN N mo del developed in the present w ork. Figs. 10–1 5 show the halflives estima ted b y the mo del for nuclides in the F e, Ag, Sn, Ni, Cd, and Bi isotopic chains. Cor respo nd- ing p n QRP A+ ff GT es timates are included for a compar - ison. Also included are some r esults (labele d GT* ) from calculations by P feiffer, Kratz, and M¨ oller [49] based o n the ear ly Gro ss Theor y (GT) o f T ak a hashi et al. [7 ], with upda ted mass v alues [17, 5 0] (GT*). There is no unam- biguous criter ion that can b e used to g auge the p erfor- mance o f these mo dels. Judg ing fr o m the observed b e- havior of the k no wn nuclei, one can g enerally exp ect that the more neutron-rich an exotic isotop e is, the shor ter its halflife. This exp ected downw a rd tendency is predicted by all the mo dels. One also exp ects to se e some even-odd stagger of the points for neighboring isotop es. The ANN mo del produces suc h b ehavior, but it is probably ov eres- timated. Similar b ehavior, thoug h less pronounced, ap- pea rs in the results from contin uum-Quasipa rticle-RP A (CQRP A) approa c hes [22] a nd in the results of o ther the- oretical calculations [7, 20]. E. The r-Process Path Predictions fro m the ANN mo del develop ed here, and improv emen ts up on it, may prov e to b e useful for quan- titative studies inv olving r-pro cess n ucleosynthesis. The β -halflives ( T β ) and β - dela yed neutron emission proba- bilities ( P n ) of those isotop es lying in the r-pro cess path are the tw o key β -decay par a meters that be a r up o n the β -streng th function ( S β ) [5 ]. According ly , a n approa ch having global applica bilit y for accurate prediction of β halflives is needed for detailed dyna mica l r-pro cess cal- culations. Mor eo ver, reliable b e ta-halflife calculations are of sp ecial interest for the r -ladder isoto nes N = 50, 82, and 126 where s olar abundances pea k, since they determine the r-pro cess time scale . In Figs . 16 – 18 we plot the halflives of c lo sed-neutron-shell nuclei in these significant r-pro cess reg ions as predicted b y our ANN mo del, in compariso n with cor respo nding res ults fro m pn QRP A+ ff GT and GT* calculations [20]. In particu- lar, it is interesting to co mpare the v a rious estimates of the halflife of the doubly mag ic r-pro cess nucleus 78 Ni ( Z = 28, N = 50). The res ult given by the ANN mode l is cons is ten t with the rec e n t measurement b y Hosmer et al. [45]. In Fig. 19, ha lflives of β − -decaying n uclides tha t are found nea r or on a typical r-pr oces s path with neu- 68 70 72 74 76 78 80 82 84 86 88 10 −2 10 0 10 2 10 4 10 6 10 8 10 10 10 12 T β (ms) MASS NUMBER N=50 Exp. Data ANN ANN pred. pnQRPA+ffGT GT* FIG. 16: The same as in Fig. 10 but for the isoto nic chain of N = 50. 115 120 125 130 135 140 10 −1 10 0 10 1 10 2 10 3 10 4 10 5 10 6 10 7 10 8 T β (ms) MASS NUMBER N=82 Exp. Data ANN ANN pred. pnQRPA+ffGT GT* FIG. 17: The same as in Fig. 10 but for the isoto nic chain of N = 82. 175 180 185 190 195 200 205 210 10 −1 10 0 10 1 10 2 10 3 10 4 10 5 10 6 10 7 10 8 T β (ms) MASS NUMBER N=126 Exp. Data ANN ANN pred. pnQRPA+ffGT GT* FIG. 18: The same as in Fig. 10 but for the isoto nic chain of N = 126. 19 79Cu 80Zn 81Ga 83Ga 130Gd 131In 133In 134Sn 135Sb 138Tc 0 1000 2000 3000 4000 5000 6000 7000 8000 T β (ms) Exp. Data ANN pnQRPA+ffGT GT* . FIG. 19: Halfliv es for β − -decaying nuclides that are found near or on a typical r-process p ath with th e neutron separa- tion energy lesser or equal to 3 MeV. tron se paration energy b elow 3 MeV are c ompared with those from pn Q RP A+ ff GT and GT* ca lculations [20]. The r esults given by the ANN mo del are close to the exp erimen tal v a lues. V. CONCLUSION AND PRO SPECTS A statistica l approa c h to the global mo deling of nuclear prop erties has b een prop osed and implemented for treat- men t of the systematics o f β − lifetimes of the g round states of nu clei that decay exclusively in this mo de. Spec ific a lly , a rtificial neura l netw orks (ANNs) o f mult i- lay er feedforward architecture are ta ugh t to repro duce the experimentally measured lifetimes o f nuclides from a chosen lar ge data set. T r aining of the net works is ca rried out in such a wa y that their intrinsic generaliza tion ca- pabilities ca n b e explo ited to pr edict lifetimes of n uclides outside the data set used for learning. W e hav e b een able to develop an ANN mo del of this kind that demons trates very go od pro perties in terms of both the standard p erformance measures used in sta- tistical a nalysis and more problem-s pecific q ua lit y mea- sures that have b e en introduced to asses s traditional the- oretical mo dels for calculating β − lifetimes on a glo bal scale. In a purely results- oriented sense (a ccurate fitting of giv en data and go o d prediction for nuclei no t inv olved in the fitting pro cess ), the per formance of this model matches or surpas ses that o f traditional models based on nu clear theory and pheno menology . This success op ens the pr ospec t that statistica l modeling based on machine learning ca n provide a v aluable tool in the e x ploration of β − halflives of newly created n uclei b ey ond the v a lley of stability . Exp erience ga ined previo usly with neur al-net work mo deling of n uclear systematics (especia lly the modeling of masses [30, 3 5, 36]) strongly sugg ests that significa n t further improvemen ts on the current ANN mo del of β − systematics ar e p ossible, as mo r e s ophisticated training algorithms and ma chine-learning strateg ies ar e c o n tin- uously b eing developed. Thus w e plan further studies along the same lines with multila yer feedfo r w ard percep- trons, while also exploring the p otential of Support V ec- tor Machines. It is to b e str essed that this progra m can be no substi- tute for aggr essive pursuit of tra ditio nal, “theo ry-thick” global mo deling, w hich inevitably pro vides gre a ter in- sight into the underlying physics resp onsible for v a lue s taken by the targe ted nuclear prop erties. The statistical approach c a n best serve in complemen tary and s upport- ive role s . W e p oint out that h ybrid statistical-theor etical mo dels show specia l promise, as demonstr ated in Ref. 36. In that recent w ork, a [4 − 6 − 6 − 6 − 1 | 169 ] ANN is used to mo del the differ enc es b etw e en measur ed mass- excess v alues and the theoretical v alues given b y the finite-range droplet mo del (FRDM) of Ref. 17, there b y enabling improv ed pr ediction of masses awa y from s ta - bilit y . Finally , as this last rema r k exe mplifies, the pr o spects for fruitful application of statistical, machine-learning metho ds ex tend to a wide range of nuclear prop erties beyond the sy s tematics of β -decay lifetimes. VI. ACKNO WLEDGEMENT S This resea rch has be e n suppor ted in part by the U. S. National Science F oundation under Grant No. PHY- 01403 16 and b y the University of At hens under Gra n t No. 70/4/ 3309. W e wish to thank G. Audi and his team for very helpful communications. JWC is gr ateful to Com- plexo Interdisciplinar of the Universit y of Lisb on and to the Department of Physics of the T echnical Universit y of Lisb on for gracio us ho spitalit y during a sabbatical leave; and to F unda ¸ c˜ ao para a Ciˆ encia e a T ecnologia of the Por- tuguese Minis t´ e rio da Ciˆ encia, T ecnologia e Ensino Su- per ior as well as F unda¸ c˜ ao Luso-Amer ic a na for resear ch suppo rt during the sa me perio d. 20 [1] Opp ortunities in Nucl e ar Sc ienc e: “The F r ontiers of Nu- cle ar Scienc e: A L ong R ange Plan” ( DOE/NSF, 2007), and “L ong R ange Plan 2004” (NU PECC, 200 4). [2] B. Jonson and K . Riisager, Nu cl. Phys. A693 , 77 (2001). [3] F. Kapp eler, F. K. Thielemann, and M. Wiesc her, An n u. Rev. Nucl. Past. S ci. 48 , 175 (1998). [4] M. A rn ould, S. Goriely , and K. T ak ahashi, Ph ys. Rep. 450 , 97 (2007). [5] K.-L. Kratz, K. F arouqi, and B. Pfei ffer, Progr. Pa rt. Nucl. Ph y s. 59 , 147 (2007). [6] I. N. Borzov, Nucl. Phys. A 777 , 645 (2006). [7] K. T ak ahashi, M. Y amada, and T. K ondoh, At. Data Nucl. Data T ables 12 , 1 01 (1973). [8] H. Nak ata, T. T achibana, and M. Y amada, Nucl. Phys. A625 , 521 (1997). [9] E. Caurier, K. Langanke, G. M. Pinedo, and F. Now aski, Nucl. Ph y s. A 653 , 49 (1999). [10] H . Graw e, K. Langank e, and G. M. Pinedo, Rep. Progr. Phys. 70 , 1525 (20 07). [11] H . V. Klap dor, Prog. P art. Nucl. Phys. 10 , 131 (1983), ibid 17 , 419 (1986), ibid 32 , 261 (1994). [12] H . V. Klap dor, J. Metzinger, and T. Oda, At. Data Nucl. Data T ables 31 , 81 (1984). [13] A . S taudt, E. Bender, K. Muto, and H. V. K lapdor, At. Data Nucl. Data T ables 44 , 79 (19 90). [14] M. Hirsch, A. Staudt, K. Muto, and H. V. Klapdor, At. Data Nucl. Data T ables 53 , 165 (1993 ). [15] H . Homma, M. Bender, M. Hirsc h, K. Muto, H. V. K lap- dor, and T. Oda, Ph ys. Rev. C54 , 2972 (1996 ). [16] J. U. Nabi and H. V. Klapd or, A t. Data Nucl. Data T a- bles 71 , 149 (1999), ibid 88 , 237 (2004). [17] P . Moll er, J. R. N ix, W. D. M yers, and W. J. Swiatecki, At. Data Nucl. Data T ables. 59 , 18 5 (1995). [18] P . Moll er and J. Randrup, N ucl. Phys. A514 , 1 (1990). [19] P . Moller, J. R. Nix , an d K.-L. Kratz, At. Data Nu cl. Data T ables 66 , 131 (1997). [20] P . Moll er, B. Pfeiffer, and K .-L. Kratz, Phys. Rev . C67 , 055802 (2003 ). [21] J. Engel and et al., Ph ys. Rev. C60 , 014302 (1999). [22] I . Borzov and S. Goriely , Phys. R ev. C62 , 035501 (2000). [23] I . N. Borzo v, Phys. Rev. C67 , 025802 (2003). [24] T. Niksic, T. Marketin, D. V retenar, N. P aar, and P . Ring, Ph ys. Rev. C71 , 014308 (2005). [25] T. Marketin, D. V reten ar, and P .R ing, Ph ys. Rev. C75 , 024304 (2007 ). [26] C. Bishop, Neur al N etworks for Pattern R e c o gnition (Clarendom, Oxford, 1995). [27] S . Ha ykin, Neur al Networks: A Compr ehensive F ounda- tion (McMillan, N.Y., 1993). [28] V . V apnik, The Natur e of Statistic al L e arning The ory (Springer, N.Y., 1995). [29] N . Cristianini and J. Shaw e-T aylor, An Intr o duction to Supp ort V e ctor M achines and ot her Kernel-Base d L e arn- ing Metho ds (Cam bridge Universi ty Press, Cambridge, UK, 20 02). [30] J. W. Clark, in Scientific Applic ations of Neur al Nets , edited by J. W . Clark, T. Lindenau, and M. L. Ristig (Springer-V erlag, Berl in, 1999), p. 1. [31] K . A. Gernoth, in Scientific Applic ations of Neur al Nets , edited by J. W. Clark, T. Lindenau, and M. L. R istig (Springer-V erlag, Berl in, 1999), p. 13 9. [32] E. T. Ja ynes, Pr ob abil i ty The ory: The L o gic of Scienc e (Cam bridge Universit y Pre ss, Cam bridge, UK, 2 003). [33] E. Ma vrommatis, A. Dakos , K. A. Gernoth , and J. W. Clark, in C ondens e d Matter The ories , edited by J. da Pro vid en cia and F. B. Malik, Commack (Nov a Sci- ence Publishers, N.Y., 1998), vol. 13, p. 4 23. [34] J. W. Clark, E. Mavrommatis, S. Athanassopoulos, A. Dakos, and K. A. Gernoth, in Pr oc . of the Conf. on Fission Dynamics of A tomic Clusters and Nuclei , edited by D. M. Brink, F. F. Karp ec hire, F. B. Malik, and J. d a Providencia (W orld Scien tific, Singap ore, 2001), pp. 76–85, (n ucl-th/0109081). [35] S. Athanassopoulos, E. Ma vrommatis, K. A . Gernoth , and J. W. Clark, Nucl. Phys. A743 , 222 (2004), (nucl- th/0307117). [36] S. Athanassopoulos, E. Ma vrommatis, K. A . Gernoth , and J. W. Clark, in A dvanc es i n Nucle ar Physics, Nu- cle ar Astr ophysics, He avy Ions a nd R elate d A r e as , edited by G. A. Lalazissis and C. C. Moustakidis (HNPS, Thes- saloniki, 200 5), p. 65, (nucl-th/051 1088), and to be pub- lished. [37] H. Li, J. W. Clark, E. Mavrommati s, S. Athanassopou- los, and K. A. Gernoth, in Condense d Matter The ori es , edited by J. W. Clark, R. M. Panoff, and H. Li (N o v a Science Publishers, N.Y., 2006), vol. 20, p. 505, (nucl- th/0506080). [38] J. W. Clark a nd H. Li, in Re c ent Pr o gr ess in Many-Bo dy The ories , edited by S. Hernan d ez and H. Cataldo (W orld Scientific, Singap ore, 2006), v ol. 8, (nucl-th/0603037). [39] H. Li, Ph-D Thesis (W ashington U niv ersity , 200 6). [40] M. T. Hagan, H. B. Demuth, and M. H. Beale, Neu- r al Network D esign (PWS Publishing Company , USA , 1995). [41] M. T. Hagan and M. B. Menha j, IEEE T ransactions on Neural Net wo rks 5 , 98 9 (1994). [42] D. J. C. MacKay , Neural Computation 4 , 415 (1992). [43] F. D. F oresee and M. T. Hagan, in Pr o c. of the Int. Joint Conf. on Neur al Networks ( 1997), pp. 1930 –1935. [44] G. Audi, O. Bersillon, J. Blac hot, and A. H. W apstra, Nucl. Ph ys. A729 , 3 (2003). [45] P . T. Hosmer, H. Schatz, A. Aprahamian, O. Arndt, R. R. C. Clemen t, A. Estrade, K .-L. Kratz, S . N. Lid- dick, P . F. Man tica, W. F. Mueller, et al., Ph ys. Rev. Lett. 94 , 11 2501 (2005). [46] D. Nguyen and B. Widrow, in Pr o c. of the Int. Joint Conf. on Neur al Networks ( 1990), vol. 3, pp. 21–26 . [47] N. Costiris, Diploma Thesis ( Ph ysics Department, Divi- sion of Nuclear Physics and Pa rticle Physics, Universi ty of A thens, Greece, 2006). [48] A. J. Smola and B. Schoelkopf, T ech. Rep. NC2-TR-1998- 030, Roy al Hollo w a y College, London (19 98). [49] B. Pfeiffer, K.-L. Kratz, and P . Moller, Institut F ur Kern - chemie , Internal Rep ort (200 3). [50] G. Audi and A. H. W apstra, Nucl. Phys. A595 , 409 (1995).
Original Paper
Loading high-quality paper...
Comments & Academic Discussion
Loading comments...
Leave a Comment