Soccer matches as experiments: how often does the best team win?
Models in which the number of goals scored by a team in a soccer match follow a Poisson distribution, or a closely related one, have been widely discussed. We here consider a soccer match as an experiment to assess which of two teams is superior and …
Authors: G. K. Skinner, G. H. Freeman
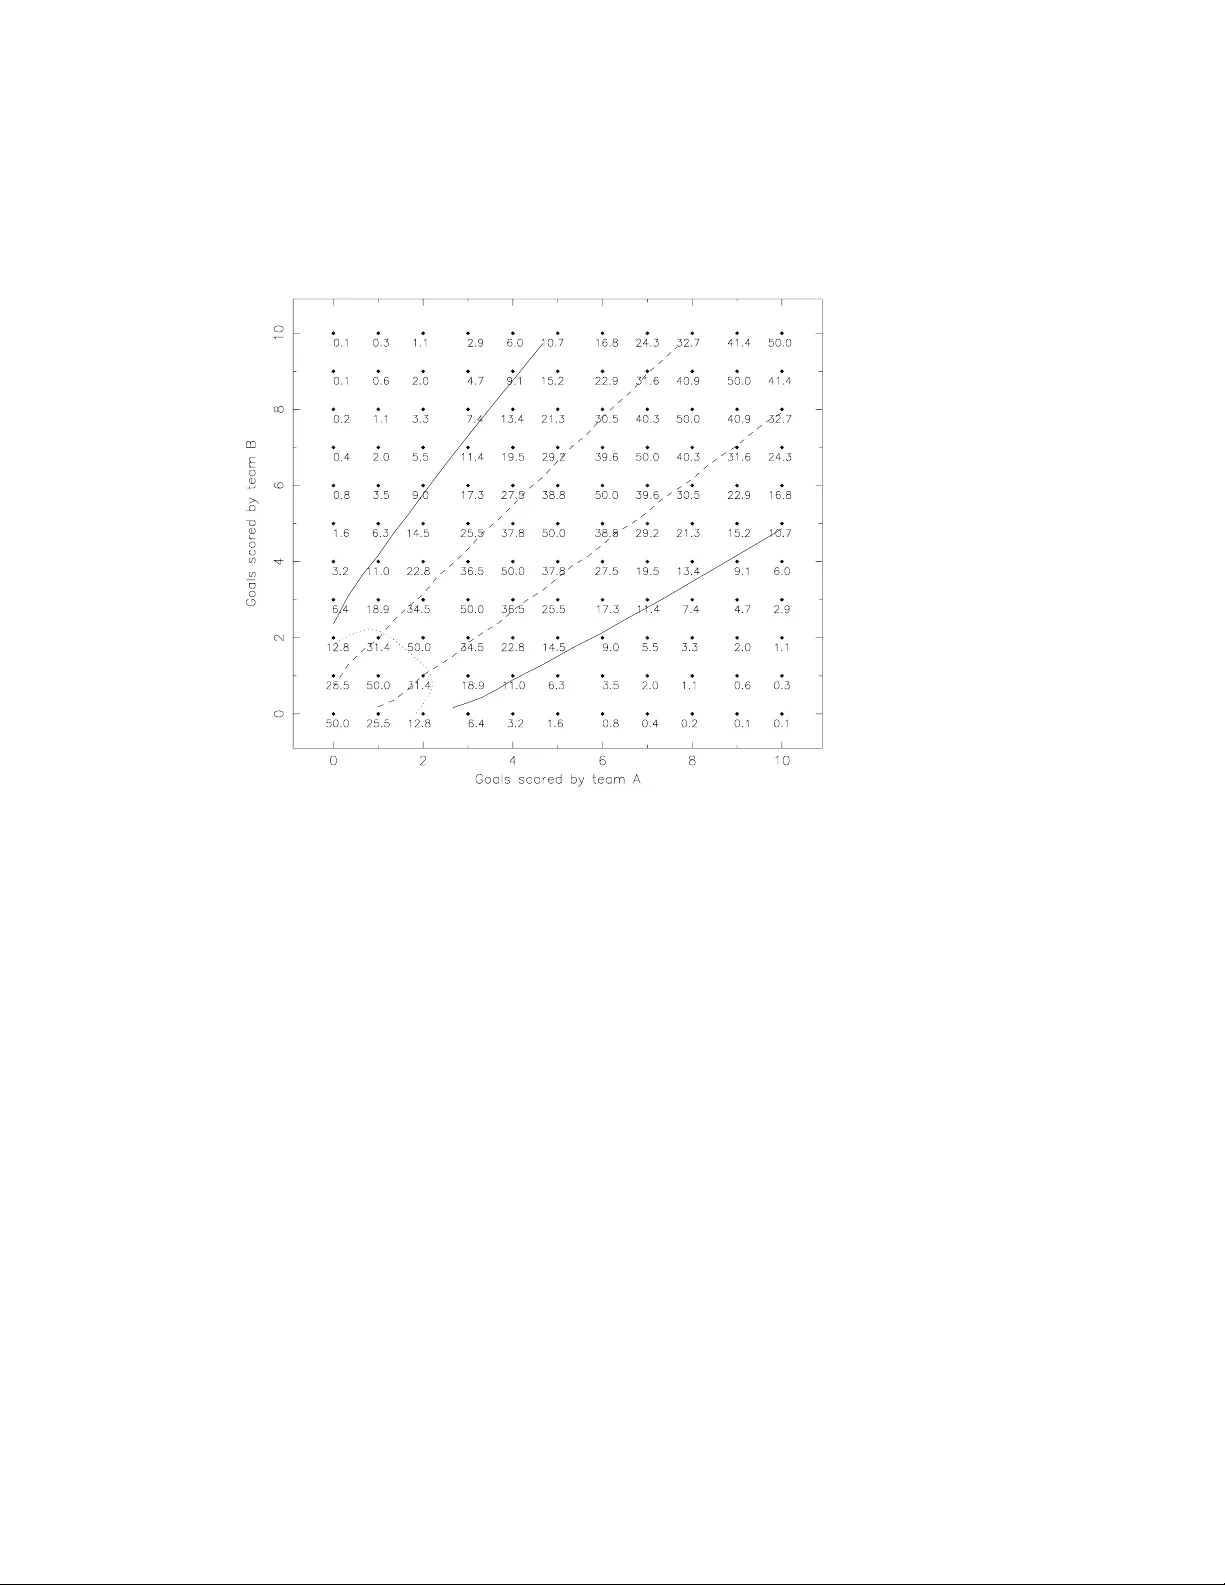
Final version is publishe d in: Journal of Applie d Statistics V ol. 36, No. 10, Octob er 2009, 1087–1095 RESEAR CH AR TICLE Are soccer matc hes badly designed experiments? G. K. Skinner a ∗ and G. H. F reeman b a Dept. of Astr onomy, University of Maryland, Col le ge Park, MD 20742, USA & CRESST & NASA-GSF C, Gr e enb elt R o ad, Gr e enb elt, MD 20771, USA ; b University of Warwick, Coventry, UK ( Submitte d 10 Mar ch 2008 ) Models in whic h the n umber of goals scored by a team in a soccer match follow a Poisson distribution, or a closely related one, hav e b een widely discussed. W e here consider a so ccer match as an exp eriment to assess which of tw o teams is sup erior and examine the probabil- ity that the outcome of the exp eriment (match) truly represents the relative abilities of the tw o teams. Giv en a final score it is possible b y using a Bay esian approach to quantify the probability that it was or was not the case that ‘the b est team won’. F or typical scores, the probability of a misleading result is significan t. Mo difying the rules of the game to increase the typical num b er of goals scored w ould impro ve the situation, but a level of confidence that would normally be regarded as satisfactory could not b e obtained unless the character of the game were radically c hanged. Note: F or copyrigh t reasons this is a preliminary form of an article whose fi- nal and definitive form has been published in Journal of Applie d Statistics 36, 1087–1095 (Oct 2009) [copyrigh t T aylor & F rancis] and is av ailable online at: http://www.informa world.com/smpp/con tent/ ∼ db=all ∼ con tent=a915275365 . Contact the corresponding author in case of difficulty in accessing the published paper. Keyw ords: F o otball, So ccer, Exp eriment Design, Poisson statistics, Bay esian 1. In tro duction The distribution of the n umber of goals scored in asso ciation fo otball (so ccer) matc hes has b een in vestigated by v arious authors o ver the last half century [2, 5, 7, 12, 14]. The emphasis has usually b een on finding mo dels that describ e the distributions observ ed in large data-bases of matc h results, often with the ob jective of forecasting results, of optimising pla ying or betting strategies, or of studying the efficiency of the b etting market. W e here use the results of this work not for forecasting but to consider what, if anything, can b e deduced from the result of a matc h ab out the relative strengths of the teams. A fo otball match can be regarded as an exp eriment to determine which of the t wo teams is in some sense sup erior, or perhaps one should sa y “.. is sup erior given the date and circumstances of the matc h”. The statistical models of goal num b ers that hav e b een developed ha ve ma jor implications for the probability that the exp erimen t gives a correct result – that is to sa y that “the best team w on”. These ha ve not b een widely discussed, and here we quantify them and extend some of the considerations to tournaments in volving man y teams and matches. ∗ Corresponding author. Email: skinner@milkywa y .gsfc.nasa.gov Final v ersion is published as: ISSN: 0233-1934 prin t/ISSN 1360-0532 online c 2009 T aylor & F rancis DOI: 10.1080/02664760802715922 http://www.informa world.com 2 G. K. Skinner and G. H. F r e eman In the simplest mo dels whic h hav e b een considered, goal scoring is regarded as a Bernoulli pro cess in which the probability of team A scoring in time interv al dt is λ a dt , where λ a is constant, and similarly that for team B is λ b dt . This leads to the probabilit y of the result ( N a , N b ) being giv en by the pro duct of tw o univ ariate P oisson distributions : ℘ { ( N a , N b ) | ( α a , α b ) } = α N a a exp( − α a ) N a ! α N b b exp( − α b ) N b ! = α a N a α b N b exp( − α a − α b ) N a ! N b ! (1) with exp ectation v alues α a = λ a T and α b = λ b T , where T is the match duration. In practice the λ are not constant. V ariation of λ during a match would not b y itself inv alidate the P oisson model as a mean lev el can b e used. The well-kno wn “home team adv an tage” implies that λ is lik ely to dep end on where the match is pla yed [3, 10]. This is sometimes accommodated b y analysing separately the score at home and a wa y matches. More difficult to handle is the fact that it migh t b e exp ected that for psychological or strategic reasons λ migh t depend on the num b er of goals already scored by either or b oth of the tw o teams. There is statistical evidence that this is indeed the case. In considering the distribution of goal scores at an aggregate lev el, it was noted from an early stage that there is an excess of high scores compared with a Poisson distribution. Maher [12] p oin ted out that the negativ e binomial distribution used b y Reep et al. [15] and, implicitly , b y Moroney [14] to provide a b etter description of the tail of the distribution can b e regarded as the w eighted sum of Poisson distributions with differen t means. Th us it is consisten t with the exp ected effect of including results obtained with differen t α in the aggregate. Greenhough et al. [7] found that the high score tails in some datasets could not b e mo delled by either Poisson or negative binomial distributions and w ere b etter describ ed by using extremal statistics. Bittner et al. [2] explain the excess in terms of a dep endance of α on the num b er of goals already scored – a dep endence that they ascrib e to ‘fo otball fever’ – a self affirmation in which goals encourage more goals. This effect appears to dominate ov er one in whic h a winning team either relaxes or plays a purely defensiv e game. It is ob viously a simplification to model eac h teams score indep endent of the other. Mo difying the simple univ ariate Poisson mo del of equation (1) to allow for a correlation b etw een the tw o scores leads to a biv ariate Poi sson distribution for ℘ ( N a , N b ). Maher [12] used a biv ariate Poisson mo del to correct the tendency of simpler models to underestimate the n umber of dra ws. Lee [11] has discussed such mo dels in the context of Australian rugby league scores and compared them with others. Cro wder et al [4] ha ve applied them to fo otball results, and Karlis and Ntzoufras [8] to b oth fo otball and water p olo. In some of their mo dels Bittner et al. [2] allo w for the correlation b y making the scoring rate depend on the n umber of goals scored b y b oth teams, p otentially in differen t wa ys. Karlis and Ntzoufras [9] dev elop ed an inflated biv ariate P oisson distribution to tak e accoun t sim ultaneously of b oth correlations and non-P oissonian tails. W e here consider the lev el of confidence that, given the statistical uncertain t y implied by mo dels such as those discussed ab ov e, one can ha ve in the outcome of a matc h. First (in Section 2) the simple mo del of Equation 1 is used. In Section 2.2 w e show that the conclusions are little changed by the use of more sophisticated mo dels. Section 3 examines the implications for a tournamen t in volving a series of matc hes. Journal of Applied Statistics 3 2. Lev el of confidence in the outcome of a match If a football matc h is a w ell designed exp eriment the winning team – that whic h has scored the greatest n umber of goals at the end of the matc h – will b e the one with a higher lev el of skill. By making certain simplifying assumptions the probability that the exp eriment giv es the wrong result for purely statistical reasons can b e quan tified. When considering the outcome of a single matc h, man y of the issues whic h complicate the analysis of aggregate scores can b e ignored. W e will put to one side issues of whether a team has lost its form, c hanged its manager or is at home or aw a y , and we will consider that the experiment has led to the correct result if the team that is stronger, on the day and in the particular circumstances of the matc h, wins. If it were p ossible to repla y a matc h many times in exactly the same circumstances then after a sufficient n umber of matches one team could ev entually be shown to b e sup erior to the other, with whatev er lev el of confidence w as required, but for some fraction of individual matches the score w ould imply a rev ersed ranking. W e do not in practice kno w α a , α b but after the match w e kno w the final score, ( N a , N b ). Given the n umber of goals scored by eac h team and assuming that each follo ws a Poisson distribution independent of the other, then equation 1 allows the probabilit y ℘ { ( N a , N b ) | ( α a , α b ) } to b e found as a function of α a , α b , but we are more concerned with ℘ { ( α a , α b ) | ( N a , N b ) } . Ba yes’ theorem allo ws us to write ℘ { ( α a , α b ) | ( N a , N b ) } = ℘ { ( N a , N b ) | ( α a , α b ) } ℘ { α a , α b } ℘ { N a , N b } (2) W e will initially assume no prior kno wledge ab out the strength of the teams. This means that, b efore the match, any com bination of α a , α b is equally likely , or in other words that the prior probability ℘ { α a , α b } is constant. F or a giv en result N a , N b , Equation 1 then also gives the relativ e probability ℘ { ( α a , α b ) | ( N a , N b ) } . In fact the ob jectiv e of the exp erimen t is only to kno w whic h team is sup erior, that is to say whether α a > α b or α a < α b . The conv ention in fo otball and most games is the Ba y esian one – one adopts the solution that has the highest probabilit y of pro ducing the observ ed result. In the absence of prior information, the case that is most lik ely to lead to the result ( N a , N b ) is α a = N a , α b = N b , so if N a > N b then we deduce that α a > α b and we declare team A to be sup erior. But a range of solutions surrounding the b est one is also allo w ed. T o find the probability w that the result do es not correctly reflect the abilities of the teams, w e need to integrate o ver the relev an t part of α a , α b space. F or N a < N b w ( N a , N b ) = ℘ { ( α a > α b ) | ( N a , N b ) } = Z ∞ 0 Z ∞ α b ℘ { ( N a , N b ) | ( α a , α b ) } dα a dα b (3) 2.1. If two unknown univariate Poisson te ams play e ach other... Supp ose w e ha ve an y mo del that giv es a probabilit y of differen t scores as a function of a pair of exp ectation v alues α a , α b (or of some other parameters characterising the tw o teams). F or a given final score, we can no w ev aluate the probability that the matc h (exp eriment) ga ve a correct or a misleading result. Figure 1 giv es results using the simple univ ariate P oisson mo del of Equation 1. It can be see that the probabilit y of a false result is considerable unless the goal difference is very high. 4 G. K. Skinner and G. H. F r e eman F or differences less than 3–4 goals the result lacks the 90% confidence whic h within quan titative disciplines is frequently considered a minimum acceptable lev el of confidence in the outcome of an exp eriment. The ma jority of final scores that o ccur in top quality fo otball fail to reach ev en ‘1-sigma’ confidence. Figure 1. The probability W that a particular result N a , N b does not correctly represent the relative abilities of the tw o teams. Calculated with flat prior probability functions. The probabilities are meaningful only for integer num bers of goals, but interpolated contours are shown to define zones in the plot corresp onding to W < 10% (con tinuous lines) and to W < 32% (corresponding approximately to a 1 σ result). The dotted line encloses 50% of the results in FIF A world cup matc hes 2.2. Mor e c omplex mo dels As has already b een discussed, the use of univ ariate Poisson distributions for the t wo teams is an approximation. W e use here as an example the final scores during the FIF A w orld cup series 1938-2006 (after extra time where applicable, but without p enalt y sho ot-outs). The distribution of n umber of goals scored is sho wn in Figure 2. There is an excess of high scores compared with a P oisson distribution having the same mean (b), as seen b y man y authors in other datasets. A b etter fit is pro vided b y a negativ e binomial distribution (c) with parameters adjusted to maximise the lik eliho o d, though there are still indications of a slight excess of high scores. Re- ev aluating the data shown in Figure 1 with the negative binomial fit c hanges the v alues v ery little. Strictly , the inclusion of results after extra time must hav e some effect. F or ex- ample, the scores will not be Poissonian if a decision to prolong the matc h dep ends on the score. Th us some s mall part of the “supra-P oissonian” v ariance must be due to including data from extended duration matches. The effect of extra time in those matc hes where extra time was play ed is to reduce the fraction of drawn matc hes from ab out 25% to 12.3%. How ev er, the impact on the data in Figure 2 Journal of Applied Statistics 5 0.1 1 10 100 1000 0 2 4 6 8 10 12 Goals Occurances / Weight (a) (b) (c) (d) Figure 2. (a) The distribution of the num b er of goals p er match scored b y teams in the FIF A world cup 1938-2006. (b) A Poisson distribution with the same mean (1.43). (c) A negative binomial fit. (d) The distribution of the exp ectation v alues of Poisson distributions whic h would hav e to b e combined to produce (c) (normalised to a maximum of 100). of using results after normal time rather than after extra time is to shift the p oin ts only by less than the size of the sym b ols. More imp ortantly , the as sumption of a uniform prior is ob viously inv alid – we kno w that there are no teams around that regularly score thousands of goals p er matc h! The distribution of α m ust actually b e rather narrow, otherwise analyses of large databases w ould not find ev en appro ximately a Poisson score distribution. If w e use narro wer prior probabilit y distributions for ℘ { α a } , ℘ { α b } (keeping them the same for A and B , b ecause we w ant to start the exp erimen t with no presumption ab out the outcome) the significance which should b e attached to the outcome of a matc h will be further reduced. The exp erimen t is trying to differentiate b et ween t wo teams already known to b e close in ability . The negativ e binomial distribution can be expressed as a w eighted mixture of P oissonian ones : f ( n ) = Γ( r + n ) n !Γ( r ) p r (1 − p ) k = Z ∞ 0 P oisson ( n | α ) Gamma ( α | r, (1 − p ) /p ) dα (4) Figure 2(d) shows the Gamma distribution describing the decomp osition of (c) into P oissonians with differen t exp ectation v alues. This can b e interpreted as sho wing the in trinsic range of α v alues. Using a prior of this form increases the probabilit y w of a misleading result, as seen by comparing Figure 3 with Figu re 1. If some of the high score tail is due to ‘goal fever’ or other effects suc h as the general do wnw ard drift in mean scores ov er the 58 years cov ered by the data, then the spread in α will b e ev en narrow er. Thus t wo teams pla ying eac h other are likely to b e ev en closer in ability and the matc h outcome even more uncertain. W e hav e considered the p ossibility of using biv ariate distributions, but for this dataset there app ears to b e no correlation betw een the scores of the t w o teams and 6 G. K. Skinner and G. H. F r e eman Figure 3. As figure 1 but with a prior probabilities following the form of curve (d) in Figure 2 so there is no reason to do so. 3. The situati on for a tournament T ournaments are sometimes organised suc h that the fate of a team do es not de- p end on a single match but that they hav e the p ossibility of comp ensating a bad result b y other goo d ones. In this w a y , b y p erforming m ultiple exp erimen ts, the statistical significance of the outcome can b e increased. On the other hand it is frequen tly the case that the ev entual winner has to pass through many eliminating rounds, increasing the probabilit y of error. Some studies of tournamen t design ha ve considered the effects of the unreliabilit y of the result of a single matc h and how to maximise the probabilit y that the best team/play er go es forw ard to the next round or wins. Most w ork of this sort has assumed that Gaussian noise is in tro duced into a comparison process, often in the context of tournamen ts (suc h as Wim bledon) where a ranking or seeding of the comp etitors is used in selecting pairings ( e.g. [1, 6]). In so ccer, as we ha ve seen, the statistics are close to Poissonian and in the FIF A W orld Cup used an example here, in recen t series for the first round of the final comp etition teams hav e b een group ed into “little leagues” of 4 teams using some degree of seeding but in combination with a random draw. Multi-matc h tournaments offer an opportunity for v erifying some of the ideas discussed here. Often all com binations of group of teams pla y eac h other. If the result of each matc h provided a v alid comparison of the relativ e abilities of the t wo teams, the situation that A b eats B b eats C b eats A should never arise. W e refer to this as an intransitiv e triplet. Note that up to this p oin t it has only b een assumed that the relativ e abilit y of t wo teams at a particular time and in particular circumstances is to b e tested. W e now hav e to imagine that a teams abilit y do es Journal of Applied Statistics 7 not change and that there is a real sense in which one team ma y be superior to another. But ev en in the absence of c hanges, an anomalous com bination of results can arise. If the true ranking is A > B > C but the outcomes of eac h of the 3 matc hes has probabilit y w of not corresp onding to that ranking, then there is a probabilit y w (1 − w ) that an intransitiv e triplet will result. The FIF A w orld cup results provide a database which includes 355 examples of triplets. Of the 147 whic h do not in volv e a drawn matc h, 17 (12%) are intransitiv e. This seems comparativ ely low, but w e note that even if the match outcomes were en tirely random the fraction exp ected w ould only b e 25%. An appro ximate esti- mate of the n umber which migh t b e exp ected can b e obtained b y noting that the scorelines of the non-drawn matc hes in this database hav e uncertain ties a veraging w =20.0% (here and in the discussion whic h follows, v alues from Figure 1 ha ve b een used as they are the most optimistic). This corresp onds to w (1 − w ) = 16% or 23.5 ± 4.8 intransitiv e triplets exp ected, reasonably consisten t with the 17 seen. While multiple com binations of teams playing eac h other can reduce the uncer- tain ty in the outcome, lik e many other competitions the final stages of recent FIF A w orld cup series in volv e a kno c kout. 16 teams are reduced to 1 in 4 stages. Ev en if the b est team reaches the 16, if it is to gain the cup it must a void a false result in all 4 of its last games. As dra ws are resolved b y a p enalty shootout, which ma y b e treated as nearly random, the appropriate mean v alue of w is that including dra ws, whic h is not 20%, but 27% † . The b est team has only a probabilit y of ab out 28% of winning the cup, even it reaches the last 16. F or the actual match scores whic h led Italy through its last 4 matc hes to the 2006 cup the corresp onding v alue comes to 30%. 4. Conclusions It is apparen t from Figures 1 and 3 that the scores whic h most frequen tly arise corresp ond to relatively high probabilities of a misleading outcome. In the recen t FIF A W orld Cup only 5 matc hes among 64 had scores corresponding to better than 90% confidence in the result and one third had results whic h should b e classified as ‘ < 1 σ ’. Ev en on v ery optimistic assumptions there is less than one c hance in three that it was the b est team that w on the cup. The possibility of increasing the size of football (so ccer) goal mouths to mak e the game more interesting has b een discussed and an attempt has been made to use somewhat dubious simple dynamics to quan tify the lik ely effect of a specific change in goal size on the n umber of goals scored [13]. The presen t analysis cannot be used to estimate by ho w muc h the mean score would hav e to b e increased to achiev e a giv en lev el of confidence in the result without considering the likely difference in the level of skills of the tw o teams. In principle one could imagine contin uing the matc h with successive p erio ds of extra time un til the goal difference becomes large enough to yield a c hosen level of confidence. Such op en ended matc hes would not b e p opular with those planning television cov erage (though the undefined duration of tennis matc hes is reluctantly accommodated). In either case is clear that the c haracter of the game would b e en tirely changed. The sp ortswriter Grantland Rice once wrote [16] † W e note that in a tournament w may not b e constant, but may increase in later stages as teams b ecome more equally matched. F or simplicity we adopt a mean v alue. 8 REFERENCES “When the One Great Scorer comes to mark b eside y our name, He marks – not that you w on nor lost – but how y ou play ed the game.” P erhaps its just as w ell, for in so ccer the one bears little relationship to the other. References [1] Adler et al., Sele ction in the pr esenc e of noise: The design of playoff systems , in SODA: ACM- SIAM Symp osium on Discrete A lgorithms (A Confer enc e on Theor etic al and Exp erimental Analysis of Discr ete Algorithms) , So ciety for Industrial and Applied Mathematics (1994), p. 564. [2] E. Bittner et al., Self-affirmation mo del for fo otb al l goal distributions , Europhysics Letters 78 (2007), pp. 58002p1–p5. [3] S.R. Clarke and J.M. Norman, Home gr ound advantage of individual clubs in English so c cer , The Statistician 44 (1995), pp. 509–521. [4] M. Crowder et al., Dynamic mo del ling and pr e diction of English fo otball le ague matches for betting , The Statistician 51 (2002), p. 157. [5] M. Dixon and M.E. Robinson, A birth pr o c ess model for asso ciation fo otb al l matches , The Statistician 47 (1998), p. 523. [6] M.E. Glic kman, Bayesian lo cally optimal design of knockout tournaments , Journal of Statistical Plan- ning and Inference (2008), to b e published. [7] J. Greenhough et al., F o otb al l go al distributions and extr emal statistics , Ph ysica A 316 (2002), pp. 615–624. [8] D. Karlis and I. Ntzoufras, A nalysis of sports data by using bivariate Poisson models , The Statistician 52 (2003), p. 381. [9] ———, Bivariate posson and diagonal inflate d bivariate Poisson mo dels in R , Journal Statistical Softw are 14 (2005), p. 1. [10] A.J. Lee, Mo del ling sc or es in the pr emier le ague : Is Manchester Unite d r eally the b est? , Chance 10 (1997), pp. 15–19. [11] ———, Modelling rugby le ague data via bivariate ne gative binomial r e gression , Australian and New Zealand Journal of Statistics 41 (1999), pp. 141–153. [12] M. Maher, Mo del ling asso ciation fo otb al l scor es , Statistica Neerlandica 36 (1982), pp. 109–118. [13] J. Mira, A naive appr oximation to the effe ct of goal size on the number of go als , arXiv.org: physics 0607183 (2006), pp. 1–4. [14] M.J. Moroney , F acts fr om figures , chap. 3, Penguin b o oks, London (1956), pp. 101–102. [15] C. Reep, R. P ollard, and B. Benjamin, Skil l and chanc e in b al l games , J. Roy . Stat. Soc. A 134 (1971), pp. 623–629. [16] G. Rice, Alumnus fo o tb al l , in Only the Br ave and Other Po ems , Barnes and company , New Y ork (1941), p. 144.
Original Paper
Loading high-quality paper...
Comments & Academic Discussion
Loading comments...
Leave a Comment