Characterizing User Mobility in Second Life
In this work we present a measurement study of user mobility in Second Life. We first discuss different techniques to collect user traces and then focus on results obtained using a crawler that we built. Tempted by the question whether our methodolog…
Authors: Chi-Anh La, Pietro Michiardi
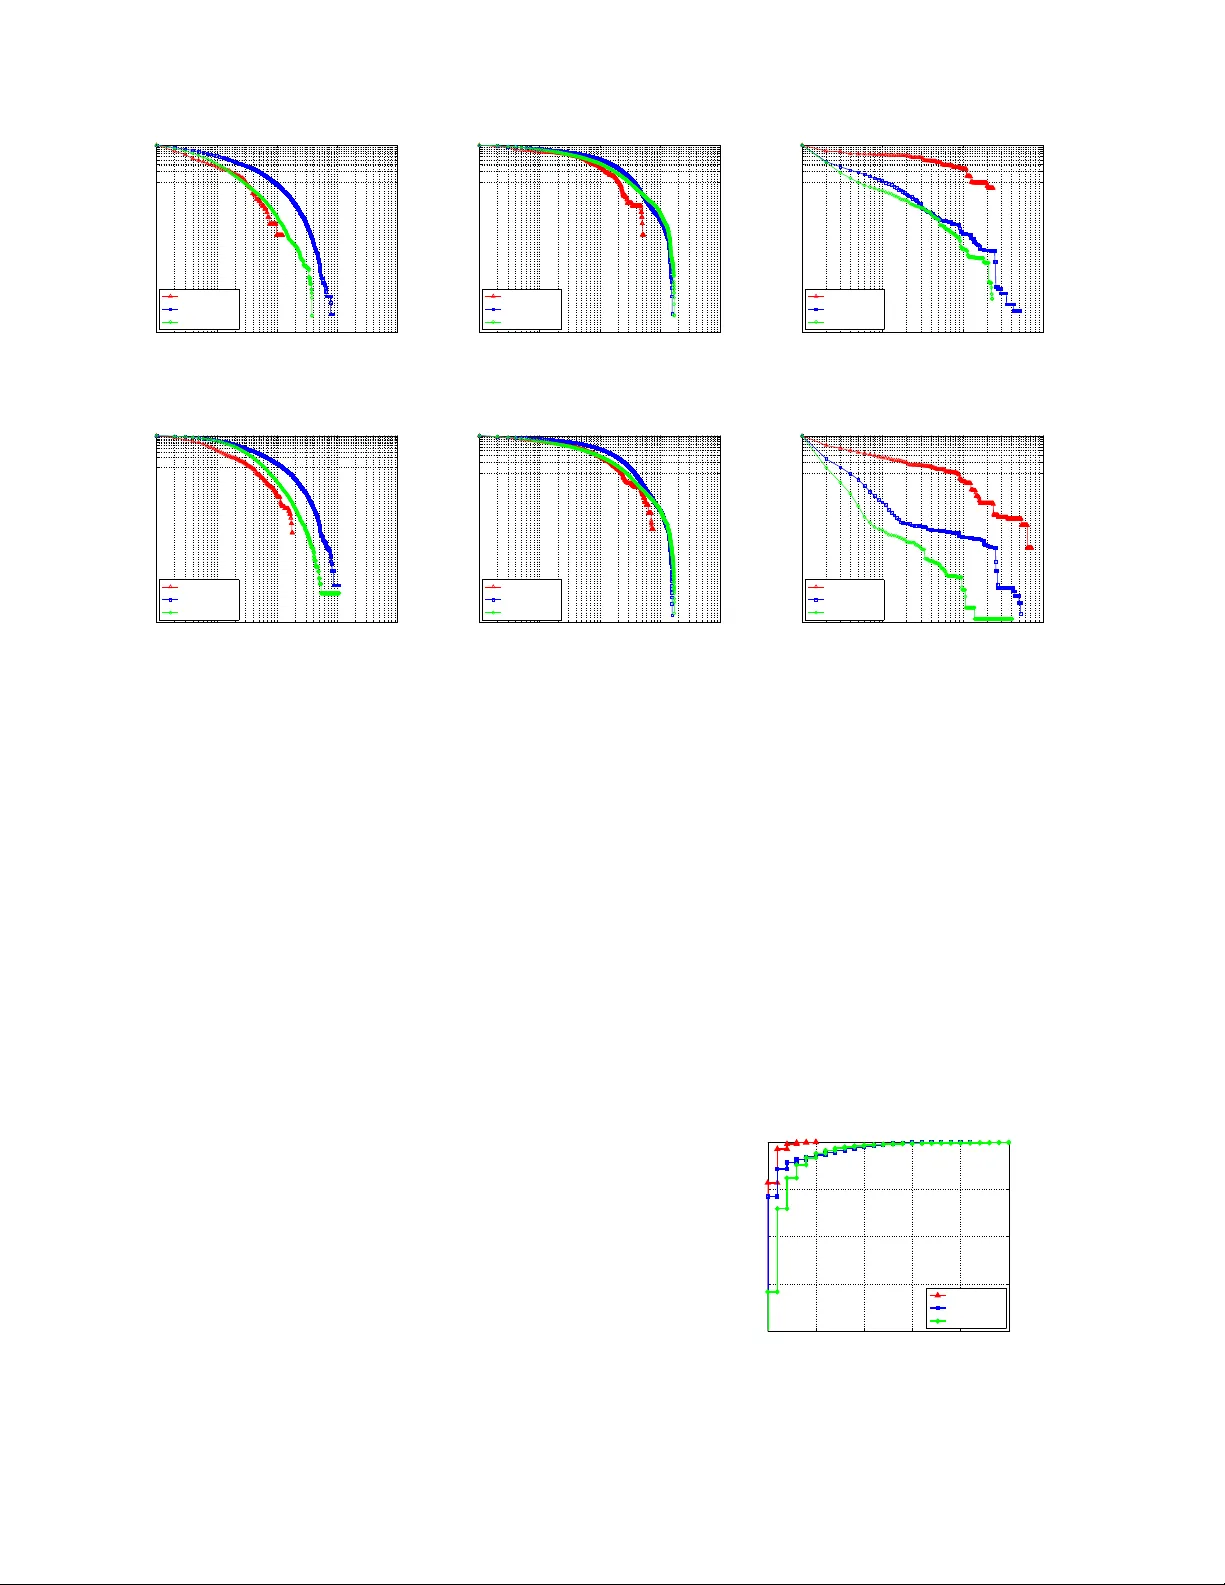
Characterizing User Mobility in Second Life Chi-Anh La Institut Eurecom 2229, route des Cretes 06560 Sophia Antipol is, F rance La@eure com.fr Pietro Michiardi Institut Eurecom 2229, route des Cretes 06560 Sophia Antipol is, F rance Pietro .Michiardi@eu recom.fr ABSTRA CT In this work we present a measureme nt study of user mobil- ity in Second Life. W e first discuss dif ferent techniques to collect user traces and then focus on results obtained using a cr aw ler that we built. T empted by the question whether our methodo logy could provide similar results to those obtained in real-world experim ents, we study the statistical distribu- tion o f user conta cts and show that from a qualitati ve p oint of v iew user mobility in Second Life pr esents similar traits to th ose of re al human s. W e further pu sh our ana lysis to line of sigh t networks that emerge from user interaction and show that th ey are h ighly cluster ed. Lastly , we focus on the spatial properties of user movements and ob serve that users in Second Life re volve around se vera l point of interests trav- eling in general short d istances. Besides our findings, the traces co llected in this work can be very usefu l for trace- driven simulation s of comm unication schemes in delay to l- erant networks and their perform ance e valuation. Categories and Subject Descriptors C2.1 [ Computer-communication N et w orks ]: Net- work Arc hitectur e and Design; J.4 [ Computer Appli- cations ]: So cial and Behavioral Science General T erms Measurement, Human F a ctors Keyw ords Contact times, Spatial Distr ibutio n, Line of sight net- works 1. INTR ODUCTION This work is motiv ated by prior studies on h uman mo- bilit y pe r formed in real life. F or example, [4–6] conduct several experiments mainly in confined ar e as and study analytical models of human mobility with the goal of assessing the per formance of message forwarding in De- lay T o lerant Netw orks (DTNs). Each user taking par t in suc h experiments is equipp ed with a wireless device (for example a sensor device, a mobile phone, ...) run- ning a custom softw are that r ecords temp or al informa- tion abo ut their contacts. Individual measurements are collected, combined and par sed to obtain the tempor al distribution of contact times. In this pap er we pres ent a nov e l metho dolog y to cap- ture spa tio-temp oral dynamics of user mo bilit y that ov e r comes most of the limitatio ns o f pr e vious attempts: it is cheap, it r equires no logistic o r ganizatio n, it is not b o und to a sp ecific wireless technology and ca n po tent ially scale up to a very large n um ber of pa r tici- pants. Our measur e men t approach exploits the tremen- dous raise in p opular ity o f Netw orked Virtual Envi- ronments (NVEs), wherein thousands of users connect daily to interact, play , do business and follow university courses just to name a few p otential applica tions. Here we fo cus on the Seco ndLife (SL) “meta verse” [3] which has r ecently gained momentum in the on- line commu- nit y . Our primary go a l is to p erform a temp ora l, spatial and top olo gical analysis of use r in teraction in SL. Prior works that attempted the difficult task of mea suring and collecting tr a ces of human mobility and contact o p- po rtunities are restricted by logistic constra ints (n um- ber of participants to the exp er iment s, dur ation of the exp eriments, failures of ha rdware device s , wir eless tech- nology used). In genera l, po sition information of mobile users is not av a ilable, th us a spatial analysis is difficult to achiev e [5 ]. Some exp eriments with GPS-enabled devices ha ve b een done in the past [7, 8], but these e x- per iments are limited to outdo or environments. In this pap er we discuss t w o monitor ing architectures that we tested and fo cus on the most robust technique, which is based on a custom soft ware mo dule (termed a cr aw ler ). Our cra wler co nnects t o SL and extra cts po sition informa tion of a ll users co ncurrently co nnected to a sub-space of the metaverse: a ll results presented in this pap er hav e been obtained with this architecture. One striking evidence of our r esults is that they qual- itatively fit to real life da ta, raising the legitimate q ues- tion whether measurements taken in a vir tual environ- men t present similar tr aits to those taken in a r eal set- ting. Our metho dology allows p erfo r ming large exp er- imen ts at a very low co st and generate data that can 1 be used for tra ce-driven simulations of a lar g e v ariety of applications: the study of epidemics and infor mation diffusion in wir eless netw or ks are just some prominent examples. 2. MONITORING ARCHI TECTURES Mining data in a NVE ca n be approached under dif- ferent angle s. The first architecture we disc uss exploits SL and its fea tur es to cre ate ob jects ca pable of sens- ing user activities in the metav er se. How ever, there are several limitations intrinsic to this approach that hin- der our ultimate go a l, which is to collect a la rge data set o f user mobility patterns. These limitations mostly come fro m inner design choices made by the develop ers of SL to protect from exter nal attackers a iming at dis- rupting the system oper ation. The limitations incurred by the first appro ach can be cir c um ven ted by building a cr aw ler that connects to SL as a normal user. The task of monitoring user activity in the whole SL metav er se is very complex: in this w ork w e fo cus on measuremen ts made on a selected subspa ce of SL, that is called a land (or island). In the following we use the ter minology tar get land to indicate the land we wish to monitor. Lands in SL can b e priv ate, public o r conceived as sa ndboxes a nd different restrictio ns a pply: for example priv a te lands for bid the creation and the deploymen t of ob jects without prior authorizatio n. W e now detail the monitoring architectures we inv es- tigated in o ur w ork. A se nsor net w ork arc hitecture 1 : Our fir st approa ch has b een inspir ed by current research in the area of wir e- less sensor networks: it resembles to what o ne would do in the real w orld t o measure ph ysical data (tempera- ture, mov ement s, etc ...) b y deploying sensor devices in the area to b e mo nitored. W e built virtual sensors using the standard ob ject cr eation to ol a ccessible from a SL clien t softw a re. O ur sensors collect data and com- m unicate with an e x ternal w eb server tha t sto res the lo cation infor mation of users connected to the target land. The functionalit y of a sensor is defined using a proprietar y scripting language [2]. A key limitation imp osed b y the infrastructure of SL is that sensors cannot be a rbitrarily deplo y ed on an y land. W hile it is imp ossible to deploy o b jects on priv ate lands without author iz ation, ob jects on public la nds ex- pire after a pre dic ted lifetime, which is land dep endent. T o deal with the res tricted ob ject lifetime, our s y stem replicates all sensors in the same position at regular time interv als . When a senso r is deploy ed on the target land, it de- tects users (a ma x imu m of 16 users can be detected at the s ame time) that a re within the sensing range (96 meters) with a tunable perio dicit y a nd s to res this infor- 1 This approach has b een used also in [9]. mation in its lo c a l ca che (16KB is the maximum stora ge space). Due to its limited memory , a sensor initiates a connection with our w eb server and flushes its mem- ory using the HTTP proto c ol a s so on as the maximal capacity has b een rea ched. The technical sp ecifica tion of a senso r imp oses several challenges that hinder the task of co v ering an entire land. Moreov er, the nu m- ber of HTTP mes sages that can be exchanged betw een sensors and the w eb serv er is restricted by the SL in- frastructure: this limits the q ua nt it y o f data t hat can be r etrieved fr o m our sensors, hence a tradeoff exists betw een the granularit y of the sensed da ta and the du- ration of a mo nitoring exp e riment. Monitoring using an external cra wler: An alter - native approach is to build a cus to m SL client soft- ware (termed a cr aw ler ) using lib secon dlife [1 ]. The crawler is a ble t o monitor the position of ev ery user using a sp ecific feature o f libs econd life that enables the cr e ation of simple maps of the target land. Measure- men t data is stored in a database that can be queried through a n interactive web application 2 . The crawler connects to the SL metaverse as a normal user, th us it is not confined by limitations imp osed by pr iv ate lands: any accessible land can b e monitored in its total- it y; the maximum n um ber o f user s that can be track ed is b ounded only b y the SL arc hitecture (as of to day , roughly concurr ent 10 0 users per land); communication betw een the cr awler and the database is not limited b y SL. During our exp eriments, w e noted that in tro ducing measurement pr ob es in a NVE can cause unexpected effects tha t per turb the normal b ehavior of users and hence the measured user mobility patterns . Since our crawler is no thing but a stripp ed-down version of t he legacy SL client and requires a v alid lo gin/password to connect to the metaverse, it is p erceived in the SL space as an a v atar, and a s such may a ttract the atten tion of other user s that try to interact with it: our initial expe r - imen ts show ed a steady conv er gence o f user movemen ts tow ar ds our crawler. T o mitigate this p erturbing effect we designed a crawler that mimics the behavior of a normal user: our cr awler randomly mo v es over the tar- get land and broadcasts chat messages chosen fro m a small set of pr e-definied phrases. 3. MEASURE MENT METHODOLOG Y Using the physical co ordinates o f users co nnected to a target land, we create snapshots of line of sight c om- munic ation n etworks : giv en an a rbitrary communica- tion r ange r , a communication link exists tw o us e r s v i , v j if their distance is less than r . In the following we us e a temp ora l sequence of netw o rks extracted from the traces we collected using our cr aw ler and ana lyze 2 Access to the application can be requested via mail to the authors. 2 contact o pp ortunities b etw een users, their spatial dis- tribution and g raph-theor e tic pro p er ties of their com- m unication netw ork. A precondition for b eing able to gather useful data is to sele c t an appr opriate targe t land and meas urement parameters . Cho osing an a ppropria te targe t land in the SL metaverse is not an ea sy task b eca use a large num- ber of lands host very few users and lands with a large po pulation are usually built to distr ibute virtual money: all a user has to do is to sit and wait for a long enough time to earn mone y ( for free). In this w or k, we man- ually selected and analyzed the follo wing lands: A pfel L and , a g erman-sp eak ing ar e na for newbies; Danc e Is- land , a virtual disc o theque; Isle of V iew , a land in which an even t (St. V a lentines) was org anized. These lands hav e b een chosen as they are represe n tative of out-do or (Apfel Land) and in-do o r (Dance Island) en vironments; the third land re pr esents an example of SL even ts which suppo sedly attract many users. In this pap er we pr esent results for 2 4 hours tra c e s: while the ana lysis of longer traces y ields analo gous results to those presented here, long exp er iment s are sometimes a ffected by instabilities of lib second life under a Linux e nvironment and we decided to focus on a set of shorter but stable mea sure- men ts. A summary of the trace s w e ana lyzed can be defined bas ed o n the total num b er of unique users and the av erage num ber of concurrently logged in users: Isle of View had 2656 unique visitors with an av er age of 65 concurrent users, Dance Island had 334 7 unique user s and 34 concurrent users in a v erage and Apfel Land ha d 1568 users and 13 concurrent users in average. W e launc hed the crawler on the selected target lands and set the time g r anularit y (in terv als at which we take a snapshot of the use rs’ p os ition) to τ = 10 sec. W e se- lected a communication range r to simulate users equipped a blueto oth and a WiFi (802.11a at 54 Mbps) d evice, resp ectively r b = 10 meters and r w = 80 meters. In this work we as sume an ide al wir eless channel : line o f sig ht net works extracted from our traces negle c t the pr esence of obstacle s such as buildings and tree s . User lo ca tion in SL is expressed by her coordina tes { x, y , z } which are relative to the target land whose size is by default 256 · 256 meters. How ever there is one exception: when a user sits on an o b ject (e.g . a b ench) her co ordinates are { x = 0 , y = 0 , z = 0 } . In the target lands we selected users did not sit. 3.1 T emporal analysis The metrics we use to analy z e mobilit y patterns a re inspired by the work of Chaintreau et. al. [4] a nd al- low the analys is of the statistical distribution of co nt act opp ortunities b etw een users: • Contact time ( C T ) : is defined a s the time interv a l in which tw o user s ( v i , v j ) ar e in direct co mmu ni- cation range, given r ; • Inter-c ontact time ( I C T ): is defined a s the time int erv al which elapses b etw een t w o contact p erio ds of a pair o f user s. Let [ t 1 ( v i ,v j ) s , t 1 ( v i ,v j ) e ] , [ t 2 ( v i ,v j j ) s , t 2 ( v i ,v j ) e ] , ... [ t n ( v i ,v j ) s , t n ( v i ,v j ) e ] be the suc c essive time interv als at which a co n tact betw een user v i and v j o ccurs; then, the inter- contact time betw een the k − th and the ( k + 1) − th contact interv als is: I C T k ( v i ,v j ) = t k +1 ( v i ,v j ) s − t k ( v i ,v j ) e • First c ontact time ( F T ): is defined as the wait- ing time for a user v i to con tact her first neighbor (ever). 3.2 Spatial analysis W e present here the metrics w e used to p erform the spatial analys is of o ur traces: • No de de gr e e: is defined a s the num b er of neigh- bo rs of a user when the comm unica tio n r ange is fixed to r ; • Network diameter: is computed a s the longes t shortest pa th of the lar gest connected compo nent of the communication netw ork formed b y the us e r s. W e used the lar gest component since, for a g iven r , the net w ork might b e disconnected; • Clustering c o efficient: is defined a s in [10]: we compute it for every user and take the mean v alue to be representativ e of the whole communication net work; • T r avel length: for every user v i we co mpute the distance co vered from its login to its lo g out coor - dinates in SL; • Effe ctive T r avel t ime: for every user v i we com- pute the to tal time sp ent while moving; hence, this metric do es not include p ause times; • T r avel time: for ev ery user v i we compute the total co nnection time to the SL land we monitor with the crawler; • Zone o c cup ation: we divided lands in several square sub-cells of size LxL and co mputed the nu m be r of users in every sub-cell, when L = 2 0 meters. 4. RESUL T S W e now discuss the results o f our measurements for the three selected target lands a nd s tudy the influence of the communication range ( r b or r w ). T emp oral Analysis: Fig. 1 illustrates the distribution of the tempor al metrics we used in this work for r b = 10 3 10 1 10 2 10 3 10 4 10 5 0.1 0.5 1 Time (s) 1−F(x) Contact Time CCDF, r=10m Apfelland Dance Isle Of View (a) 10 1 10 2 10 3 10 4 10 5 0.1 0.5 1 Time (s) 1−F(x) Inter−Contact Time CCDF, r=10m Apfelland Dance Isle Of View (b) 10 1 10 2 10 3 10 4 0.1 0.5 1 Time (s) 1−F(x) First Contact Time CCDF, r=10m Apfelland Dance Isle Of View (c) 10 1 10 2 10 3 10 4 10 5 0.1 0.5 1 Time (s) 1−F(x) Contact Time CCDF, r=80m Apfelland Dance Isle Of View (d) 10 1 10 2 10 3 10 4 10 5 0.1 0.5 1 Time (s) 1−F(x) Inter−Contact Time CCDF, r=80m Apfelland Dance Isle Of View (e) 10 1 10 2 10 3 10 4 0.1 0.5 1 Time (s) 1−F(x) First Contact Time CCDF, r=80m Apfelland Dance Isle Of View (f ) Figure 1: T emp or al Analysis: Comple mentary CDF of con tact opportunit y metrics for three target lands. meters a nd r w = 80 meters. A g lance at the co mple- men tary CDF (CCDF) of the contact time C T indica tes that the me dian contact time is r oughly 3 0, 6 0 and 1 00 seconds respec tively f or Apfel Land, Isle of View and Dance Island when r = r b , and ab out 70, 200 and 300 seconds for the same set of islands when r = r w . Be- sides the in tuitive r esult whic h indicates large r transfer opp ortunities for larger r , we observe that the distri- bution of C T has t w o phases: a first power-la w pha se and an exp onential cut-off phase that limits the C T to a few hundreds seconds. Similar obs erv ations can be do ne for the CC DF of the int er contact time I C T : for the three target lands we analyzed, the distribution follows a firs t power-la w phase, followed by an exp onential cut-o ff phase. The median I C T is around 400 sec o nds for the t w o op en- space la nds and betw een 700 a nd 8 0 0 seconds for the Dance Island. Analyzing the same trace of user move- men t yields s urprisingly similar r e s ults with different communication r anges. W e believe this result is due to the fac t that users are concentrated around p oint of in- terests (as discussed b elow), but it w ould b e in teresting to compar e suc h findings with real- world exp eriments. Although the distribution of co ntact oppor tunities app ears to b e s imila r for the tw o o p en-space lands, the CCDF of the firs t contact time F T illustra tes some dif- ferences b etw een these lands: in Apfel Land use rs ha ve to wait for a lo ng time b efo r e meeting their firs t neig h- bo r. The media n F T is a r ound 3 00 seconds for Apfel Land, while it is less than 20 s econds for the o ther tw o lands when r = r b . The F T impr oves a lot when in- creasing r : the median is ar ound 30 s econds for Apfel Land and less than 5 seconds for the other lands. These res ults are quite surprising: from a qualitative po int of view, we obtained a statistical distribution o f contact o pp o r tunities that mimics wha t has be e n ob- tained fo r exp eriments in the rea l world [5, 7, 8]. Obvi- ously , h uman activity r oughly spans the 12 hours inter- v al, while e ven the most ass iduous user which we were able to track sp ent less than 4 consecutive hours on SL, hence a quantitativ e comparison is not immediate. 0 5 10 15 20 25 0.8 0.85 0.9 0.95 1 Number of users per cell F(x) Zone Occupation CDF, L=20m Apfelland Dance Isle Of View Figure 3 : Sp ati al distribution of users. 4 0 10 20 30 40 50 0 0.1 0.2 0.4 0.5 0.6 0.8 0.9 1 Degree 1−F(x) Node Degree CCDF, r=10m Apfelland Dance Isle Of View (a) 0 5 10 15 0 0.1 0.2 0.4 0.5 0.6 0.8 0.9 1 Diameter F(x) Network Diameter CDF, r=10m Apfelland Dance Isle Of View (b) 0 0.2 0.4 0.6 0.8 1 0 0.1 0.2 0.4 0.5 0.6 0.8 0.9 1 Coefficient F(x) Clustering Coefficient CDF, r=10m Apfelland Dance Isle Of View (c) 0 20 40 60 80 0 0.1 0.2 0.4 0.5 0.6 0.8 0.9 1 Degree 1−F(x) Node Degree CCDF, r=80m Apfelland Dance Isle Of View (d) 0 1 2 3 4 5 0 0.1 0.2 0.4 0.5 0.6 0.8 0.9 1 Diameter F(x) Network Diameter CDF, r=80m Apfelland Dance Isle Of View (e) 0 0.2 0.4 0.6 0.8 1 0 0.1 0.2 0.4 0.5 0.6 0.8 0.9 1 Coefficient F(x) Clustering Coefficient CDF, r=80m Apfelland Dance Isle Of View (f ) Figure 2: Line of sight networks: graph theoretic prop erties for three s elected target lands. Line of sight net w orks: W e n ow delve into a de- tailed analys is o f the commu nication net w orks that emerge from user interaction when we assume them to b e equipp ed with a wireless communication device covering a range r ∈ { r b , r w } . Fig. 2 illustrates the agg regated (o ver the whole measur ement p erio d) CCDF of the node degree, the aggr egated CDF of the netw ork diameter and clus- tering co efficient. The no de degree CCDF illustrates a diverse user b e- havior in each target land: for Apfel Land we obser ve that 6 0 % o f users ha v e no neig hbors, for the Dance Is- land only 1 0 % of users hav e no neig hbors while in the Isle of View, a ll use r s ha v e at least one neig hbor when r = r b . When the c ommunication range is set to r = r w all users have a t least one ne ig hbor in all lands. The maximum degree a nd the whole distribution v a ries a lot between targ et lands: the main reason lies in the ph ysical dis tr ibution of user s on a land. In Apfel L a nd users a re relatively sparse while in the Dance Island, for example, most of the users s pe nd mo s t of the time in a tin y p ortion of the land: this obse r v ation is corr ob o- rated 3 by our study on the spa tia l dis tribution of users as shown in Fig. 3. Although the gene r al trend for all target lands w e insp ected is that a large fra ction of the land has no users, some lands (e.g . Dance Island) ar e characterized b y hot-spo ts with several tens of users. 3 There is an intuitiv e reason for this phen omenon: in a dis- cotheque users spen d most of their time on the dance floor or by th e bar, while in an op en s pace users ar e generally located more sparsely . The C DF of the netw ork diameter illustrates the im- pact of differ ent transmission ra nges: it is clear that the diameter shrink s fo r r = r w . W e note, how ever, that for Apfel Land there is an a pparent contradiction: for r = r b the max im um diameter is s maller tha n for r = r w . This phenomeno n is due to the fact we com- pute the diameter of the larg e st connected comp onent of the temp oral graph formed by users : when the ra dio range is small (and us ers are s cattered thr ough the tar- get land) we observe the emergence of relatively small connected components, whereas for larg er ra nges the connected comp onent is la rge (even tually it includes a ll users), hence a la rger diameter. In Fig. 3 we also plot the CDF of the clustering co e f- ficient for the whole measurement perio d. Our results clearly point to high me dian v alues o f the clustering co efficient which indicate that the net w orks we obs erve are no t random gr aphs 4 : these net works are hig hly clus - tered but, due to the small n um ber of c oncurrent user s that can log in to a land and the r esults on the net- work diameter, w e cannot claim at this time that the graphs that emerge from user in teraction ha ve small world character is tics. T rip analysis: using ph ys ic al co o rdinates, w e were able to study the statistica l distribution of the distance trav elled b y users on the three target lands w e analyze in this pape r . Fig. 4 illustra tes the agg regate CDF of 4 Which are usu ally c haracterized by a very small clustering coefficient [10]. 5 0 500 1000 1500 2000 2500 0 0.1 0.2 0.4 0.5 0.6 0.8 0.9 1 Length (m) F(x) Travel Length CDF Apfelland Dance Isle Of View (a) 0 2000 4000 6000 8000 0 0.1 0.2 0.4 0.5 0.6 0.8 0.9 1 Time (s) F(x) Effective Travel Time CDF Apfelland Dance Isle Of View (b) 0 5000 10000 15000 20000 0 0.1 0.2 0.4 0.5 0.6 0.8 0.9 1 Time (s) F(x) Travel Time CDF Apfelland Dance Isle Of View (c) Figure 4: T rip analysis for three sel ected target lands the tr avel leng th, the tra vel time and the login time for all users. Fig. 4(c) sho ws the CDF o f the login time: in our measure ment we obse r ved that the longest log-in time for a user was around 4 ho ur s while 90% of users are logg ed in for less than 1 hour. Fig. 4(a) pro vides further hin ts tow ar ds a b etter un- derstanding o f user mo bilit y in the selected target lands. F or a confined area suc h as Dance Island, the v ast ma- jority of user s trav el less than 230 meters (90 th per- centile) . This o bserv atio n how ev er applies also for op en spaces: for Apf el Land, the 90 th p ercentile is around 400 meter s while it gr ows up to 500 meters for Isle of View. There is a small frac tion of us ers who t rav el a very lo ng distance: for the Isle of View, aro und 2% o f users tr av el mor e than 2000 meters. Fig. 4(b) is use- ful to infer the dis tr ibution of the times a user takes to trav el from her initial p oint (the first time our crawler track ed the user) to her final p o int (the last time the user has b een seen on the target land). 5. CONCLUSION AND FUTURE WORK In this pap er we discussed a no v el methodolog y to per form user profiling that exploits the ra ising popu- larity o f on-line communities emerg ing from user int er- action in Net w orked Virtual En v ironments. W e stud- ied the mo bilit y pa tterns of users connected to Second Life using a crawler that extracts at regular time in- terv als user p osition o n a target land. T empted by the question whether any similarity can be found be- t ween our results and measurements pe r formed in the real world, we first characterized the statistical distribu- tion of contact oppor tunities among users. O ur analysis indicated that mobility patterns in a virtual en vir o n- men t share common traits, from a qualitative point of view, with those in the rea l w orld. W e further pushed our analys is to characteriz e the spa tial distr ibution of users a nd their mobilit y behavior: users a re genera lly concentrated ar ound p oints of interest and tr av el small distances in the v ast ma jority of cases. Fina lly we char- acterized the graph theore tic prop erties of line o f sight net works emerging from user interaction and found re- sults indicating they a re highly clustered. Our measurements are publicly a v ailable and consti- tute a useful material for tra ce-driven simulations of a la rge v arie t y of a pplications: the study o f epidemics and informa tion diffusion in wireless net works, the per- formance analysis of forwarding schemes in DTNs, etc... Is mobility of users in SL r epr esentative of r e al human mobility? In our future w o r k we will tr y and addr ess this questio n from a qualitative point of view. In this pap er we have constr ucted a too l that he lps answering this k ey que s tion, but w e believe that further study in the specification of new metrics to define h uma n mo- bilit y are requir ed. Another interesting area of future resear ch would b e to build the net w ork of “ relation- ships” a mong SL users. Based on the “relation g raph”, new questio ns can be addres sed such as the freq ue nc y and the str e ngth of contact b etw een acquaintances. 6. REFERE NCES [1] Libsecondlife: www.libsecondlife.org/ . [2] Lsl: h ttp://wiki.secondlife.com/wik i/lsl po rtal. [3] Second life: ht tp://www.secondlife.co m. [4] A. Chaintreau, P . Hui, J. Cr ow cr oft, C. Diot, J. Scott, and R. Gas s . Impact of human mobilit y on opp ortunistic forwarding algorithms. IEEE T r ansactions on Mobile Computing , 2007 . [5] A. Chaintreau, A. Mtibaa, L. Massoulie, and C. Diot. The diameter o f oppor tunistic mobile net works. In Pr o c. of CoNEXT , 2007. [6] T. Karag iannis, J .-Y. L. Boudec, and M. V o jnovic ´ . Po wer law and exp onential decay of int er contact times betw een mobile devices. In Pr o c. of MOBICOM , 200 7. [7] J. Krumm and E . Horvitz. The micros oft m ultiper son lo cation survey . T echnical r ep ort, Microsoft Research, MSR-TR-2 005-1 3, 2 005. [8] I. Rhee, M. Shin, S. Hong, K. Lee, and S. Chong. On the levy-walk nature of human mobility . In 6 Pr o c. of IEEE INF OCOM , 2008. [9] M. V arvello, E. Biersack, a nd C. Diot. A net work ed vir tual environmen t ov er k a d. In Pr o c. of ACM CoNext , 2007. [10] D. J. W atts and S. Stroga tz. Co llective dyna mics of ’small-world’ netw orks. Natur e , 1 998. 7
Original Paper
Loading high-quality paper...
Comments & Academic Discussion
Loading comments...
Leave a Comment