Comment: Bayesian Checking of the Second Levels of Hierarchical Models
Comment: Bayesian Checking of the Second Levels of Hierarchical Models [arXiv:0802.0743]
Authors: Valen E. Johnson
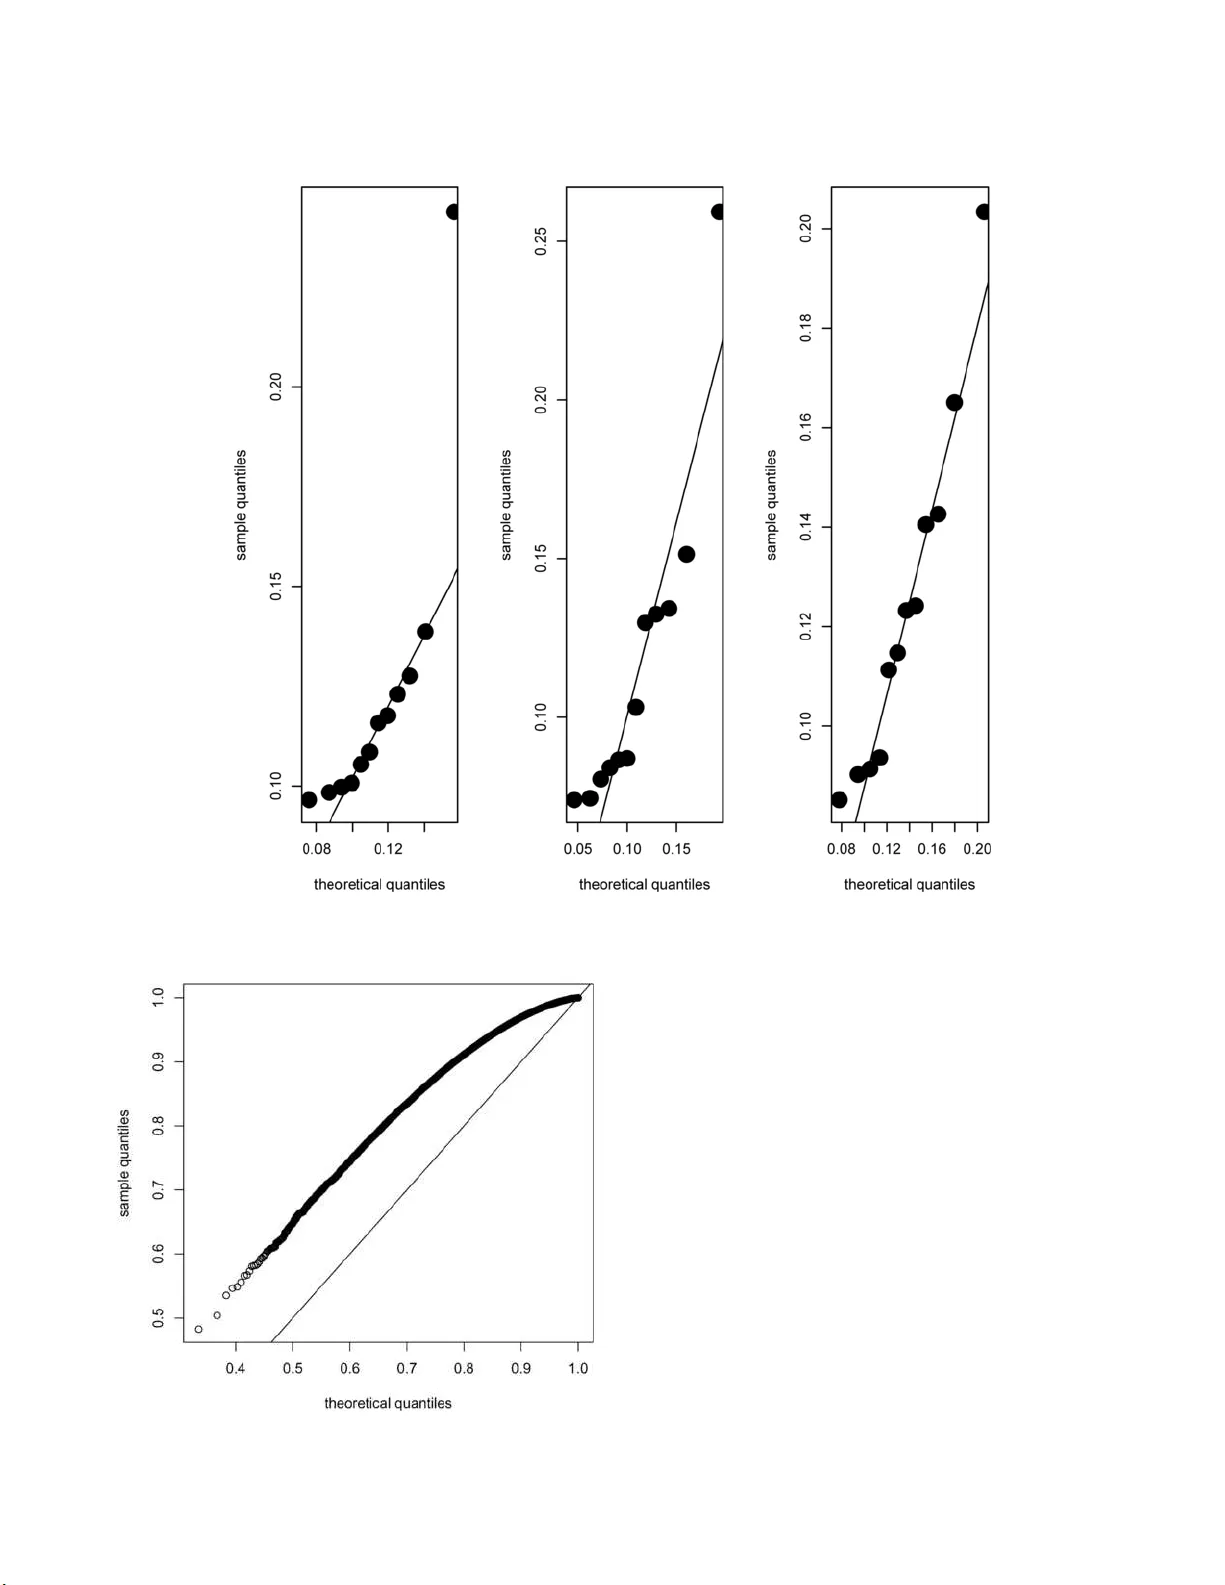
Statistic al Scienc e 2007, V ol. 22, No. 3, 353– 358 DOI: 10.1214 /07-STS235D Main article DO I: 10.1214/07-STS235 c Institute of Mathematical Statisti cs , 2007 Comment: Ba y esian Checki ng of the Second Levels of Hiera rchical Mo dels V alen E. Johnson This article extends Ba y arri and Berger’s ( 1999 ) prop osal for mo del ev aluation using “partial p os- terior” p v alues to the ev aluation of second-stage mo del assumptions in hierarc h ical mo dels. Applica- tions focus on normal-normal hierarc hical mo dels, although the fin al example inv olv es an app lication to a b eta-binomial mo del in whic h the distribu tion of the test statistic is assum ed to b e appro ximately normal. The n otion of using partial p osterior p v alues is p oten tially app ealing b ecause it a voids wh at the au- thors refer to as “double use” of the data, that is, use of the data for b oth fitting m o del parameters and ev aluating mo del fit. I n classical terms, this p he- nomenon is sy n on ymous to m asking and is widely kno wn to redu ce the p o we r of test statistics f or di- agnosing mo del inadequacy . In the pr esen t cont ext, masking is a voi ded b y defining the reference distri- bution of a test statistic t b y the partial p osterior distribution, defi n ed as π ( θ | x obs /t obs ) ∝ f ( x obs | θ ) π ( θ ) f ( t obs | θ ) . (1) Heuristically , the partial p osterior distribution con- tains information in the data x obs ab out mo del pa- rameter θ not reflecte d in t obs . F rom th is definition, it follo ws that the partial p osterior distribution and (full) p osterior distribution are equiv alen t when t is ancillary , and that the partial p osterior distribu- tion and prior distrib ution coincide when t is suffi- cien t. T he lat ter fact suggests that partial p osterior distributions defined with resp ect to improp er p rior densities ma y not b e prop er when the test statist ic V alen E. Johnson is Pr ofessor of Biostatistics, University of T ex as MD A nderson Canc er Center, 515 Holc omb e Blv d, Unit 447 Houston, T exas 77030-400 9, USA e-mail: ejohnson@mdanderson.o r g . This is an electr onic r eprint o f the original article published b y the Institute of Mathema tical Statistics in Statistic al Scienc e , 2007, V ol. 22, No. 3, 35 3–358 . This reprint differs fro m the origina l in pagination and t yp ogr aphic detail. is “approximate ly sufficient ” f or some subset of p a- rameter v alues. It also precludes the u se of partial p osterior mod el assessment for ob jectiv e Ba y esian mo dels using test statistic s that are sufficien t, al- though the authors pr esumably regard sufficien t test statistics as b eing useful only for assessing the ad- equacy of (p rop er) p rior distribu tions. Nonetheless, insigh t regarding the relativ e adv anta ges of the pro- p osed metho dology as test statistics v ary f r om b e- ing “nearly sufficien t” to “nearly ancillary” w ould b e us efu l. Under regularit y a ssum ptions sp ecified in Robins, v an der V aart and V en tu ra ( 2000 ), partial p osterior p v alues also ha ve the imp ortan t prop ert y of b eing asymptotically uniformly distrib uted u nder the n ull mo del. Prior-predictiv e p v alues and their extensions to p v alues based on pivota l quantitie s (describ ed b e- lo w ) share th is pr op ert y—eve n in finite samples. p v alues based on p osterior predictiv e and r elated ref- erence distributions do not, whic h makes it difficult to interpret these diagnostics for purp oses of formal mo del assessment. Ba y arri and Costellanos (B&C) pro vide con vincing examples that illustrate this dif - ficult y an d h ighligh t the dangers asso ciated with the naiv e use of n on uniform p v alues. Ho wev er, it should b e noted that the extreme p v alues r ep orted by the authors are p erhaps also somewhat sus p ect give n the relativ ely small sample sizes considered in the examples. Th at is, ev en ignoring errors associated with the n umerical appr o x im ation of th e partial p os- terior density and the resulting distribu tion of the test statistic, asymptotic u niformit y of the partial p osterior p v alues ma y not h a v e b een ac hieve d to the lev el of accuracy required for the rep ort of partial p osterior p v alues d o wn to the n u m b er of significant digits provided. This concern is h eigh tened b y the plots in the th ir d column of Figure 1 , whic h suggest that partial p osterior p v alues are antico nserv ativ e for mo derate sample sizes. The signifi can t adv an tage of partial p osterior p v alues—that of r educing masking—does not co me without cost, and t wo p oten tially difficult tasks m ust b e p erf ormed to construct these diagnostics. First, it 1 2 V. E. JOH NSON Fig. 1. Quantile-quantile plots of gr oup me an r esiduals. The top r ow dep icts the qq-plot obtaine d fr om thr e e p osterior dr aws fr om the mo del utilizing O ’ Hagan ’ s prior, while the b ottom r ow depicts qq-plots derive d fr om the thr e e dr aws fr om the p osterior define d using the trunc ate d ver sion of B&C ’ s im pr op er prior sp e ci fic ation. is necessary to estimate th e sampling density of the c h osen test s tatistic as a fun ction of the mod el pa- rameter θ . I n th e article , this ta sk is p erformed only for cases in whic h the sampling d ensit y of the test statistic can b e ea sily appr oximate d by exploiting a translation-in v ariance p r op erty of the n ormal distri- bution. Su c h a strategy is u n lik ely to w ork outside of n ormal family problems or for more sophisticated test statistics (e.g., the χ 2 discrepancy function ad- v o cated in Gelman, Meng and S tern, 1996 , or the Shapiro–Wilks test s tatistic illustrated b elo w ). Second, the partial p osterior distribu tion function of the test statistic m ust b e ev aluated at its ob- serv ed v alue. Because the partial p osterior distri- bution is p rop ortional to th e ratio of th e p osterior distribution based on the full data to the sampling distribution of the test statistic determined in the previous step, p erformin g n u merical simulatio ns to obtain th e v alue of th e p artial p osterior d istribution function at the observ ed test statistic is also lik ely to b e tr ou b lesome. Indeed, even for what are v ery simple hierarc hical mo dels, the authors felt obliged to pro vide app endices describing the MCMC algo- rithms used to p er f orm these calculations. P artial p osterior m etho ds also do n ot seem w ell- suited f or the construction of diagnostic plots. Grap h - ical d iagnostics—whic h are critical to mo del crit- icism and exploration—often in volv e the display of transformations of all d ata v alues, and thus are func- tions of a sufficient statistic. As noted ab o ve, this mak es th e use of p artial p osterior m etho ds inappro- priate for the construction of such plots and ma y limit the utilit y of this approac h in the exploratory stages of mo d el refinement. A fi nal p oint th at should b e considered in th e ap- plication of partial p osterior p v alues in v olv es the trade-off b etw een the cost of computing these diag- nostics v ersus the cost of fi tting expanded mo d els that ha ve b een target ed to detect a particular devi- ation fr om the null mo del. T he example in S ection 4 illustrates th is p oin t w ell. In that example, a normal- normal hierarc hical mo d el with a fixed sec ond-stage mean µ 0 is assumed. By conditioning on a test statis- tic th at represent s a comp onen t of the sufficient statistic that w ould b e used to estimate µ 0 (if its v alue w as not kno wn a pr iori), p artial p osterior mo d el diagnostics ov ercome the masking effect that plagues the other metho ds consid ered in the article. How- ev er, fi tting an expanded mo d el in whic h µ 0 w as regarded as rand om would b e sev eral orders of mag- nitude ea sier to implement. It w ould also pro vide a m uc h cle aner summary of the original mo del’s in - adequacy . Although this st ylized example w as only prop osed for purp oses of illustration, I sus p ect that similar commen ts might also apply to more elab o- rate mo dels. As it happ ens, many of the obstacles asso ciated with implemen ting p artial p osterior mo del diagnos- tics can b e o vercome by instead defining mo del d i- agnostics u sing piv otal quan tities. Lik e partial p os- terior mod el diagnostics, Ba ye sian mo d el d iagnos- tics b ased on piv otal quant ities also pro du ce test statistics that h av e a kn o wn reference distribution. The primary dr a wbac k of d iagnostics based on piv- otal quant ities is that the join t distribution of p iv- COMMENT 3 otal quan tities dra wn from the same p osterior dis- tribution m u s t b e ev aluated using pr ior-predictiv e metho dology . Ho wev er, in man y cases the reliance on prior-pred ictive assessmen t can b e circumv en ted through th e use of probabilistic b ounds on d istribu- tions of dep endent o rder statistics. The adv an tages of d iagnostics based on p iv otal quan tities stem fr om the fact that the d istr ibution of a pivo tal quan tit y , sa y S ( x, θ ), is the same whether it is ev aluated at the “true” (i.e., data-g enerating) v alue of the parameter or at a v alue of θ dra wn fr om the p osterior distribution (Joh n son, 2007 ). F ur ther- more, m an y piv otal test statistics are insens itive to the choice of end-stage prior d istr ibutions in hierar- c h ical mo d els, which make s their u se for d iagnostics in suc h settings straigh tforw ard. T o illustrate these diagnostics an d to demonstrate ho w they can b e used to complement information conta ined in partial p osterior p v alues, t wo of the examples considered in B&C are re-ev aluated b elo w usin g d iagnostics based on piv otal quan tities. The first example concerns the data and mo del tak en fr om O’Hagan ( 2003 ). F rom the normal-normal hierarc hical structure of this mo del, it follo ws that the comp onents of the pivot al v ectors ǫ j = y ij − θ i σ i and E = θ i − µ τ (2) are marginally distribu ted as indep en d en t, standard normal deviates when ev aluated at parameter v alues dra wn from the p osterior distribution, p r o vided only that prop er prior distributions are assumed for the h yp erparameters ( µ, τ ). Tw o end-stage p riors were assum ed for the hyper- parameters ( µ, τ ) in B&G, one an improp er prior and the seco nd the in formativ e p rior pr op osed by O’Hagan. T o replicate find ings for the improp er pri- ors, I assume a priori that µ ∼ U ( − a, a ) , π ( σ 2 ) ∝ 1 σ 2 I (1 /a, a ) and π ( τ 2 ) ∝ 1 τ I (1 /a, a ) , indep en d en tly for a sufficien tly large v alue of a . Al- though the effect of the v alue of a (or, more gener- ally , the limiting p ro cess used to obtain an imp rop er prior sp ecification) on prior-pred ictive assessmen t of the j oint distribution of piv otal qu an tities is a topic of ac tiv e researc h, the marginal distr ibution of piv- otal quan tities obtained for a fi xed data v ector is generally insensitiv e to this c hoice. Quant ile-quan tile plots of three v alues of E for p osterior dra w s of ( µ, τ ) u nder the prop er and im- prop er prior sp ecifications app ear in Figure 1 . A vi- sual examination of these plots clearly suggests that the fifth group mean is pr oblematic. In p r actice, the evidence p ro vided by th ese p lots—wh ic h are t ypical of plots obtained for arbitrary dra ws of ( µ, τ ) fr om the p osterior—would b e sufficien t to trigger an ex- amination of the distrib ution of observ ations from the fifth group . The notion of formal Ba ye sian mo del assessment using p v alues is a bit o xymoronic, but in the ev en t that a Ba yesian p v alue is desired to more formally assess the adequacy of th ese mo dels, s amples of piv- otal v ectors like th ose d ispla y ed in Fig ure 1 can also b e used to construct a su mmary test statistic. F or normal data, the Sh apiro–Wilks statistic ( 1965 ) is an attractiv e c hoice for this purp ose. Figure 2 d ispla ys histog ram estimate s of th e p os- terior distribution on the p v alues obtained b y ap- plying the Shapir o–Wilks test statistic to a sample of 50,000 p iv otal vec tors E obtained from the p oste- rior distr ib utions d efined usin g b oth the prop er an d improp er prior sp ecifications. Note that under the assumed mod el assu mptions, the marginal distrib u - tion of eac h of the p v alues d isp la y ed in this figure are (exactly) un iform. In general, pr ior predictiv e metho d s are required to form ally ev aluate the join t distribu tions of piv- otal qu an tities lik e those displa y ed in the plots of Figure 2 . How ev er, prior p redictiv e methods are r el- ativ ely co mpu tationally exp ensive to implemen t. As B&C n ote, th ey also do not apply to mo dels defined using imp rop er p rior d istributions. T o a v oid su c h computations, b oun ds on order statistics f rom de- p end ent v ariables (Caraux and Gascuel, 1992 ; Ryc h- lik, 1992 ) can instead b e used to obtai n a b ound on the p v alue asso ciated with the joint d istribu- tion of a piv otal quan tit y . In this case, suc h b ounds can b e u sed to obtain a p v alue for the test of the n ull hyp othesis that the p v alues obtained from the Shapiro–Wilk statistic were generated from the as- sumed mo del (Johnson, 2007 ). F or the prop er and (limiting) improp er p rior sp ecificatio ns, these b oun ds are p < 0 . 07 and p < 0 . 05, resp ectiv ely . Note that b oth of these boun ds, as well as the diagnostic plots pro vided in Figure 1 , were obtained using only p os- terior samples from the assumed mo del: No addi- tional MCMC (or other numerical) sim ulations were required to obta in th ese results. 4 V. E. JOH NSON Fig. 2. p values obtaine d by applying the Shapir o–Wilks test statist ic to se c ond-stage mo del r esiduals. p values di splaye d in the left p anel wer e obtaine d fr om a mo del b ase d on a pr op er prior distribution; the right p anel displays p values obt aine d f r om a m o del sp e cifie d with an impr op er prior di stribution. T urning no w to the hospital mortalit y data, sup- p ose that the Jeffr eys prior assumed for ( α, β ) b y B&C is tru n cated to the in terv al ( a, 1 /a ) × ( a, 1 /a ) for a suitably small v alue of a . When ev aluated at indep en d en t samples of { p i } , α and β drawn f r om the p osterior, it follo ws that v alues of ζ i defined by ζ i = Beta ( p i ; α, β ) , i = 1 , . . . , 12 , (3) are marginally distributed as i.i.d. un iform deviates under the assumed mo del. Th us, mo del adequacy can b e ev aluated by either examining v ectors of th ese uniform v alues in p robabilit y p lots, or by transform- ing their v alues to a scale appr opriate for the mo del at h an d . T o this end, Figure 3 displays three ran- domly sele cted quan tile-quan tile plots of p osterior samples of { p i } against quantiles from the corre- sp ond ing Beta ( α, β ) distribution. Eac h of these p lots suggests that the hosp ital mortalit y r ates ma y not ha v e b een generated from a co mmon b eta d istribu- tion. Ba yarri and Castellanos’ selection of the m axi- m um p rop ortion as a test statisti c to conduct par- tial p osterior mo del c hec ks can b e mim ick ed here by selecting the largest uniform deviate from eac h p os- terior sample o f quan tities in ( 3 ) as a su m mary test statistic. It follo ws that for a single v ector ζ i dra wn from the p osterior, the t welfth order statistic, ζ (12) , has d istribution function F ( x ) = x 12 . Figure 4 dis- pla ys a quan tile-quan tile plot of 250,000 ζ 12 v alues dra wn from the p osterior ag ainst the corresp onding exp ected ord er statistic s. Bounds on the d istr ibution of dep end en t order statistics can again b e applied to v alues display ed in Figure 4 to obtain a b ound on the p v alue for m o del fit. F or this test sta tistic, a b ound of p < 0 . 10 is ob- tained. As b efore, calculatio n of th is b ound requir es only output av ailable from the MCMC algorithm COMMENT 5 Fig. 3. Quant ile-quantile plots of hospitality mortality r ates. Fig. 4. Quantile-quant ile plot of lar gest uniform statistic ζ (12) obtaine d fr om 250, 000 p osterior samples. The l ine i n- dic ate d in the plot has slop e 1 and inter c ept 0. used to sample f rom the p osterior d istribution. No additional sim u lation exp erimen ts or numerical ap- pro ximations are needed. Returning to a discus s ion of partial p osterior p v alues, methodologies prop osed by B&C for assess- ing the adequacy of second lev els of hierarchica l mo d- els offer imp ortant a dv an tages o ve r sev eral co mp et- ing m etho ds, but they also present sev eral practical difficulties. These difficulties in clude the f ollo wing: 1. Numerical ev aluation of p artial p osterior distri- butions is computationally and conceptually c hal- lenging ev en in simple norm al theory p roblems. Defining appropriate test statistics and estimat- ing partial p osterior distribu tions in more com- plicated mo dels may pro v e impracticable. 2. Non uniformity of p v alues in fi nite samples, cou- pled with the n um erical appr o ximation of partial p osterior distribution of the observ ed test stat is- tic, mak es it difficult to assess the evidence con- 6 V. E. JOH NSON tained in s mall p v alues. As the auth ors p oint out, an ticonserv atism is probably b etter than conser- v atism when d iagnosing model fit. But neither is go o d, and the r elativ e error asso ciated w ith small p v alues is p oten tially quite large. 3. Propriet y of p artial p osterior d istributions ma y b e difficult to establish w h en ob j ectiv e priors are emplo y ed, particularly when selecte d test statis- tics represent a component of a sufficien t statis- tic. 4. P artial p osterior mo del chec ks do not naturally facilitat e graphical diagnostics and other infor- mal m o del chec ks that are critical to the pro- cesses of m o del refinement and criticism. P artial p osterior p v alues do, how ev er, p ossess an imp ortant pr op ert y n ot sh ared by man y comp et- ing metho ds: P artial p osterior p v alues can sub- stan tially diminish the effects of masking. Indeed, evidence provided in the article suggests that par- tial p osterior p v alues are an order of magnitude less sensitive to masking than p v alues computed using other stand ard metho ds. Pro vided that the prop osed method ology can b e extended to r ealisti- cally complex Ba y esian mod els, this pr op erty offe rs assurance that large deviations f rom mo del assump - tions will not b e o ve rlo oked simply b ecause, say , a v ariance parameter w as o v erestimated. REFERENCES Ba y arri , M. J. and Berger, J. O. (1999). Quantifying sur- prise in the data a nd mo del verification. In Baye sian Statis- tics 6 (J. M. Bernardo, J. O. Berger, A. P . D awid and A. F. M. Smith, eds.) 53–82. Oxford U niv. Press. MR1723493 Caraux, G. and Gascuel, O. (199 2). Bounds on distri- bution function of order statistics for dependent v ariates. Statist. Pr ob ab. L ett. 14 103–105. MR1173405 Gelman, A., Meng , X. L. and Stern, H. S . (1996). P os- terior p redictive asses sment of mo del fitness via realized discrepancies (with discussion). Statist. Sinic a 6 733–807. MR1422404 Johnson, V. E. (2007). Ba yesian mo del assessmen t u sing pivotal quantities. Bayesian Analysis 2 . T o appear. O’Hagan, A. (2003). HSSS model criticism (with discussion). In Highly Structur e d Sto chastic Systems (P . J. Green, N. L. Hjort and S . T. R ic hardson, eds.) 423–445 . Oxford Univ. Press. MR 2082403 Ro bins, J. M., v an der V aar t, A. and Ve ntura, V. (2000). Asymptotic distribution of p va lues in comp osite null mod els (with discussion). J. Amer. Statist . Asso c. 95 1143–11 72. MR18042 40 R ychlik, T . (1992). Sto chas tically extremal distributions of order statistics for depend ent samples. Statist. Pr ob ab. L ett. 13 337–341. MR1175159 Shapiro, S. and W ilks, M. (1965). An analysis of v ariance test for normalit y: Co mplete sa mples. Bi om etrika 52 591– 611. MR 0205384
Original Paper
Loading high-quality paper...
Comments & Academic Discussion
Loading comments...
Leave a Comment