Random-set methods identify distinct aspects of the enrichment signal in gene-set analysis
A prespecified set of genes may be enriched, to varying degrees, for genes that have altered expression levels relative to two or more states of a cell. Knowing the enrichment of gene sets defined by functional categories, such as gene ontology (GO) …
Authors: ** Sengupta et al. (주요 저자: Sengupta, et al.) **
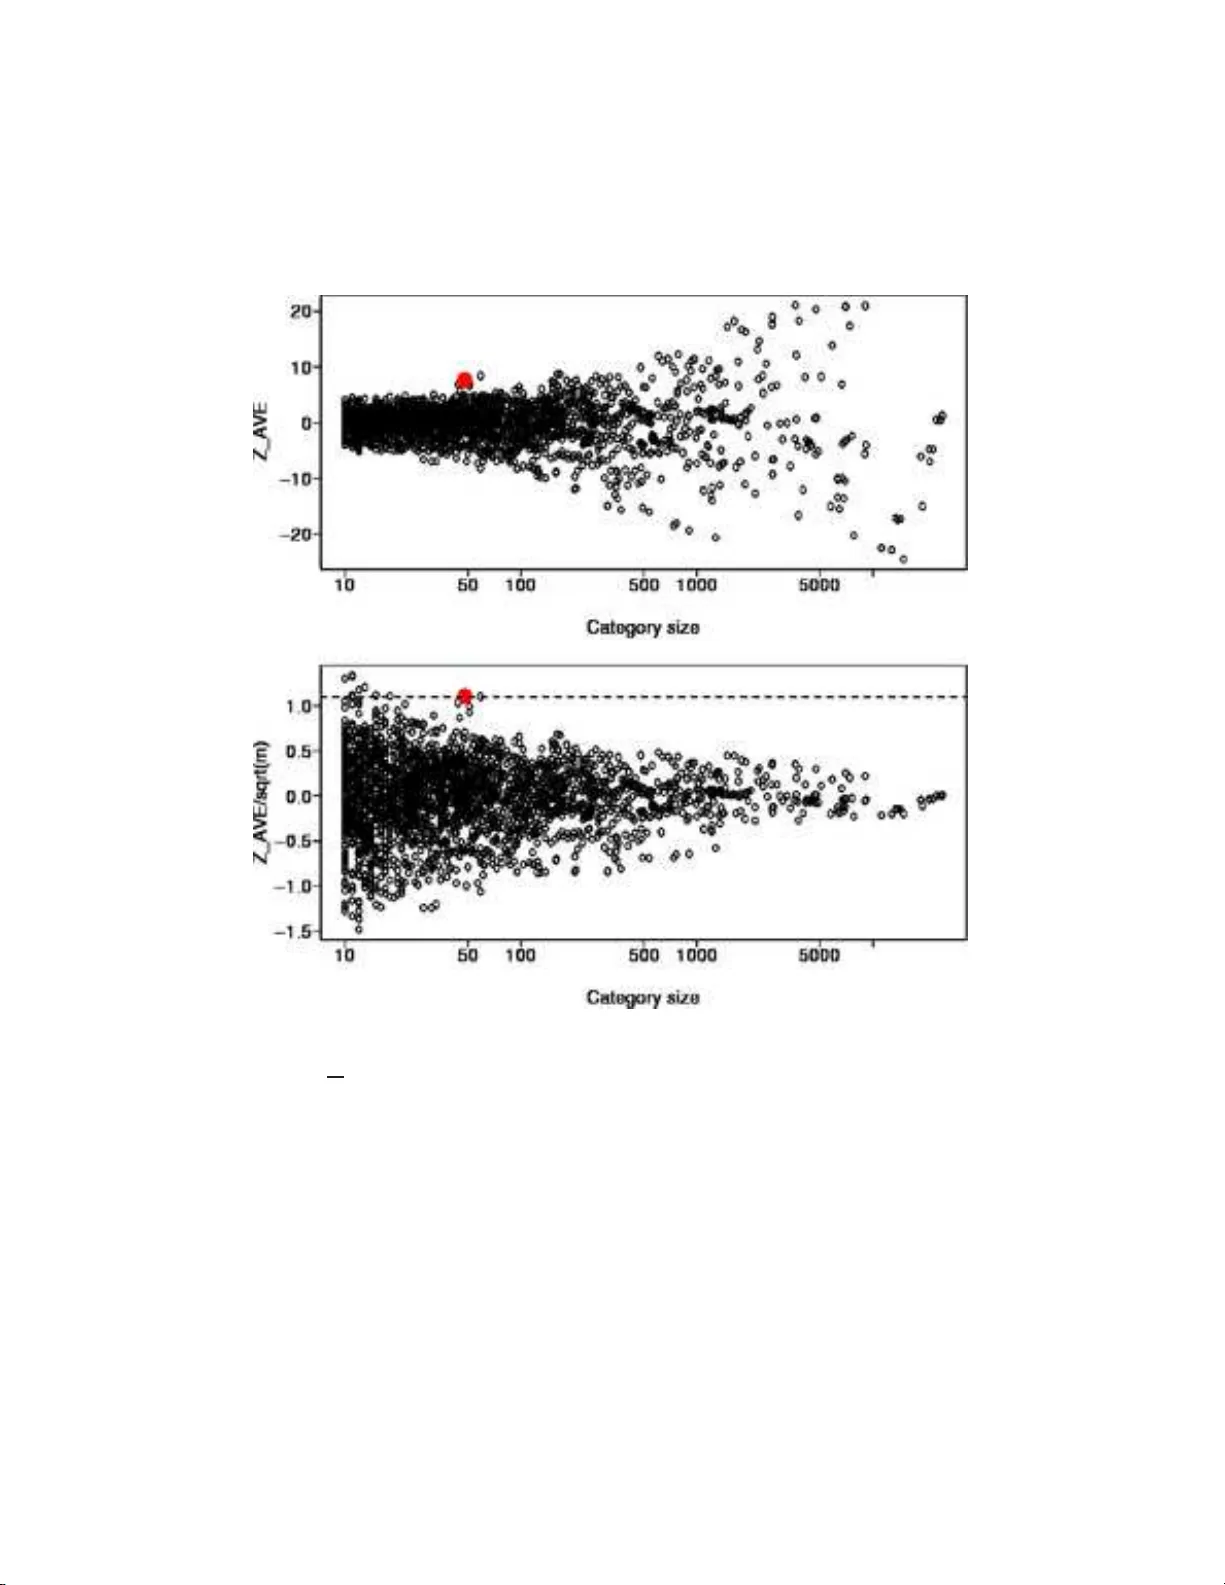
The Annals of Applie d Statistics 2007, V ol. 1, No. 1, 85–106 DOI: 10.1214 /07-A OAS104 c Institute of Mathematical Statistics , 2 007 RANDOM-SET METHODS IDENTIFY DISTINCT ASPE CTS OF THE ENRICHMENT SIGNAL IN GENE-SET ANAL YSIS By Michael A. Newton, Fernand o A. Quint ana, Johan A. den Boon, Srikumar Se ngupt a and P aul Ahlquist University of Wisc onsin–Mad ison , Pontificia Universidad Cat´ olic a de Chile , University of Wisc onsin–Madison , Wi Cel l R ese ar ch Institute , and University of Wisc onsin–Mad ison and Howar d Hughes Me dic al Institute A presp ecified set of genes ma y b e en ric hed, to v arying degrees, for genes that hav e altered exp ression levels relativ e t o tw o or more states of a cell. Kn ow in g the enrichmen t of gene sets defined by functional categories, suc h as g ene on tology (GO) annotations, is v aluable f or analyzing the biological signals in microarra y expres- sion data. A common app roac h to measuring enrichmen t is by cross- classifying genes according to membership in a fun ctional category and memb ership on a selected list of significantl y altered genes. A small Fis her’s exact test p -v alue, fo r example, in this 2 × 2 table is in d icative of enric hment. Other categor y analysis methods retain the quantitativ e gene-level scores and measure significance by refer- ring a category-leve l statistic to a permutation distribution associated with th e original differential exp ression problem. W e describ e a class of rand om- set scoring metho d s that measure distinct comp onents of the enric h ment signal. The class includes Fisher’s test based on se- lected genes and also tests that a verage gene-level evidence across the category . Averaging and selection metho ds are compared emp irically using Affymetrix d ata on expression in nasopharyngeal cancer tissue, and theoretically using a lo cation mo del o f differential expression. W e find that eac h method has a domain of sup eriorit y in the state space of enrichmen t problems, and that b oth metho ds hav e b en e- fits in practice. Our analysis also addresses t wo problems related to multiple-categ ory inference, namely , that equally enriched categories are not detected with equal p rob ab ility if t hey are of different sizes, Received Octob er 2006; revised F ebru ary 2007. 1 Supp orted by the National Cancer Institute Gran ts CA64364, CA22443 and CA97944 and FONDECYT Grants 1020712 and 1060729. Supplementary material a v ailable at http://imstat. org/aoa s/supplements Key wor ds and phr ases. Conditional testing, gene ontology , gene set enrichment analy- sis, host-virus association in nasopharyngeal carcinoma, selection versus a verage evidence, significance analysis of function and expression. This is an electronic repr int of the orig inal a rticle published by the Institute of Mathematical Statistics in The Annals of Applie d Statistics , 2007, V ol. 1, No. 1 , 85–10 6 . This reprint differs from the original in paginatio n and t ypo graphic detail. 1 2 M. A. NEWTON ET AL. and also that t here is d ep endence among category statistics owing to shared genes. Random-set enrichmen t calculations do n ot require Mon te Carlo for implementation. They are made av ailable in the R pack age al lez . 1. In tro d uction. In pro cessing results of a m icroarra y stu d y , one is faced with the daunting task of r elating differentia l-expression evidence to other information ab out the genes. An y interesti ng connections that can b e re- v ealed are critica l in devel oping a fu ller understandin g of the biology and in pro v id ing guid ance to wa rd the next exp erimen t [e.g., Rho des and Chinnaiy an ( 2005 )]. Muc h of the exogenous information is organized in net works of fun c- tional categories; genes are ann otated to th e same category b y virtue of a shared biological prop erty . Th e Gene Ontolog y (GO) pro ject is p erhaps the b est example of h o w biological inf ormation is carried by net work ed collec- tions of functional categories [ Gene Ontol ogy Consortium ( 2000 , 2004 )]. Ini- tiated as a collab oration among d ifferen t genome pro jects, GO h as b ecome a fund amen tal resource that records attributes of genes and gene p ro du cts and that organizes these attributes usin g netw orks of connected fun ctional catego ries. The problem of enric hment emerges in relating gene-lev el expr ession re- sults with functional categories. T o what exten t, if at all, are genes w ith altered expression o v er-repr esen ted in a n amed category? A t the risk of o ver- simplifying thin gs, the extensive researc h a nd deve lopm en t to w ard solving this problem may b e classified by t w o statistical appr oac hes. The fi rst b egins b y selecti ng a short list of genes th at are altered significan tly relativ e to the cell grouping under study: for instance, genes with extreme fold change or with e xtreme v alue of a t est statistic. The intersect ion of the sele cted list and the fu nctional catego r y is th en ev aluate d, p erhaps by Fisher’s exact test or a v arian t, whic h scores the category highly for enrichmen t if m an y m ore selected genes than exp ected b elong to the category [ Drˇ aghici et al. ( 200 3 ), Berriz et al. ( 2003 ), Doniger et al. ( 2003 ), Al-Sh ahrour, Uriarte and Dopazo ( 2004 ), Beißbarth and Sp eed ( 20 04 ), C heng et al. ( 2004 ), Zh on g et al. ( 2004 ), Do dd et al. ( 2006 )]. Av aila ble informatics to ols and related problems are r e- view ed in Khatri and Drˇ aghici ( 20 05 ). A seco nd approac h is d ev elop ed in Virtanev a et al. ( 2 001 ) and Barry , Nob el and W righ t ( 2005 ), called SAFE (Significance analysis of function and expression) and also in Mo otha et al. ( 2003 ) and S ubramanian et al. ( 2005 ), ca lled GSEA (Gene set enric hment analysis). Briefly , expression information on all the genes u nder s tu dy is re- tained; then a p erm utation analysis is used to m easure the sig nificance of catego ry-lev el statistics computed from these gene-lev el statistics. Existing to ols ha ve b een effectiv e in adding v alue to expression r esults, but th ey remain limited for ev aluating enric hmen t signals. Analysis is sim- plified when considering select ed gene lists, since quan titativ e scores from GENE SET ENRICHMENT 3 the gene-lev el analysis are not required. But then th e enric h men t results dep end on the stringency of the selection, and giv e equal weigh t to genes at b oth end s of the selected list. This pr oblem is redr essed in the S AFE/GSEA approac h. Th e permutation metho d a dopted b y SAFE/GSEA refers bac k to the lab eled microarra y data themselves rather than to the results of the differen tial-expression analysis. There is an added computatio nal bu rden in this strategy and also it can b ecome ineffectiv e when few m icroarra ys en ter the p ermutatio n. A technical issue, further, concerns th e n ull hyp othesis at w ork in the SAFE/GSEA p ermutati on. It refers to the complete absen ce of differen tial expression rather than to the ab s ence of enric hm en t. In this paper w e exp lore pr op erties of r andom-set metho ds fo r measur- ing enric h ment . W e adopt catego ry-lev el statistics lik e in SAFE/GSEA, bu t w e calibrate them in the s ame w a y that Fish er’s exac t test calibrates the in tersection of a functional category and a selected list. That is, we cali - brate them conditionally on results of the differen tial expression analysis by considering v alues of th e category-le v el statistic th at wo uld b e ac hieve d by a random set of genes (Section 2 ). C alculations are simplified b y formulae for the exp ected v alue and v ariance of this cond itional distribution, so th at Mon te Carlo app ro ximations ma y not b e required. Random-set scoring i s applicable to a v ariet y of gene-lev el scores; w e compare t wo sc hemes em- pirically in a study of nasopharyngeal cancer in Section 3 . One measures enric h m en t by counting the in tersection w ith a selected gene list; the other considers a verag e differential -expression evidence across all genes in the cate- gory . In conjunction with empirical evid en ce we pursu e a theoretical analysis to compare these tw o ca tegory sco ring method s (Secti on 4 ). W e find that t wo p arameters affect th e p o wer to detect en ric hm en t, and these play out so that neither the selection approac h n or the av eraging app roac h is uniformly sup erior. Additionally , w e show ho w the random-set approac h facilitat es si- m u ltaneous inference among m u ltiple categories. Two imp ortan t issues are (1) h o w to accommo date th e p o wer im b alance caused by d ifferently sized- catego ries, and (2) ho w to obtain the join t distribution of category scores in order to ha v e v alid typ e-I err or rate control (Section 5 ). W e offer appro xi- mate analytical solutions to these problems. 2. Random-set enric hment scoring. W e describ e a general m etho d to score categories for enric h men t with expression-altered genes. Sengupta et al. ( 2006 ) (esp ecially Supplemen tary Data) introdu ced the metho d and de- scrib ed it briefly . It forms the basis of our app roac h and so here w e amplify and cla rify the pr esen tation. The class extends Fisher’s exact test by allo w- ing a v ariet y of gene-lev el scores, denoted { s g } , for differen t genes g . These ma y b e binary indicators of extreme differen tial expression, but we all o w more general quan titativ e expression sco r es. W e focus initia lly on a single catego ry C con taining m genes. 4 M. A. NEWTON ET AL. The idea is to consider the unstand ard ized enric hment score ¯ X = 1 m P g ∈ C s g as a random v ariable wherein th e randomness comes not through the gene scores { s g } but rather thr ough the set C . W e are concerned, after all, w ith measuring enric h m en t for a sp ecific category C compared to other h yp othet- ical cate gories from the same system. It is useful to treat the r andom set C as d r a wn uniform ly at random from the G m subsets of m distinct genes from the p opu lation of G genes, just a simple rand om samp le dra w n without re- placemen t [e.g., Co c h ran ( 1977 )]. T his is equiv alen t to a p erm utation sc heme in w hic h gene-lev el scores are randomly shuffled among the gene lab els. Pre- cisely this sc heme underlies Fisher’s exact test in the sp ecial case that s g is the binary indicator of selection onto the significan tly altered gene list (Supplementary T able 1). T he random-set mo del is applicable b ey ond the binary case to any sort of gene-le vel scores, though the induced distribution of ¯ X b ecomes in tractable. Rather than resort to Mont e Carlo, we fin d that the first t w o momen ts of th e otherwise int ractable distrib ution are a v ailable analyticall y , and th at the indu ced distribu tion is appro ximately Gaussian. These fi ndings are the basis of our prop osed standardization. Un der the random-set mo del, and th u s conditional on gene-lev el scores { s g } , µ = E ( ¯ X ) = P G g =1 s g G (1) and σ 2 = v ar( ¯ X ) = 1 m G − m G − 1 P G g =1 s 2 g G − P G g =1 s g G 2 , (2) whic h are easily computed fr om th e full set of gene-lev el scores and the cate- gory size. Notably , the mean µ do es not dep end on attributes of the category , though the v ariance d ep end s on the category size m . W e prop ose the stan- dardized category-enric hment score Z = ( ¯ X − µ ) /σ , whic h is a mean zero, unit v ariance score on the null h yp othesis that category C is not enr ic hed for differen tially e xpressed genes. Analysis is simplified, esp ecially in the case of m ultiple catego ries, b ecause Z is computable without u sing p ermutatio n . Large v alues o f Z fa vor the enrichmen t hyp othesis. F or moderate to large catego ries, cen tral limit th eory ind icates that Z is distrib uted app ro ximately as a standard normal on the no-enrichmen t null hyp othesis. Enric hmen t scoring is e nliv ened by the p ossibilit y of using a v ariet y of gene-lev el scores. W e ma y use log fold c h anges, t -statistics or other lo cal measures o f d ifferen tial expression. In the sp ecial case w here { s g } are the ranks asso ciated with gene-lev el scores, we get a v ersion of the Wilco xon test for enric hmen t, since m ¯ X is a sum of ranks, and b oth µ and σ 2 simplify as µ = G + 1 2 , σ 2 = ( G − m )( G + 1) 12 m , GENE SET ENRICHMENT 5 with suitable adjustment s for ties. Gene-lev el scores fr om an empirical Ba y esian analysis might b e p osterior probabilities of differential expression [ Kendziorski et al. ( 2003 )], in whic h case m ¯ X equals the p osterior exp ected num b er of altered genes in the category , and Z ca librates this relativ e to the p opulation of genes. Section 3 dev elops an example in whic h { s g } are tr an s formed Sp ear- man correlations b et w een host genes and th e expression of a particular viral gene. Efficiency an d appro xim ate normalit y of the Z sco r e will b e improv ed if the distribu tion of gene-lev el scores is su itably regular. F or instance, it is preferred to use log transformed p -v alues instead of p -v alues, and lo g fold instead of ra w fold c h ange. Another imp ortan t sp ecial case h ap p ens when { s g } are binary scores ind i- cating select ion to a sh ort list of significan tly differentia lly expressed genes. Then Z 2 = ( G − 1 G ) U , where U is P earson’s c hi-squared statistic for t esting indep en dence b et w een category and sh ort-list assignmen t [calculations not sho w n , but follo wing, e.g., Bic k el and Doksum ( 2001 ), page 402]. T o a minor appro ximation, then, our prop osed Z score corresp onds to Fisher’s or Pear- son’s test when { s g } are binary gene-lev el scores. O therwise it g eneralizes those category scores and measures other asp ects of the enric h men t s ignal, as w e d emonstrate next. 3. An analysis of host/virus asso ciations in cancer. A recen t expression study of nasopharyngeal carcinoma (NPC) used the prop osed metho dol- ogy f or category enric hm en t [ Sengupta et al. ( 2006 )]. NPC is a cancer of the nasopharynx that is resp onsible for 60– 70,000 deaths p er year w orld- wide. Nearly all cases are asso ciated with the Epstein–Barr virus (EBV) infection, though the molecular determinan ts and the nature of the host- virus int eractions remain p o orly und er s to o d. Sengupta et al. ( 200 6 ) stu died tumor tissue from n = 31 NPC p atien ts u sing Affymetrix h gu133plus2 mi- croarra ys to measure host gene exp r ession and us in g R T-PCR to m easure the expr ession of 10 viral genes. Th e hgu133plus2 microarra ys prob e the transcriptome w ith G = 54,675 prob e sets. Here w e reconsider a sso ciations b et w een host expression and the expression of the single viral gene EBNA1. The statistical analysis of h ost-virus asso ciation rests on pairwise Sp ear- man correlations b etw een individual Affym etrix prob e set v alues and the expression of EBNA1. Su pplement ary Figure 1 sho w s one prob e set and its co rrelation with EBNA1. Supplementa ry Figure 2 s ho w s correlations with EBNA1 for all host prob e sets. The most extreme negativ e correla- tion is r = − 0 . 75, whic h is unusually small (Supp lemen tary Figure 3, p - v alue = 0 . 04). A striking feature of the empirical distribution of correlations is that 65% of host pr ob e sets are negativ ely correlated with EBNA1. Th is is significan tly more than exp ected if tru ly there is n o asso ciation b etw een h ost and viru s expression ( p -v alue = 6 × 10 − 4 , S u pplementa ry Figure 3) . Glob- ally , there is evidence for significant negativ e asso ciation b et ween EBNA1 6 M. A. NEWTON ET AL. Fig. 1. Gene sele ction. F or the host-virus asso ciation ex ample, plotte d is a hi sto gr am of the 54,675 Sp e arman c orr elations b etwe en expr ession of e ach Affymetrix pr ob e set and the expr ession of the vir al gene EBNA1. Corr elations ar e c ompute d using m icr o arr ay data on 31 tumor samples as describ e d in Sengupta et al. ( 2006 ). Hi ghlighte d on the left ar e sele cte d pr ob e sets that have signific ant ne gative c orr elation wi th EBNA1 ac c or ding to a q -value analysis that tar gets a 5% FD R gene l ist (c orr elation less than − 0 . 55 ). expression and th e expr ession of host genes in NPC . Figure 1 highlights a selected list of the 574 most significan tly altered host prob e sets; the list targets a 5% false disco very rate (FDR) according to the q -v alue metho d of Storey ( 2003 ). In this calculat ion p -v alues w ere obtained b y recalli ng that s g = 1 2 √ n − 3 log 1 − r g 1 + r g (3) is app ro ximately sta ndard norm al in the absence o f a tr ue correlation b e- t wee n g and EBNA1 [ Fisher ( 1921 )]. The sign change emplo yed (compared to the usual inv erse hyperb olic tangen t transf orm ) means that genes whic h correlate negativ ely w ith EBNA1 hav e a p ositiv e gene score s g . Naturally , w e ma y examine the genes o n th is selec ted list, bu t a study of functional catego ries that are enric h ed for n egativ ely asso ciated genes exp oses more of the relev an t b iology . GENE SET ENRICHMENT 7 Fig. 2. R andom-se t sc oring. Shown ar e r esults of two c ate gory-sc oring metho ds applie d to 2761 GO c ate gories for which m ≥ 10 and b ase d on the gene-level c orr elations fr om Fig- ur e 1 . Both metho ds aim to dete ct enrichment of the c ate gory f or genes that ar e ne gatively asso ciate d with EBNA1 vir al expr ession. Cate gory GO: 0019883, “ antigen pr esentat ion, en- do genous antigen ” c ontains m = 48 pr ob e sets and sc or es highly by b oth metho ds (lar ge r e d dot). The l ar ge ( m = 1494 ) “ immune r esp onse ” c ate gory (GO:0006955) sc or es extr emely highly by Z a ve but not so highly by Z sel (gr e en dot). Shown in r e d ar e c ate gories that ar e subsets of “ immune r esp onse. ” The aver age c orr elation of im mune r esp onse genes wi th EBNA1 is extr emely signific ant, but the numb er of signific antly ne gatively c orr elate d genes is less signific ant. Figure 2 summarizes t wo catego r y-enric h men t s coring m etho ds applied to all GO categories (2761) con taining at least m = 10 annotate d hgu133plus2 prob e sets. (This used the Octob er 2005 build of Bio conductor pack age hgu133plus2.) Man y pr ob e sets we re unannotated, and to av oid p otenti al 8 M. A. NEWTON ET AL. biases, we restricted atten tion to the universe of G = 27,152 ann otated prob e sets [ Al-Shahrour, Uriarte and Dopazo ( 2004 )]. The t wo enric hm ent scoring metho ds are conditional Z scores as describ ed in Section 2 . Th e first, Z a v e , is based on gene-lev el transformed correlations s g from ( 3 ). Th e second, Z sel , is based on binary scores 1[ s g > k ] , where k defi nes the 5% FDR list of the most sig nifican tly negati v ely correlated host genes. Recall that Z sel is the normal-score v ersion of Fisher’s exact test. Since eac h Z score is nominally standard normal in the absence of enric hment , Figure 2 seems to in dicate that man y GO categories are enr iched for altered genes. Reference lines at z = 5 are dr awn for guidance (nominal p -v alue < 10 − 6 ). A notewo rth y fea- ture in Figure 2 is that Z sel and Z a v e are not p erfectly correlated. T hey capture differen t asp ects of the enrichmen t signal, a nd th us, they deserv e separate consideration. Some catego ries ha v e h igh Z sel but negligible Z a v e . They are enric hed for genes on the short list of most significan tly n egativ ely correlated genes, but the a v erage correlation is not unusual. Other categories ha ve h igh Z a v e but negligi ble Z sel . These would not b e detected b y Fisher’s test, for example, though on the av erage the negativ e correlation exhibited b y the con tained genes is extremely unusual. That Z sel and Z a v e capture d ifferen t aspects of t he enric hment signal is exemplified by the imm une resp onse category , GO:00069 55, which connects m = 1494 prob e s ets on t he hgu133plus2 microa r ra y . Recall t hat a signif- ican t mass of host prob e sets are negativ ely correlated with the EBNA1, though most of these do not o ccup y the 5% FDR selected list of m ost sig- nifican tly altered host p rob e sets. Among the 2761 GO categories are many (mark ed in r ed ) that are s ubsets of GO:006 955; that is, they represen t sp e- cific forms of the imm un e resp ons e. Notably , all th ese subsets ha v e Z a v e > 0, whic h indicates that their a v erage correlation with EBNA1 is more nega- tiv e th an av erage. T ak en together, w e get strong evidence of enr ichmen t b y Z a v e . At the s ame time, man y of th e sub sets hav e Z sel < 0, whic h ind icates that they hav e less repr esen tation on the selected list than w e exp ect, and th u s, selected prob e sets are not particularly o ve r-represent ed in th e imm u ne resp onse category . Sengupta et al. ( 2006 ) follo wed u p on some of the categ ories that show ed b oth extreme Z sel and extreme Z a v e , suc h as GO:0019883 , whic h i s in the biologica l pro cess net wo rk, w ith GO term antigen pr esentation , endo genous antigen . This category is marke d up in su bsequent figures. Th er e are m = 48 prob e sets annotat ed to this category , and x = 8 o ccup y the s elected list, giving z sel = 10 . 6. Also, the a v er age correlation with EBNA1 is u nusually lo w, with z a v e = 7 . 68. An informal lo ok at the sh ort list of 574 significan tly altered p rob e sets p r obably wo uld n ot hav e rev ealed a pr ep onderance of GO:00198 83 genes. In deed, the b est ranking is at the 90th p osition, there are only three pr ob e sets in the top 250. F ollo wup exp erim ents on the genes in GO:00198 83 confirmed the negativ e correlation findings that were su ggested GENE SET ENRICHMENT 9 b y th e enric h men t analysis. Ongoing researc h aims to un derstand wh ether viral EBNA1 is ta king adv an tage of host cell s that ha ve d isabled an tigen present ation function, or whether th e virus is effecting a c h ange in the host expression itself. It is routine that named genes are asso ciated with m u ltiple prob e sets on an Affymetrix microarra y (Supp lemen tary Figure 4A). GO:0019883 , for example, repr esen ts only m g = 12 genes though it has m p = 48 prob e sets. The fact i s imp ortan t fo r enrichmen t c alculatio ns since we ought to a v oid spurious findin gs that refl ect ov er-represen tation of certain genes in the sys- tem rather th an b iologica lly s ignifi can t enr ichmen t. V arious solutions are a v ailable. Ideally we w ould first reduce the prob e set data to the gene lev el, and then pro ceed with enric h men t calculations on this redu ced space (giv- ing Z ideal ). A computationally m uch simpler adjustment is suggested by the v ariance form u la ( 2 ). It uses the prob e set based Z score, and the n umb ers m g and m p to compute Z adjust = Z s m g m p ( G − m p ) ( G − m g ) . (4) The rationale is that ¯ X and µ may not change muc h in the r eduction step; most of the effect will b e on the v ariance. The naive , ideal (reduce b y median) and adjusted enric h men t scores are compared in Sup p lemen- tary Figure 4 B, C. The ideal scores tend to b e more conserv ativ e than the naive ones; GO:0019883 remains impressive with z ideal;av e = 4 . 78 and z ideal;sel = 11 . 3 (latter not sh o wn ). Globally , the adjus tmen t ( 4 ) is similar to the ideal score and it tends to b e conserv ativ e. In the example category GO:00198 83, z adjust;a v e = 3 . 84 and z adjust;sel = 5 . 3. Th u s, e ffectiv e app r o xi- mations a ccommod ate the multiple pr ob e sets p er g ene problem. In some cases it may b e p ossible to select the most reliable p r ob e sets fr om among the m ultiple prob e sets asso ciated with a gene. F or example, a pr ob e set sho w in g high a v erage in tensity and high d ynamic range across multiple tis- sue t yp es ma y b e b etter than one measuring near the bac kgroun d signal in most samples. W e d o not addr ess the selection of prob e sets in this pap er, but if pr ob e sets are selected for some genes, equation ( 4 ) could b e applied to the selected prob e sets. F or fur ther comparison, we applied the S AFE pro cedu r e [ Barry , Nob el and W righ t ( 2005 )] to all 2761 GO catego ries using the original microarray data and EBNA1 expression data on all 31 tu mor samples. W e adopted the s ame catego ry-lev el s tatistic in order to con trol the comparison. Sp ecificall y , gene- lev el Sp earman correlations w ere transformed to r anks to b e used as s g v al- ues, and the category-lev el statistic ¯ X w as the a verage rank (ranks were rela- tiv e to the 27,152 prob e s ets ha v in g some annotation). Results for GO:00198 83 are su mmarized in Figure 3 . Visually , the category app ears to ha ve a pre- p ond er an ce of negativ e correlations with EBNA1 (P anel A), and th is is 10 M. A. NEWTON ET AL. Fig. 3. Comp arison with SAFE/GSEA: Panel A is a r ank plot of pr ob e set c orr elation sc or es for the host-virus example. The p ositions of the m = 48 pr ob e sets fr om GO:0019883 ar e marke d, and suggest a pr ep onder anc e of c orr elations on the ne gative side. The aver age r ank is note d with an arr ow (5478). Panel B c omp ar es the empi ric al distribution f unctions (e.d.f.s) of two differ ent nul l distributions for the aver age r ank statistic (r e d = r andom sets; blue = SAFE). Asso ciate d histo gr ams ar e in p anels C and D , but the e.d.f.s r eve al the sc ale differ enc e mor e dr am atic al ly; B = 10,000 r andom dr aws ar e use d in e ach c ase. R e c al l that the r andom set (r e d) distribution is obtaine d by shuffling the GO:0019883 r anks in p anel A . By c ontr ast, the SAFE (blue) distribution r eturns to the original data and shuffles chip lab els (as in Figur e 3, Supplementary material). The p -value fr om SAFE is p = 0 . 02 and fr om r andom sets i s p < 10 − 10 ( z = − 7 . 1 ) b ase d on a normal appr oximation to p anel D . supp orted by b oth statistical cali brations. Y et random-sets and S AFE ev al- uate the significance of th e same a v erage-rank s tatistic rather differen tly . Compared to a verage ranks obtained on random, same-sized sets, the a ve r- GENE SET ENRICHMENT 11 age rank f or GO:0019883 is extremely unusual. Compared to the sta tistic w e wo uld compute on GO:0019883 if viral expression is not associated with host expr ession, the observ ed av erage r ank is mo destly significant. A similar pattern recurs for many cat egories (S upplementary Figure 5). Th e t w o cal- ibration approac h es agree b r oadly b ut differ substantia lly in their rankin g of cate gories, whic h suggests that the distinct enr ichmen t signal is identi fied b y the random-set approac h. 4. Av eraging or selectio n? A theoretical comparison. In t he preceding case stud y we observ ed emp ir ical charac teristics of tw o random-set method s for scoring category enr ic hment. The selection appr oac h b egins with a short list of extremely altered genes and asks if there is ov er-represent ation in the catego ry . The a ve raging appr oac h scores the category simp ly by a veragi ng gene-lev el evidence across all genes in the category . Th e asso ciated cat egory Z scores exhib it some p ositiv e co r relation, bu t evidently they captur e d if- feren t comp onents of the enrichmen t signal. Some theoretical findings are a v ailable wh ic h exp ose prop erties of th e enric hment testing problem. Our find ings are d ev elop ed in the con text of a generic mixture mod el, one that is s tructurally similar to mod els commonly describ ed in the microar- ra y literature. The m o del is p resent ed in order to dev elop a comparison of category scoring metho ds. It is not used f or the analysis of data p er se, bu t it sh eds light on an int eresting ph en omenon created b y this tw o- lev el (gene/ca tegory) inference p roblem. W e find that eac h cat egory-scoring metho d has its o wn domain of s u p eriority in the state-space of enric hm en t problems; neither is alw a ys pr eferr ed. The r esult is somewhat sur prising since information is obvi ously lost in the selection approac h and not so ob viously lost by av eraging evidence. Th e r esult is related to the debate in statistics ab out mo del selection ve r sus mo del a verag ing. Consider genes g ∈ { 1 , 2 , . . . , G } and quantita tive gene-lev el scores { s g } . The larger s g , the more evidence for d ifferen tial expression of gene g . A catego ry C is a kno w n su bset of m < G genes sh aring some particular bio- logica l fu nction. The category ma y b e scored for enrichmen t by one of t w o statistics: ¯ X a v e = 1 m X g ∈ C s g | {z } a v eraging , ¯ X sel = 1 m X g ∈ C 1[ s g > k ] | {z } selection . T o enable a comparison of the category scores, we frame the p roblem as a test of the n ull hyp othesis that C is not enric h ed . More sp ecifical ly , supp ose that eac h gene g is either truly differentiall y expressed ( I g = 1) or not ( I g = 0) b etw een the t w o cellular states. W e allo w that some fraction π = 1 G G X g =1 I g 12 M. A. NEWTON ET AL. of genes are tr uly d ifferen tially expr essed. The category C itself con tains a fraction π C = 1 m X g ∈ C I g of differen tially exp r essed genes. No enric hment means H 0 : π C = π , and this is tested against the alternativ e H 1 : π C > π . W e can define enrichmen t s im- ply as π C − π . Lac k of enr ic hment do es not mean there is no differentia l expression; it ju st means there is not more than in th e w hole system. (One could also adjust for discreteness of π C , but the adjustment would b e negli- gible f or mo destly large category size m , and so it is not pur s ued.) Statistics ¯ X sel and ¯ X a v e are t w o p ossib le test statistics for testing H 0 . W e compare their p ow er against v arious alternativ es. The laten t differen tial expression indicato r I g affects the distrib ution of the gene-lev el score s g . A simple location mo del asserts that s g is normally distributed with un it v ariance and with mean δ I g for a gene-lev el effect δ > 0, and that all v ariables are indep enden t. Normalit y is often reasonable for s uitably tr an s formed gene-lev el scores, suc h as log 2 (fold) o r t he trans - formed correlation (Section 3 ). Differen tial expression could p oten tially alter the v ariatio n of scores, but as a firs t approxi mation we fo cu s on the lo cation shifts o nly . The p ossible effects of among-gene dep endence are imp ortant, but th ey are s econdary in the p resen t comparison of en r ic hm en t-scoring metho ds, hence, our d emonstration is in the indep endence mo del (see d is- cussion). A test based on the a v erage quantita tiv e score ¯ X a v e uses the sampling distribution Normal( δ π C , 1 /m ). T h us, the p o w er of a level α test is 1 − Φ( τ a v e ), where Φ( · ) is th e standard norm al cumulat iv e distribution and τ a v e = z α − √ m ( π C − π ) | {z } enrich men t δ |{z} effect . (5) Naturally , the p o wer of the a v eraging approac h increases w ith effect, enrich- men t and category size. One scenario is presented in Figure 4 B: a category of size m = 20 is tested for enr ic hment at lev el α = 0 . 05 in a system with π = 0 . 2 of genes differen tially expressed. The p o wer of th e selection approac h is similarly derived. It en tails a n or- mal approxi mation for ¯ X sel that is w ell j u stified in large categories b y th e cen tral limit theorem. The p o wer is 1 − Φ( τ sel ), where τ sel = z α σ ( π ) σ ( π C ) − √ m ( π C − π ) | {z } enrich men t [Φ( k ) − Φ( k − δ )] /σ ( π C ) | {z } effect ∗ . (6) Here k = k ( π , δ , ˜ α ) is c hosen to deliv er a FDR-con trolled gene list at lev el ˜ α (see App endix ). Also, the v ariance function σ 2 ( π C ) r ecords the v ariance GENE SET ENRICHMENT 13 of √ m ¯ X sel . Figure 4 A sho ws ho w the p ow er to detect enric hment b y the selection metho d is affected by π C − π and δ for catego r ies of size m = 20, when π = 0 . 2 and α = ˜ α = 0 . 0 5 . The p o we r su rfaces in Figure 4 revea l an int riguing phenomena in en- ric hm en t testing. Both sel ection and a veraging increase in p o wer as e ither enric h m en t π C − π or effect δ increase. How ev er, they increase differen tly , creating domains of sup eriorit y f or eac h approac h . The lo w er panels in Fig- Fig. 4. Power c omp arison. Power to dete ct enrichment is shown for a c ate gory of size m = 20 in a system with π = 0 . 2 differ ential expr ess ion over al l ( A and B ). Sele ction and aver aging ar e b eing c omp ar e d, wi th low p ower in r e d and p ower incr e asing into the yel lows and whi tes. The lower p anels show domai ns of sup eriority for e ach m etho d ( by i maging the thr eshholde d differ enc e on a − 1 , 1 sc al e ) . The enrichment is π C − π , and the effe ct of differ ential expr ession p er gene is δ . The m aximum p ower differ ential is 0. 46 ( C ) and 0.74 ( D ). 14 M. A. NEWTON ET AL. ure 4 sho w these domains for the case indicated. When the π C − π is s mall, but δ is large, then it is b etter to use the selection approac h. On the other hand, if δ is small, but π C − π is large, then it is b etter to a verage evidence across all genes in the c atego ry . The fact that selection can b e s u p erior is somewhat striking, since it en tails a signifi cant amoun t of in f ormation loss; eac h gene score is r eplaced b y a binary indicator of whether or not th e score is extremely large. On the other hand, if enrichmen t is weak, then a verag ing evidence com bines a lot of noise with signal, th u s, diminishing p ow er. The n onlinearit y of the p ow er functions complicates a general comparison, but w e h av e ident ified sufficien t conditions for one or the other approac h to b e sup erior (see App end ix ). T o state the resu lt, fir st put κ = ˜ απ / { (1 − ˜ α )(1 − π ) } , where, again, π is the p rop ortion of differentiall y expressed genes in th e whole system and ˜ α is the FDR of the gene list used by the select ion approac h. W e require 0 < κ < 1, else it is not p ossible to h a ve th e desired FDR con trol; this is a weak condition, since it is imp lied if b oth 0 < ˜ α < 1 / 2 and 0 < π < 1 / 2, for example. Theorem 1. If 2Φ − 1 ( 1 1+ κ ) < δ < 1 √ κ − √ κ, then for sufficiently lar ge m , sele ction is mor e p owerful than aver aging. Also, given any π C > π , ther e exists δ ∗ ( π C , π ) such that i f 0 < δ < δ ∗ ( π C , π ) , then for suffici e ntly lar ge m , aver aging is mor e p owerful than sele ction. This is a fin d ing ab out sub-optimalit y of t w o enrichmen t d etection meth- o ds. In using a selection ap p roac h, there is limited p ow er to detect enrich- men t wh en the catego ry und er test conta ins lots of genes that are altered b y a sm all amount, reflecting the fact that these genes are n ot selected as the most significan tly altered ones. By con trast, selection is sup erior to av erag- ing if the category under test is enric h ed for a small n um b er of highly altered genes. W e note that th e int erv al for δ in the fir st claim is n onempt y when κ is su fficien tly small (sa y , smaller than 0 . 133). W e also note th at a veraging is sup erior b oth when δ is ve ry small an d when δ is ve r y large. In teresting p ow er d ynamics emerge in the inte rior of the state sp ace, as, for instance, in Figure 4 . 5. Sim u ltaneous inference with multiple catego ries. An u nsolv ed p rob- lem with enrichmen t calculations concerns the comparison of man y cate- gories that v ary in size. On th e n ull hyp othesis o f no enr ic hment, eac h Z score is well calibrated b y design, with zero mea n an d un it v ariance. But man y catego ries may b e enric hed, and u nlik e simpler genomic testing prob- lems, there is differen t p o w er asso ciated with th ese different tests. The dis- tribution of Z und er t he enric hm ent h yp othesis is a function of b oth the unknown enric hment π C − π and the kno w n category size m . F or instance, GENE SET ENRICHMENT 15 in th e lo cation-shift mo del, Z a v e has u nit v ariance and m ean √ m ( π C − π ) δ . Owing to this size effect, th e ranking of categories by Z a lone ma y not b e optimal since large enriched categorie s will tend to ha v e muc h larger Z scores. The p henomenon is illustr ated in the host-virus example in Fig- ure 5 A. T he pr oblem is not limited to Z a v e ; it o ccurs to o with Z sel , esp ecially when the selected set is relativ ely large (data n ot sho w n). A partial solution, demonstrated in Figure 5 B, is to rank categories according to Z / √ m ; then catego ries are ranked by the estimated enric h men t π C − π . In itself th is do es not pro vid e an err or-con trolled list of en ric hed categ ories; nor do es it accoun t for the nonconstan t v ariance of Z/ √ m , but the ranking ma y b e calibrated and remains useful for prioritizing categ ories across the GO net w orks. A complete solution to simultaneous multiple-c atego ry testing will in- v olve the joint d istribution of category statistics, rather than their marginal distributions considered so far. Without d ev eloping calculations f u lly here, w e note that the j oint d istribution of Z scores across catego ries (condi- tional on { s g } ) is acce ssible by an analysis of intersectio ns among the differ- en t cate gories. Prop er-subset in f ormation, for e xample, is p ro vid ed by the directed graphical structure of GO. Two element s of the random-set ap- proac h simplify the analysis of multiple categories. First, the p erm utation p ersp ectiv e d escrib ed in S upplementary T able 1 carries o ver readily to m ul- tiple categories. The only differen ce is that we h a ve an add itional r ow f or eac h category . The multiple- catego r y in formation is equiv alen t to a (compli- cated) cross-cla ssification of genes, and a p erm utation of the { s g } , with the remaining tabulation fi xed, is enough to generate the full joint distribution of category statistics (Supplementa ry T able 2). Second, v alid and r eadily computed approximati ons to the joint distrib ution of category statistics are a v ailable. By restricting to mo d erate and large categories, Z scores are ap- pro x im ately m ultiv ariate norm al. Th e dep end ence is carried completely by b et w een-category correlations, w hic h can b e computed by basic r andom-set metho ds [see Newton ( 2007 )]. W e fin d that if Z 1 and Z 2 are standardized catego ry scores f or tw o categories of sizes m 1 and m 2 whic h h a ve an o v erlap of m 1 , 2 genes, then corr( Z 1 , Z 2 ) = Gm 1 , 2 − m 1 m 2 p m 1 m 2 ( G − m 1 )( G − m 2 ) . (7) F or large G , this is approximat ely m 1 , 2 / √ m 1 m 2 . In other w ords, d ep en- dence is indu ced by the o verla p of categorie s, and increases the larger is this o ve rlap. A full analysis of th e m u ltiple-categ ory testing pr oblem is b ey ond the scop e of this p ap er. Ho wev er, we illustrate the utilit y of the correlation form u la ( 7 ) and the multiv ariate normal appro ximation to describ e one p os- sible app roac h. Supp ose there are k catego r ies under study . On the global 16 M. A. NEWTON ET AL. Fig. 5. Power im b alanc e. L ar ge enriche d c ate gories may get a str ong Z sc or e by vi rtue of their size m mor e so than by the level of enrichment π C − π (p anel A ). The simpl e c orr e c- tion Z/ √ m pr ovides a r anking of inter esting c ate gories that is adjuste d for this size effe ct (p anel B ). Eleven c ate gories, includi ng GO:0019883 (r e d d ot), ha ve e nrichment sc or es exc e e ding 1 . 10 (dashe d li ne). These ar e signific ant at the 5% level by the maxT multiple testing c orr e ction c ompute d fr om a mul tivariate normal simul ation of c ate gory enrichment sc or es. T able 3 [ Supplementary material] li sts char acter istics of these 11 inter esting c ate- gories. n u ll of no enr ic hment for any category , the v ector ( Z 1 , Z 2 , . . . , Z k ) of enric h- men t statistics is appro ximately Gaussian with mean zero, unit v ariances and co v ariances in ( 7 ). Ideally w e w ould sim ulate the exact distribution by p ermuting gene scores as in the Supp lementary T able 2, b ut the Gaussian pro v id es a computational solution that is m ore con venien t, esp ecially with large k . By a Ch olesky factoriza tion of the known co v ariance matrix (ev en GENE SET ENRICHMENT 17 when it is less than f u ll rank), we can easily simulate the multi v ariate normal v ector. Sampled v ectors resp ect the joint distribu tion of scores, for instance, as affected b y category ov erlap, and provi de inpu t to v arious multi ple testing sc hemes. F or the NPC example, we rep ort r esults of the maxT pro cedur e [ Dudoit et al. ( 2003 )] when the catego ries are rank ed b y T = Z/ √ m to ac- commo date the effects of cate gory size on p o wer. F or eac h simulat ed v ector, w e computed the maximum of the T statistics across categorie s. Since we d id not get Z ’s by p erm u tation, w e did n ot need to recompute catego ry statis- tics; rather we simply con v erted the Z ’s to T ’s u sing th e category s izes. In the NPC example, 11 categories had a T v alue exceeding the 95th p ercen tile of the m axT n ull d istribution. A g lobal view of the r esu lts is in Figure 5 . Supp lemen tary T able 3 summarizes the 11 in teresting categories. 6. Discussion. In analyzing functional categories r elated to nasopharyn- geal cancer ti ssue, Sengupta et al. ( 2006 ) used the rand om-set enric hm en t metho d discussed h ere, with b oth binary select ions from gene-lev el scores and a v erages of gene-lev el scores. The Supplemen tary Material associated with th at pap er present ed the metho d; here, we ha v e amplified that discus- sion, deriv ed f ormulas ( 1 ) and ( 2 ) for standard ization, ev aluate d the metho d- ology empirically and theoretically , and pro vided comparativ e analyses. Evi- dence sh o ws that the prop osed category-scoring metho ds capture p reviously hidden comp on ents of th e enrichmen t signal. Results are also pro v id ed that guide sim ultaneous inference across m ultiple categories. The rand om-set calibration approac h is th e same one that u nderlies Fisher’s exact test for ind ep endence b et wee n the s elected gene list and the categ ory under study . T h e simplicit y of Fisher’s test makes it comp elling, b ut the test is limite d b y its fo cus on selecte d gene sets. T ransferring random-set calculatio ns to quan titativ e gene-lev el scores is complicated b y the fact that the Fisher-test h yp ergeometric distrib ution no longer applies; an in tractable distribution tak es its place. In deriving the r andom-set m ean and v ariance of a categ ory score, we offer an easily computed appr oximati on and standard- ized statistics for measuring category enr ic hm ent. This h as sev eral p ractical adv an tages o v er other schemes that use qu an titativ e scores. By condition- ing on r esults of the different ial expression analysis, our calculations can handle a wide v ariet y of output from that analysis and we n eed not re- visit the raw data. Metho ds su c h as in Barry , Nob el and W righ t ( 2005 ) and Subr amanian et al. ( 200 5 ) calibrate category scores b y recomputing the dif- feren tial expression resu lts o v er random p erm utations of ra w data. Not only can this b e limited when the num b er of microarra ys is small, bu t also the n u ll hypothesis at work for such a p erm utation is the exc h an geabilit y of microarra y lab els, which asserts the absence of any different ial exp ression. Insofar as en r ic hm ent concerns excess differen tial e xpression in a cat egory 18 M. A. NEWTON ET AL. rather than its abs en ce, the r an d om-set approac h may b e targeting enric h- men t more directly . Certainly the calibration is such that different asp ects of the enrichmen t s ignal are b eing detec ted b y the random-set approac h. F urther comparativ e analyses are w arr an ted. The issue of among-gene dep end ence is a sub tle one that is relev an t in enric h m en t calculations. The SAFE/GSEA p ermutation guards against ill- effects of suc h dep endence by shuffling microarray lab els a nd fi x in g whole profiles. Random-set scoring guard s against these effects by conditioning on results of the differential expression analysis; since { s g } are fixed, w hatev er factors caused th em to b e dep endent cannot enter the calculatio n. Th e fl ip side is that our in terpretation of random-set Z scores is fo cus ed on compar- ing th e category statistic in hand to its h yp othetical v alue from a random set (as opp osed to its v alue on some hypothetical reru n of the whole expres- sion stu dy). Indeed, th e dep endence th at in sampling th eory te rms would inflate th e v ariance of the category score and sp eak against random sets is precisely the dep endence that w e aim to d etect as the enric hmen t signal. Random-set calibration gains by its simp le in terpretation; still, one must tak e care that significan t fin dings are attribu table to b iologica lly relev an t enric h m en t r ather than to something spurious. In the con text of a lo cation-shift mo del for differentia l expression we com- pared t w o r andom-set metho ds in terms of their p o wer to d etect enrichmen t in a given category C . A clear p ictur e of the sub-optimalit y of eac h metho d is a v ailable, p ointing t o the b en efits of us in g sev eral metho ds tog ether to iden tify differen t asp ects of th e enrichmen t signal. When C co ntains lots of mo destly altered genes, then av eraging evidence f r om all genes in the cate- gory is more p o w erful than selection; when C is enriched just slightl y , but the alteration effect is high, then the use of selected genes is preferred . The random-set approac h b ecomes feasible in multi-ca tegory inf erence b e- cause v arious prop er ties can b e explicitly calculate d . Ranking cate gories b y their Z sco re norm alized by th e square ro ot of categ ory size giv es a ranking based on estimated enr ic hm ent. This partially addr esses th e problem that large categories that are enric hed at all will b e detected with high pr obabil- it y , contrary , p erhaps, to the aim to identify the most enriched catego r ies. The join t distribution of Z scores across m ultiple categories is ind uced by sh uffling in a certain con tingency table, and it is app ro ximately multiv ari- ate normal un der the complete null hyp othesis. Th e dep endence b et wee n scores is mediated b y the exten t of category o ve rlap [equation ( 7 )]. Multiple testing schemes can tak e adv an tage of this kno wn d ep end ence to assure the iden tifi cation of signifi cantly en r ic hed categories, though optimal schemes re- main to b e w orke d out. W e d emonstrated the s in gle-step maxT approac h in Section 5 and p ro du ced useful find ings for the NPC study . Refinemen ts are surely p ossible, either using stepwise app roac hes to con trol family-wise error or using one of th e metho ds f or false disco very rate con trol. It is tempting GENE SET ENRICHMENT 19 to conv ert th e Z scores to p -v alues and adopt one of these standard m u lti- ple testing adjustments, but size and dep end ence issues complicate a simple tec hnology transfer. F urther w ork in this direction ma y h elp to sort out re- p orting proto cols when, for instance, multiple n o des in one branc h of t he GO graph exhibit v arying degrees of enr ic hment. APPENDIX: SELECTIO N VS A VERA GING (THEOREM 1 ) Whic h category-te s ting appr oac h is more p o w erful depen d s on the sign of ∆ = τ sel − τ a v e , the difference b et wee n the Z -score critical v alues corre- sp ond ing to lev el α tests. Averagi ng is b etter if ∆ > 0; selection is b etter if ∆ < 0. Com b ining ( 5 ) and ( 6 ), ∆ = z α σ ( π ) σ ( π C ) − 1 − √ m ( π C − π ) µ 1 − µ 0 σ ( π C ) − δ , (8) where µ 0 = 1 − Φ( k ) is the mean of the Bernoulli trial 1[ s g > k ] when g is n ot differen tially expr essed , µ 1 = 1 − Φ( k − δ ) is the mean when g is d ifferen tially expressed, π C − π is the enr ic hment, δ is the effect of differen tial expression on s g , m is t he category size, Φ ( · ) is the standard normal cum ulativ e dis- tribution function, and σ 2 ( · ) is a v ariance function. In this treatment gene scores s g are random, and th e tests are marginal rather than cond itional. The thr eshhold k = k ( π , δ, ˜ α ) can b e c h osen to target a lev el ˜ α false dis- co v ery rate (FDR) o wing to prop erties of the function h ( x ) = 1 − Φ( x ) 1 − Φ( x − δ ) for eac h fixed δ > 0. By examining the deriv ativ e of h ( x ) and in vo king Mills’ ratio [e.g., Gordon ( 1941 )], one can pro ve the follo w ing: Lemma A.1. h ( x ) is monotone de cr e asing with lim x →∞ h ( x ) = 0 and lim x →−∞ h ( x ) = 1 . Th us, h ( x ) is inv ertible, and with fixed κ = ˜ απ / { (1 − ˜ α )(1 − π ) } ∈ (0 , 1), w e can certainly find k uniquely satisfying h ( k ) = κ . This k , fu r thermore, m u st define the th reshhold for the le v el ˜ α FDR gene-selectio n p ro cedur e, since, b y Ba y es rule, ˜ α = P ( H 0 | s g > k ) = µ 0 (1 − π ) µ 0 (1 − π ) + µ 1 π , (9) where µ 0 = 1 − Φ( k ) and µ 1 = 1 − Φ( k − δ ). Reorganizing ( 9 ), w e get the defining relation h ( k ) = µ 0 /µ 1 = κ . The 1–1 corresp ond ence b et ween µ 0 (or µ 1 ) and δ is further rev ealed through δ = Φ − 1 (1 − µ 0 ) − Φ − 1 (1 − µ 0 /κ ). Both 20 M. A. NEWTON ET AL. µ 0 and µ 1 con verge to 0 as δ → 0. As δ → ∞ , µ 0 → κ and µ 1 → 1 . Alwa ys µ 0 = κµ 1 . Supplement ary Figure 6 pr o vides another view of these ob jects. The b eha vior of the v ariance σ 2 ( π C ) = µ 0 (1 − µ 0 ) + π C { µ 1 (1 − µ 1 ) − µ 0 (1 − µ 0 ) } dep ends on the sign of the co efficient of π C . Indeed, there is a critical p oint µ 0 = κ/ (1 + κ ) < 1 / 2, wh en this co efficient equals 0, and σ 2 ( π C ) = κ/ (1 + κ ) 2 for all π C . F or µ 0 > κ/ (1 + κ ), σ 2 ( π C ) is decreasing in π C ; for µ 0 < κ/ (1 + κ ), it is i ncreasing in π C . Noting the 1–1 corresp ondence of δ and µ 0 , w e see the critical p oint o ccurs at δ = 2Φ − 1 ( 1 1+ κ ). Consider the first cla im on sup eriorit y of sele ction. W e seek conditions under wh ic h ∆ < 0 . Figure 4 su ggests lo oking at the case of large δ . With δ > 2Φ − 1 ( 1 1+ κ ), σ 2 ( π C ) is decreasing in π C , and so the fi rst term in ( 8 ) is p ositiv e but b ound ed ab o ve by z α σ ( π ) σ (1) − 1 > 0 . Being p ositiv e, th is term w orks against ha ving ∆ < 0 , but the te rm is fi- nite and not dep en d en t on category size m . Thus, the sec ond t erm in ( 8 ) dominates for sufficien tly large m , and will driv e ∆ < 0 as long as µ 1 − µ 0 σ ( π C ) > δ . (10) With the effect δ larger than the cr itical p oin t mentioned abov e, we ha ve σ 2 ( π C ) < σ 2 ( π ) < σ 2 (0) = µ 0 (1 − µ 0 ) < κ/ (1 + κ ) 2 and so ( 10 ) holds if µ 1 − µ 0 p κ/ (1 + κ ) 2 > δ . (11) Noting µ 1 = µ 0 /κ , rearranging ( 11 ) is equiv alen t to δ < κ + 1 √ κ 1 − κ κ µ 0 , and finally , noting µ 0 > κ/ (1 + κ ) in this case, we obtain the upp er b ound δ < 1 / √ κ − √ κ . T h us, we ha ve sufficient conditions establishing the sup eriorit y of selection ov er a ve raging in gene-set enric h men t. Numerically w e find the in terv al in Th eorem 1 is nonempt y for 0 < κ < 0 . 13 3. W e p ro ve the s econd claim similarly , and thus, in con trast to ( 10 ), w e seek conditions under whic h L = ( µ 1 − µ 0 ) 2 σ 2 ( π C ) < δ 2 . (12) GENE SET ENRICHMENT 21 The left-hand sid e L can b e simp lifi ed, n oting fi rst that µ 1 = µ 0 /κ and also that σ 2 ( π C ) = µ 0 { 1 + π C ( 1 κ − 1) } + O ( µ 2 0 ) as µ 0 → 0. Imm ediately w e obtain lim µ 0 → 0 L/µ 0 = (1 /κ − 1) 2 1 + π C (1 /κ − 1) < ∞ . On the other hand, if the right-hand sid e of ( 12 ) div er ges when normalized b y µ 0 , then the state d inequalit y m ust hold for an in terv al of sufficien tly small effects. Using Mills’ ratio, we find the threshh old k ≈ ( − log κ ) /δ for small δ and, consequen tly , µ 0 = 1 − Φ( k ) ≈ δ ( − log κ ) √ 2 π exp − 1 2 (log κ ) 2 δ 2 for small δ . Ev aluating fu r ther sh o ws that δ 2 /µ 0 div erges a s µ 0 → 0 , com- pleting the pro of. Computing notes. An R pac k age, al lez , w as dev elop ed to imp lemen t random-set enr ic hment calculations, esp ecially for GO categories. The source is a v ailable at h ttp://www.stat.wisc.edu/˜newton/ . Calculations r ep orted here used R [ R Dev elopmen t Core T eam ( 2005 )] ve rsion 2.1 and Bio con- ductor [ Gen tleman et al. ( 2004 )] p ac k age hug13 3p lu s2 version 1.10.0 , bu ilt Octob er 2005. Ac kn o wledgments. The authors gratefully ac kno w ledge supp ort from the National Cancer Institute (Grants CA64364, CA22443 and C A97944 ) a nd F ONDECYT (Grant s 1020712 and 1060729) , an d assistance pr ovided by Christina Kend ziorski (statistica l analysis), Allan Hildesheim (NPC molec- ular study co ordination), I.-Ho w Chen (NPC tissue sp ecimen collecti on), Chien-Jen Ch en, Y u-Juen Ch eng (NPC case-con trol stu dy field effort), Rob ert Gen tleman (catego r y analysis), Deepa yan Sark ar (R computing) and t wo anon ymou s referees for helpfu l commen ts. P . A. is a Ho w ard Hughes Medi- cal Institute In vestig ator. REFERENCES Al-Shahrour, F., Uria r te, R. D. and Dop azo, J. (2004). F atigo: A w eb to ol for fin ding significan t associations of gene on tology terms with groups of genes. Bioinformatics 20 578–580 . Barr y, W ., Nobel, A. and Wright, F. (2005). Significance analysis of functional cat- egories in gene expression studies: A structu red p ermutation ap p roac h . Bioinformatics 21 1943–1949. Bei ß bar th, T. and Sp eed, T. P. (2004). GOstat: Find statistically ov errepresented gene ontol ogies within a group of genes. Bioinformatics 20 1464– 1465. 22 M. A. NEWTON ET AL. Berriz, G. F., King, O. D., B r y ant, B., San der, C. and Roth, F. P. (2003). Char- acterizing gene sets with F uncA ssociate. Bioinformatics 19 2502– 2504. Bickel, P. J. and D oksum, K. A. (2001). Mathematic al Statistics . Prentice Hall, Engle- w o o d Cliffs, NJ. Cheng, J., Sun, S., Tracy, A., Hubb ell, E., Morris, J., V almeekam, V., Kim- br ough, A., C line, M. S. , Liu, G., S higet a, R . , Kulp, D. and R ose, M. A. (2004). NetAffx Gene Ontology Mining T ool: A visual app roach for microarra y data analysis. Bioinformatics 20 1462–1 463. Cochran, W . G . (1977). Sampling T e chniques , 3rd ed. Wiley , New Y ork–London–Sydney . MR0474575 Dodd, L., Se ngupt a, S., Chen, I.-H., d en B oon, J. A., Cheng, Y.-J., Chen, M., Westra, W., Ne wton, M. A., Mittl, B . F., McS hane, L., Ch en, C.-J., Ahlquist, P. and Hi ld e sheim, A. (2006). Genes in volve d in DNA repair and ni- trosamine metab olism and t h ose lo cated on chromo some 14q32 are dysregulated in nasopharyngeal carcinoma (NPC). Canc er Epidemiolo gy , Biomarkers and Pr evention 15 2216–2225. Doniger, S. W., Salomonis, N. , Kahlquist, K. D. , Vran izan, K., La wlor, S. C. and Conklin, B. R. (2003). MAPPFinder: Using gene ontology and GenMAPP to create a global gene-exp ression profile from microarra y data. Genome Biolo gy 4 R7. Dr ˇ aghici, S ., Kha tri, P., Mar tins, R. P., Ostermeier, G. C. and K ra wetz, S. A. (2003). Global functional p rofiling of gene expression. Genomics 81 98–104. Dudoit, S., Shaff e r, J. P. and Boldrick, J. C. (2003). Multiple hyp othesis testing in microarra y exp eriments. Statist. Sci. 18 71–103. MR1997066 Fisher, R. A. ( 1921). On the p robable error of a coefficient of correlation deduced from a small sample. Metr on 1 3–32. Gene Ontology Consor tium (2000). Gene Ontology: T o ol for the unification of b iology . Natur e Genetics 25 25–29. Gene Ontology Consor tium (2004). The gene ontolo gy (GO) database and informatics resource. Nucleic A cids R ese ar ch 32 D258–D261. Gentleman, R. C., Carey, V. J., Ba tes, D. M., Bolst ad, B., Dettling, M., Du- doit, S., Ell is, B ., Gautier, L., Ge, Y., Gentr y, J., Hornik, K., Hothorn, T ., Huber, W., Iacus, S., Iri zarr y, R., Li, F. L. C., Maechler, M., Ros sini, A. J., Sa witzki, G., Smi th, C., Smy th, G., Ti erney, L., Y ang, J. Y. H. and Zhang, J. (2004). Bio conductor: Op en softw are developmen t for computational b iology and bioinformatics. Genome Biolo gy 5 R 80. Gordon, R. D. (1941). V alues of Mills’ ratio of area to b ounding ordinate and of the normal probability integral for large val ues of the argument. Ann. Math. Statist. 12 364–366 . MR0005558 Kendziorski, C. M., Newton, M. A ., Lan , H. and G ould, M. N. (2003). On para- metric empirical Ba yes metho ds for comparing multiple groups using replicated gene expression profiles. Statistics in Me dicine 22 3899–3914 . Kha tri, P. and Dr ˇ aghici, S. (2005). Ontolog ical analysis of gene ex pression data: Cur- rent to ols, limitations, and op en problems. Bioinformatics 21 3587–3 595. Mootha, V. K. , Lindgren, C. M., Eriksson, K. F., Subram anian, A., Sihag, S., Lehar, J., Puigser ver, P., Carlsson, E., R idderstrale, M., Laurila, E. e t al. (2003). PGC-1 resp onsive genes inv olved in oxidativ e phosphorylation are co ordinately dow nregulated in human d iabetes. Natur e Genetics 34 267–273. Newton, M. A . (2007). A formula for th e correlation b etw een rand om- set enrichmen t scores. T ec hn ical R ep ort 1134, Dept. S t atistics, Univ . Wisconsin. GENE SET ENRICHMENT 23 R Development Core Team (2005). R: A L anguage and Envir onment for Statistic al Computing . R F oun dation for Statistical Computing, Vienna, Austria. Rhodes, D. R. and Chinna iy an, A. M. (2005). In t egrativ e analysis of the cancer tran- scriptome. Natur e Genet ics 37 (Sup pl.) 31–37. Sengupt a, S., den Boon, J. A., Chen, I.-H., Newton, M. A ., D ahl, D. B., Chen, M., Chen g, Y.-J., Westra, W. H., C h en, C.-J., Hi ld e sheim, A., Sugden, B . and Ahlquist, P. (2006). Genome-wide expression profiling reveals EBV-asso ciated inhibition of MHC class I ex p ression in nasopharyngeal carcinoma. Canc er R ese ar ch 66 7999–80 06. Storey, J. D. (2003). The p ositiv e false discov ery rate: A Ba yesi an interpretation and the q -v alue. A nn. Statist. 31 2013–2035. MR2036398 Subramanian, A., T ama yo, P., Mootha, V. K., Mukherje e, S., Eber t, B. L., Gillette, M. A., P aula vich, A., Pomero y, S. L., Golub, T. R., Lander, E. S. and Mesir ov, J. P. (2005). Gene set enric hm ent a nalysis: A knowledge-based ap- proac h for interpreting genome-wide ex pression profiles. Pr o c. Natl. A c ad. Sci. USA 102 15545–15550 . Vir t anev a, K. I., Wright, F. A., T anner, S. M., Yuan, B., Lemon, W. J., Caligiuiri , M. A., Bloomfield, C. D., de la Chapp elle, A. and Krahe, R. (2001). Expression p rofiling reveals fundamental biological differences in acute my eloid leukemia with isolated trisom y 8 and normal cy togenetics. Pr o c. Natl. Ac ad. Sci. USA 98 1124–1129. Zhong, S., Tian, L., Li, C., S tor ch, K.-F. and Wong, W . H. (2004). Comparativ e analysis of gene sets in the gene on tology space under the multiple hyp othesis testing framew ork. In Pr o c e e dings of the IEEE Computational Systems Bioinf ormatics Confer- enc e (CSB 2004) . M. A. Newton Dep ar tments of St a tistics and Biost a tistics an d Medical Informa tics University of Wisconsin–Madison 1300 University A venu e Madison, Wisconsin 53 706 USA E-mail: newton@stat .wisc.edu F. A. Quint a na Dep ar t am ento de Est ad ´ ıstica F acul t ad de Ma tem ´ aticas Pontificia Universidad Ca t ´ olica de Chile Casilla 306, Correo 22 Santiago Chile E-mail: quin tana@mat.puc.ci J. A. den Boon Institute for Molecular Virology and McArdle Labora tor y for Cancer Research University of Wisconsin–Madison 1525 Linden Driv e Madison, Wisconsin 53 706 USA E-mail: jden bo on@wisc.edu S. Sengu pt a WiCell Research Institute U.S. Ma il P.O. Box 73 65 Madison, Wisconsin 53707-736 5 USA E-mail: ssengupta@wicell.org 24 M. A. NEWTON ET AL. P. Ahlquist Institute for Molecular Virology and McArdle Labora tor y for Cancer Research and How ard Hug hes Medical Institute University of Wisconsin–Madison 1525 Linden Driv er Madison, Wisconsin 53 706 USA E-mail: ahlquist@wisc.edu
Original Paper
Loading high-quality paper...
Comments & Academic Discussion
Loading comments...
Leave a Comment