A bias correction for the minimum error rate in cross-validation
Tuning parameters in supervised learning problems are often estimated by cross-validation. The minimum value of the cross-validation error can be biased downward as an estimate of the test error at that same value of the tuning parameter. We propose …
Authors: Ryan J. Tibshirani, Robert Tibshirani
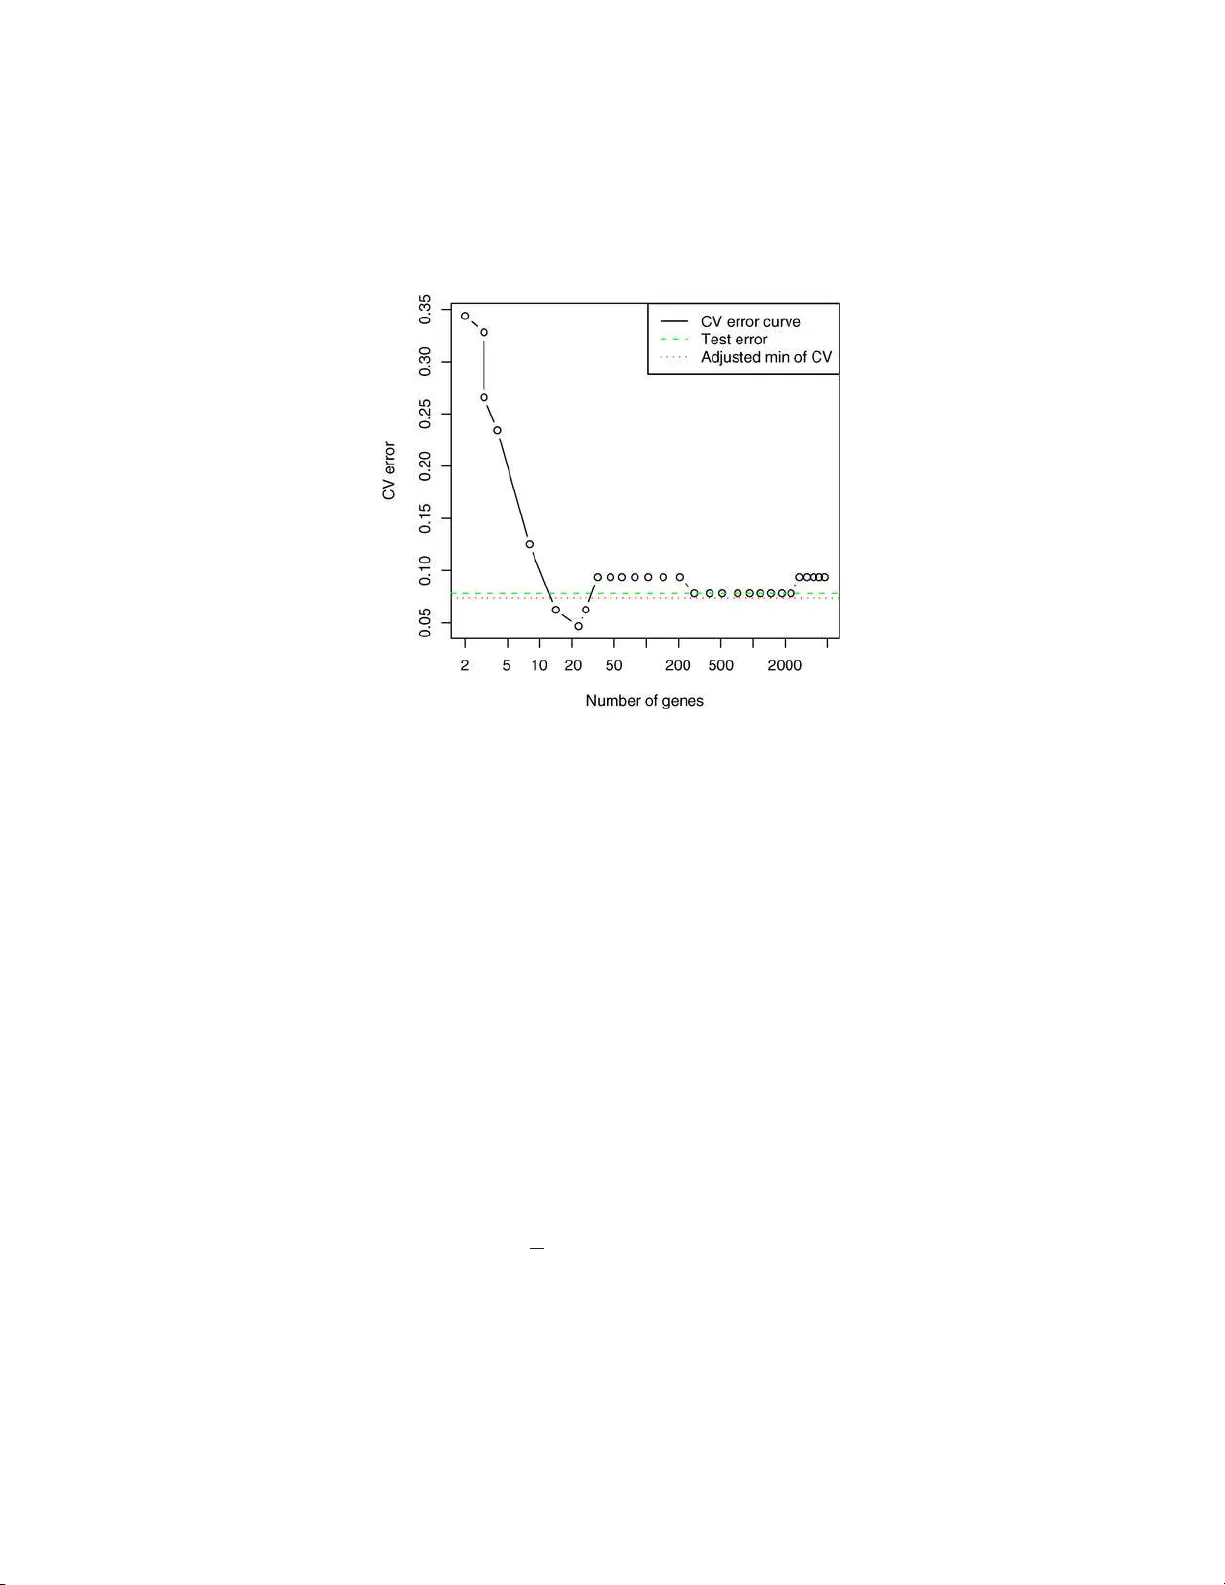
The Annals of Applie d Statistics 2009, V ol. 3, No. 2, 822–829 DOI: 10.1214 /08-A OAS224 c Institute of Mathematical Statistics , 2 009 A BIAS CORRECTION F OR THE MINIMUM ERROR RA TE IN CR OS S-V ALID A TION By R y an J. Ti bshirani 1 and R ober t Ti bshirani 2 Stanfor d U niversity and Stanfor d U niversity T u n ing parameters in s up ervised learning problems are of t en esti- mated by cross-v alidation. The min im um v alue of th e cross-v alidation error can b e biased down ward as an estimate of the test error at that same v alue of the tuning parameter. W e prop ose a simple meth od for the estimation of t h is bias that uses informa tion from the cross- v alidation p rocess. As a result, it requires essenti ally no additional computation. W e apply our b ias estimate to a number of p opu lar classifiers in v arious settings, an d examine its p erformance. 1. In tro d uction. Cross-v alidation is widely u s ed in regression and classi- fication pr oblems to c ho ose th e v alue of a “tuning parameter” in a p rediction mo del. By training and testing the mod el on separate subsets of th e data, w e get an idea of the mod el’s pred iction stren gth as a function of the tuning parameter, and w e c ho ose the parameter v alue to minimize the CV error curv e. T his estimate adm its many n ice p rop erties [see Stone ( 1977 ) for a discussion of asymptotic consistency and efficiency] and w orks well in p rac- tice. Ho we v er, the minim um CV error itself tends to b e to o optimistic as an estimate of true p rediction error. Many ha ve noticed this down wa r d bias in the minim um error rate. Breiman et al. ( 1984 ) ackno wledge this bias in the con text of classificatio n and regression trees. E f ron ( 2008 ) discusses this pr ob lem in the setting p ≫ n , and employs an empirical Ba ye s m etho d, whic h do es not in v olv e cross-v alidatio n in the c hoice of tu ning parameters, to a v oid suc h a bias. Ho wev er, the prop osed algorithm r equires an in itial Received Novem b er 2008; revised No vem b er 2008. 1 Supp orted by a National Science F ound ation V ertica l Integration of Graduate R e- searc h and Edu cation fello wship. 2 Supp orted in part by National Science F oundation Grant DMS-99-71405 and National Institutes of H ealth Con tract N01-HV-28183. Key wor ds and phr ases. Cross-v alidation, prediction error estimation, opt imism esti- mation. This is an electronic reprin t o f the original a rticle published b y the Institute of Mathematical Statistics in The Annals of Applie d Statistics , 2009, V ol. 3, No. 2, 822–829 . This r eprint differs from the original in pagination and t yp og raphic detail. 1 2 R. J. TIBSHI RANI AN D R. TIBSHI RANI c hoice for a “target error rate,” whic h complicate s matters by introd ucing another tuning parameter. V arma and Simon ( 200 6 ) suggest a metho d us- ing “nested” cross-v alidation to estimat e the true error r ate. This essent ially amoun ts to doing a cross-v alidat ion pro cedu re for ev ery data p oin t, and is hence impractical in settings where cross-v alidatio n is computationally ex- p ensive. W e prop ose a b ias correction for the minimum CV error rate in K -fold cross-v alidatio n. It is computed directly fr om the in d ividual error cur v es from eac h fold and, hence, do es not require a signifi can t amount of additional computation. Figure 1 sh ows an examp le. The data come from th e lab oratory of Dr. Pa t Bro wn of Stanford, consisting of gene expression measurements ov er 4718 genes on 128 patient samples, 88 from h ealth y tissues and 40 fr om CNS tumors. W e randomly d ivided the data in half, in to training and test samples, and applied the nearest shrun ken centroids classifier Tibshirani et al. ( 2001 ) with 10-fold cross-v alidati on, using th e pamr p ac k age in the R language. Th e figure sho ws the CV curve, with its minim um at 23 genes, ac hieving a CV error rate of 4 . 7%. Th e test err or at 23 genes is 8% . The estimate of the CV bias, us in g the metho d d escrib ed in this pap er, is 2 . 7%, y ieldin g an adjusted error of 4 . 7 + 2 . 7 = 7 . 4%. O v er 100 rep eats of this exp erimen t, the av erage test error w as 7 . 8%, and the a verag e adju sted CV error wa s 7 . 3%. In this pap er we stu dy the CV bias problem and examine the accuracy of our prop osed adj ustment on simulate d data. These examples suggest that the bias is larger wh en the signal-to-noise ratio is lo wer, a fact also n oted b y Efron ( 2 008 ). W e also provide a short theoretical sectio n examining the exp ectation of the b ias when there is no signal at all. 2. Mo del selection u s ing cross-v alidation. Supp ose we observ e n in de- p endent and iden tically distr ibuted p oin ts ( x i , y i ), where x i = ( x i 1 , . . . , x ip ) is a v ector of pr edictors, and y i is a resp ons e (this can b e real-v alued or discrete). F rom this “training” d ata w e estimate a p rediction mo del ˆ f ( x ) f or y , and w e ha ve a loss function L ( y , ˆ f ( x )) that measures the error b etw een y and ˆ f ( x ). T ypically , this is L ( y , ˆ f ( x )) = ( y − ˆ f ( x )) 2 squared error for regression, and L ( y , ˆ f ( x )) = 1 { y 6 = ˆ f ( x ) } 0–1 loss for classificat ion. An imp ortan t qu an tity is the exp ected pr ediction error E[ L ( y 0 , ˆ f ( x 0 ))] (also called exp ected test error). This is the exp ected v alue of the loss when BIAS IN CR OS S-V ALIDA TION 3 Fig. 1 . Br own micr o arr ay c anc er data: the CV err or curve is minimi ze d at 23 genes, achieving a CV err or of 0 . 047 . Me anwhile, the test err or at 23 genes i s 0 . 08 , dr awn as a dashe d line. The pr op ose d bias estimate is 0 . 027 , giving an adjuste d err or of 0 . 047 + 0 . 027 = 0 . 074 , dr awn as a dott e d l ine. predicting an indep enden t data p oin t ( x 0 , y 0 ), drawn from the same d is- tribution as ou r training data. Th e exp ectat ion is o ver all that is random [namely , the mo del ˆ f and the test p oin t ( x 0 , y 0 )]. Supp ose that our prediction mo del dep ends on a parameter θ , that is, ˆ f ( x ) = ˆ f ( x, θ ). W e w an t to select θ based on the training set ( x i , y i ) , i = 1 , . . . , n , in ord er to minim ize the exp ected prediction error. One of th e simplest and most p opular metho ds f or doing this is K -fold cross-v alidatio n. W e fir st sp lit our data ( x i , y i ) into K equal p arts. Then for eac h k = 1 , . . . , K , w e remo ve th e k th part from our d ata s et and fit a mo del ˆ f − k ( x, θ ). Let C k b e the indices of observ ations in the k th fold. The cross-v alidatio n estimate of the exp ected test error is CV( θ ) = 1 n K X k =1 X i ∈ C k L ( y i , ˆ f − k ( x i , θ )) . (1) Recall that ˆ f − k ( x i , θ ) is a function of θ , so w e compu te CV( θ ) o ve r a grid of parameter v alues θ 1 , . . . , θ t , and c ho ose the minimizer ˆ θ to b e our parameter estimate. W e call CV( θ ) the “CV error curv e.” 4 R. J. TIBSHI RANI AN D R. TIBSHI RANI 3. Bias correction. W e wo u ld lik e to estimate the exp ected test error using ˆ f ( x, ˆ θ ), namely , Err = E[ L ( y 0 , ˆ f ( x 0 , ˆ θ ))] . The naiv e estimate is CV ( ˆ θ ), ha ving bias Bias = Er r − CV( ˆ θ ) . (2) This is lik ely to b e p ositiv e, since ˆ θ w as c hosen b ecause it minimizes CV( θ ). Let n k b e the num b er of observ ations in th e k th fold, and define e k ( θ ) = 1 n k X i ∈ C k L ( y i , ˆ f − k ( x i , θ )) . This is the error curve computed from the p redictions in the k th fold. Our estimate us es the difference b et wee n the v alue of e k at ˆ θ and its minim um to mimic the b ias in cross-v alidation. Sp ecifically , w e prop ose the follo wing estimate: d Bias = 1 K K X k =1 [ e k ( ˆ θ ) − e k ( ˆ θ k )] , (3) where ˆ θ k is the minimizer of e k ( θ ). Note that this estimate uses only quan ti- ties that ha v e already b een computed for the CV estimate ( 1 ), and requires no new mo del fitting. Since d Bias is a mean o ver K folds, we can also use the stand ard error of the mean as an appro ximate estimate for its standard deviation. The adju sted estimate of test error is CV ( ˆ θ ) + d Bias. Note that if the fold sizes are equ al, then CV ( ˆ θ ) = 1 K P K k =1 e k ( ˆ θ ) and the adju sted estimate of test error is CV( ˆ θ ) + d Bias = 2 CV( ˆ θ ) − 1 K K X k =1 e k ( ˆ θ k ) . The in tuitive motiv at ion for the estimate d Bias is as follo ws: fir s t, e k ( ˆ θ k ) ≈ C V( ˆ θ ) since b oth are error cu r v es ev aluated at their minima; the latter uses all K folds, while the former u ses just fold k . Second, for fixed θ , cross-v alidatio n error estimates the exp ected test error, so that e k ( θ ) ≈ E[ L ( y , ˆ f ( x, θ ))] . Thus, e k ( ˆ θ ) ≈ Err. The second analogy is not p erfect: Err = E[ L ( y , ˆ f ( x, ˆ θ ))], where ( x, y ) is sto c hastically indep en d en t of the tr ainin g data, and hence of ˆ θ . In cont rast, the terms in e k ( ˆ θ ) are L ( y i , ˆ f − k ( x i , ˆ θ )) , i ∈ C k ; here ( x i , y i ) h as some d ep en- dence on ˆ θ since ˆ θ is c hosen to minimize the v alidation error across all folds, including the k th one. T o remo ve this d ep enden ce, one w ould ha ve to carry BIAS IN CR OS S-V ALIDA TION 5 out a new cross-v alidation for eac h of the K original folds, whic h is m u c h more computationally exp ensiv e. There is a similarit y b et ween the bias estimate in ( 3 ) and b o otstrap es- timates of bias in Efron ( 1 979 ) and Efron and Tibshirani ( 1993 ). Supp ose that w e h a ve d ata z = ( z 1 , z 2 , . . . , z n ) and a statistic s ( z ). Let z ∗ 1 , z ∗ 2 , . . . , z ∗ B b e b o otstrap samples eac h of size n d ra wn with r ep lacemen t from z . Then the b o otstrap estimate of bias is d Bias bo ot = 1 B B X b =1 [ s ( z ∗ b ) − s ( z )] . (4) Supp ose that s ( z ) is a functional statistic and hence can b e written as t ( ˆ F ), where ˆ F is the empirical d istribution fun ction. Then d Bias bo ot appro ximates E F [ t ( ˆ F )] − t ( F ), the exp ected bias in the original statistic as an estimate of the true p arameter t ( F ). No w to estimate the quan tity Bias in ( 2 ), w e could apply the b o otstrap estimate in ( 4 ). T his wo u ld entai l dra wing b ootstrap samp les and compu ting a n ew cross-v alidation curve from eac h sample. T hen we would compute the difference b et ween the min im u m of th e cu rv e and the v alue of curve at the training set m inimizer. In d etail, let C V( z ∗ , ˆ θ ( ˜ z )) b e the v alue of the cross-v alidatio n curve computed on the dataset z ∗ and ev aluated at ˆ θ ( ˜ z ), the minimizer for the CV cu r v e computed on data set ˜ z . Then the b o otstrap estimate of bias can b e expressed as 1 B B X b =1 [CV( z ∗ b , ˆ θ ( z )) − CV( z ∗ b , ˆ θ ( z ∗ b ))] . (5) The computation of this estimate is exp ensive, requiring B K -fold cross- v alidations, wh er e B is typical ly 100 or m ore. The estimate in d Bias in ( 3 ) finesses th is b y using the original cross-v alidation f olds to appro ximate the bias in place of the b o otstrap samples. In the n ext section w e examine the p erformance of our estimate in v arious con texts. 4. Application to sim u lated data. W e carried out a simulation stud y to examine the size of th e CV Bias, and the accuracy of our pr op osed adj ust- men t ( 3 ). The data w ere generated as standard Gaussian in t w o settings: p < n ( n = 400 , p = 100) and p ≫ n ( n = 40 , p = 1000). There were t wo classes of equal size. F or eac h of these we cr eated t w o settings: “no signal,” in wh ich the class lab els w er e ind ep endent of the features, and “signal,” where the mean of the fi rst 10% of the features w as shifted to b e 0.5 units higher in class 2. In eac h of these settings we app lied fiv e different classifiers: L D A (lin- ear discriminant analysis), S VM (linear su pp ort vect or mac hines), CAR T 6 R. J. TIBSHI RANI AN D R. TIBSHI RANI T able 1 R esults for pr op ose d bias c orr e ction for the mi nimum CV err or, using 10-fold cr oss-validation. Shown ar e me an and standar d err or over 100 si mulations, for five differ ent classifiers Metho d Min CV error T est error Adjusted CV error p < n No signal LDA 0.503 (0.003) 0.5 0.503 (0.003) SVM 0.4 85 (0.003 ) 0.5 0.511 (0.00 4) CAR T 0.474 (0.003) 0.5 0.510 (0.004) KNN 0.473 (0.002) 0 .5 0.524 (0.003) GBM 0.475 (0.003) 0.5 0.520 (0.003) Signal LDA 0.290 (0.003) 0.284 (0.001) 0.290 (0.003) SVM 0.2 57 (0.003 ) 0.260 (0.00 1) 0.279 (0.003) CAR T 0.356 (0.003) 0.378 (0.002) 0.384 (0.003) KNN 0.291 (0.003) 0 .284 (0.002) 0.305 (0.004) GBM 0.269 (0.002) 0.272 (0.002) 0.288 (0.003) p ≫ n No signal NSC 0.384 (0.009) 0.5 0.511 (0.012) SVM 0.4 75 (0.009 ) 0.5 0.498 (0.01 0) CAR T 0.498 (0.011) 0.5 0.500 (0.011) KNN 0.430 (0.007) 0 .5 0.577 (0.009) GBM 0.432 (0.010) 0.5 0.552 (0.012) Signal NSC 0.106 (0.006) 0.136 (0.004) 0.152 (0.008) SVM 0.1 42 (0.007 ) 0.138 (0.00 3) 0.157 (0.008) CAR T 0.432 (0.012) 0.432 (0.004) 0.437 (0.012) KNN 0.200 (0.007) 0 .251 (0.005) 0.297 (0.010) GBM 0.233 (0.008) 0.276 (0.006) 0.307 (0.010) (classificatio n and regression trees), KNN ( K -nearest n eigh b ors), and GBM (gradien t b o osting m ac hines). In the p ≫ n sett ing, th e LD A solution is not of fu ll rank, so we u s ed d iagonal linear discr im in an t analysis w ith soft- thresholding of the cen troids, kno wn as nearest shrunken cent roids (NSC). T able 1 shows the mean of the test error, m in im u m CV error (using 10- fold CV), true bias, and estimated bias, o ver 100 sim u lations. The standard errors are giv en in brac ket s. W e see that the bias tends to larger in the “n o signal” case, and v aries significan tly dep ending on the classifier. And it seems to b e sizable only when p ≫ n . The b ias adjustment is quite accurate in most cases, except for the KNN and GBM classifiers when p ≫ N , when it is too large. With only 40 observ ations, 10-fold CV has just four observ ations in eac h fold, an d this ma y cause erratic b eha vior for these highly n onlinear classifiers. T able 2 sho w s th e results for KNN an d GBM when p ≫ N , with 5-fold CV. Here the bias estimate is more accurate, but is still slightl y to o large. BIAS IN CR OS S-V ALIDA TION 7 5. Nonnegativit y of the bias. Recall Section 3 , where we in tro duced Bias = Err − C V ( ˆ θ ), and our estimate d Bias. It follo ws from th e definition that d Bias ≥ 0 alw a ys. W e show that for classification problems, E[Bias] ≥ 0 when there is n o signal. Theorem 1. Supp ose that ther e is no true signal, so that y 0 is sto chasti- c al ly indep endent of x 0 . Supp ose also that we ar e in the classific ation setting, and y 0 = 1 , . . . , G with e qual pr ob ability. Final ly supp ose that the loss is 0–1, L ( y , ˆ f ( x )) = 1 { y 6 = ˆ f ( x ) } . Then E[CV( ˆ θ )] ≤ Err . Pr oof. The pro of is quite straigh tforw ard . W ell Err = 1 − P( y 0 = ˆ f ( x 0 , ˆ θ )), where ˆ f ( · , ˆ θ ) is fit on the training examples ( x 1 , y 1 ) , . . . , ( x n , y n ). Sup p ose that m arginally P( ˆ f ( x 0 , ˆ θ ) = j ) = p j , for j = 1 , . . . , G . Then, by ind ep en- dence, P( y 0 = ˆ f ( x 0 , ˆ θ )) = X j P( y 0 = ˆ f ( x 0 , ˆ θ ) = j ) = X j 1 G p j = 1 G , so Err = G − 1 G . By the same argument , E[CV ( θ )] = G − 1 G for an y fixed θ . Therefore, E[CV( ˆ θ )] = E min i CV( θ i ) ≤ E[CV( θ 1 )] = G − 1 G , whic h completes the pr o of. No w supp ose that there is no s ignal and we are in the regression setting with squared error loss, L ( y , ˆ f ( x )) = ( y − ˆ f ( x )) 2 . W e conjecture that indeed E[CV ( ˆ θ )] ≤ E rr for a fairly general class of mo dels ˆ f . Let ( ˜ x 1 , ˜ y 1 ) , . . . , ( ˜ x n , ˜ y n ) denote n test p oin ts, indep endent of the training data and dr a wn from th e same distribution. Cons id er d oing cr oss-v alidation on the test set in order to determine a v alue for θ (just treating the test data lik e it we r e training data). Th at is, defin e g CV( θ ) = 1 n K X k =1 X i ∈ C k ( ˜ y i − ˜ f − k ( ˜ x i , θ )) 2 , T able 2 R esults for KNN and GBM when p ≫ N , wi th 5- fold cr oss-validation Classifier Setting Min CV er r or T est error Adjusted CV error KNN No signal 0.430 (0.007) 0.5 0.524 (0.009) KNN Signal 0.213 (0.007) 0.253 (0.005) 0.281 (0.009) GBM No signal 0.425 (0.008) 0.5 0.511 (0.010) GBM Signal 0.265 (0.0 08) 0.289 (0.007) 0.32 5 ( 0.010) 8 R. J. TIBSHI RANI AN D R. TIBSHI RANI where ˜ f − k is fit on all test examp les ( ˜ x i , ˜ y i ) except those in the k th fold. Let ˜ θ b e th e minimizer of g CV( θ ) ov er θ 1 , . . . , θ t . Th en E[CV ( ˆ θ )] = E [ g CV ( ˜ θ )] ≤ E [ g CV ( ˆ θ )] , where the fir st step is tru e b y symmetry , and the second is tru e b y definition of ˜ θ . But (assumin g for notational simplicit y that 1 ∈ C 1 ) E[ g CV( ˆ θ )] = E[( ˜ y 1 − ˜ f − 1 ( ˜ x 1 , ˆ θ )) 2 ], and we conjecture that E[( ˜ y 1 − ˜ f − 1 ( ˜ x 1 , ˆ θ )) 2 ] = E[ ( ˜ y 1 − ˆ f − 1 ( ˜ x 1 , ˆ θ )) 2 ] . (6) In tuitiv ely , since there is n o signal, ˜ f ( · , ˆ θ ) and ˆ f ( · , ˆ θ ) should predict equ ally w ell ag ainst a n ew example ( ˜ x 1 , ˜ y 1 ), b ecause ˆ θ should not ha v e an y real relation to predictiv e strength. F or example, if w e are doing ridge regression with p = 1 and K = n (lea ve- one-out CV), and w e assu me that eac h x i = ˜ x i is fixed (nonrandom), then w e can write out the mo del ˆ f − k ( · , θ ) explicitly . In this case, we can sho w ( 6 ) is equiv alen t to sho wing E[ y 1 | ˆ θ ] = E[ y 1 ] , E[ y 2 1 | ˆ θ ] = E[ y 2 1 ] and E[ y 1 y 2 | ˆ θ ] = E[ y 1 ]E[ y 2 ] . In words, the m ean and v ariance of y 1 are un c han ged b y conditioning on ˆ θ , and y 1 , y 2 are conditionally indep end ent giv en ˆ θ . These certainly seem tr u e when lo oking at simulat ions, bu t are hard to pro ve rigorously b ecause of the complicated relationship b et ween th e y i and ˆ θ . Similarly , w e conjecture that E[( ˜ y 1 − ˆ f − 1 ( ˜ x 1 , ˆ θ )) 2 ] = E[( ˜ y 1 − ˆ f ( ˜ x 1 , ˆ θ )) 2 ] , (7) b ecause there is no signal. If we could sho w ( 6 ) and ( 7 ), then w e w ould ha v e E[CV ( ˆ θ )] ≤ E [( ˜ y 1 − ˆ f ( ˜ x 1 , ˆ θ )) 2 ] = Err. 6. Discussion. W e ha v e prop osed a s imple estimate of the b ias of the minim um error rate in cross-v alidation. It is easy to compute, requiring es- sen tially n o additional compu tation after the in itial cross-v alidation. Ou r studies indicate that it is r easonably accurate in general. W e also found that the bias itself is only an issue when p ≫ N and its magnitude v aries consid- erably dep endin g on the classifier. F or this reason, it can b e misleading to compare the CV error rates w hen choosing b et w een mo dels (e.g., c h o osing b et w een NSC and SVM); in this situatio n the bias estimate is v ery imp or- tan t. Ac kn owledgmen ts. The authors w ould lik e to thank the Ed itor f or help- ful commen ts that led to impro vemen ts in the pap er. BIAS IN CR OS S-V ALIDA TION 9 REFERENCES Breiman, L., Fri edman, J., Olshen, R. and Stone, C. (198 4). Classific ation and R e- gr ession T r e es . W adsw orth, Belmont, CA. MR0726392 Efr on, B. (1979). Bootstrap metho ds: Another look at the jackknife. A nn. Statist. 7 1–26. MR0515681 Efr on, B. (2008). Empirical Bay es estimates for large-scale prediction problems. Av ailable at http://w ww-stat.stanford.edu/˜c kirby/brad/papers/2008EBestimates.pdf . Efr on, B. and Tibshirani, R. (1993). A n Intr o duction to the Bo otstr ap . Chapman & Hall, Lond on. MR1270903 Stone, M. (1977). Asymptotics for and against cross-v alidation. Bi ometrika 64 29–35. MR0474601 Tibshirani, R. , Hastie, T., Narasimhan, B. an d Chu, G . (2001). Diagnosis of m ultiple cancer types by shrunken centroids of gene expression. Pr o c. Natl. A c ad. Sci. 99 6567– 6572. V arma, S. and S imon, R. (2006). Bias in error estimation when using cross-v alidation for mo del selecti on. BMC Bi oi nformatics 91 . Dep ar tment of St a tistics St anford Un iversity St anford, California 9430 5-5405 E-mail: ryan tibs@stanford.edu HRP Redw ood Bldg St anford University St anford, California 9430 5-5405 E-mail: tibs@stanford.edu
Original Paper
Loading high-quality paper...
Comments & Academic Discussion
Loading comments...
Leave a Comment