Detection and localization of change-points in high-dimensional network traffic data
We propose a novel and efficient method, that we shall call TopRank in the following paper, for detecting change-points in high-dimensional data. This issue is of growing concern to the network security community since network anomalies such as Denia…
Authors: Celine Levy-Leduc, Franc{c}ois Roueff
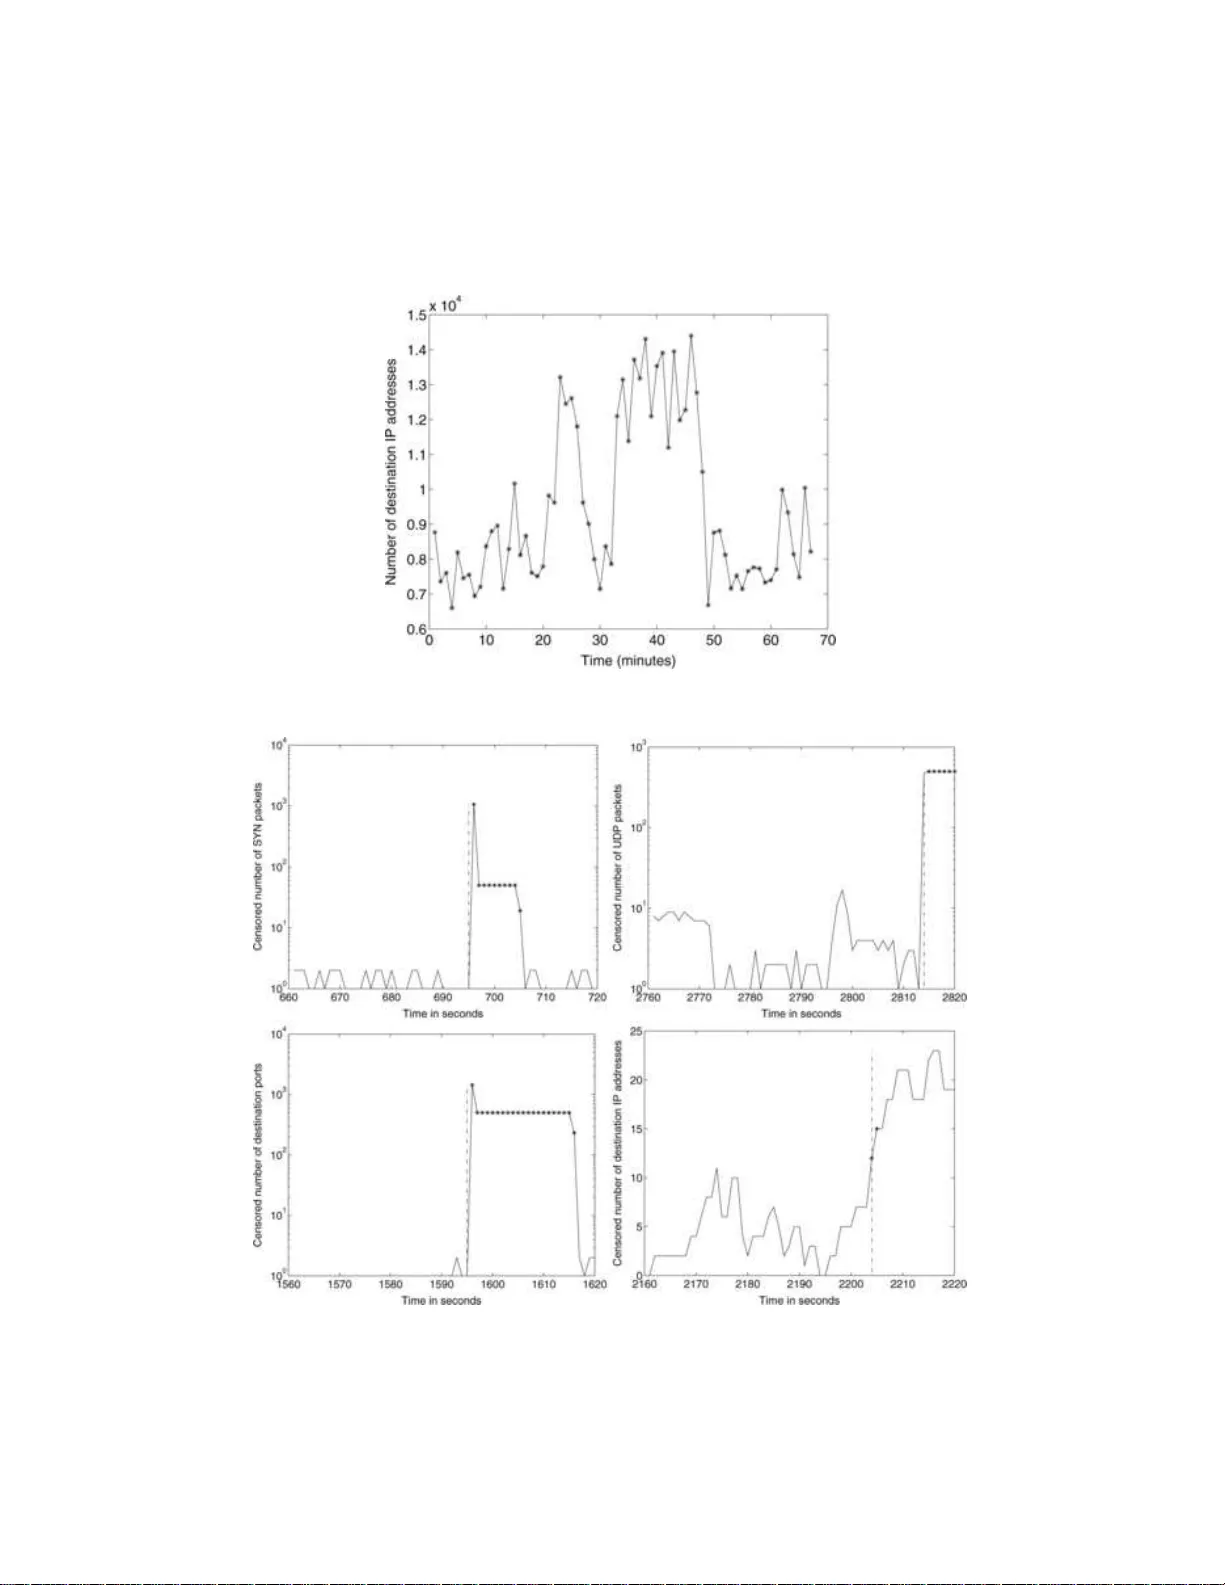
The Annals of Applie d Statistics 2009, V ol. 3, No. 2, 637–662 DOI: 10.1214 /08-A OAS232 c Institute of Mathematical Statistics , 2 009 DETECTION AND LOCALIZ A TION OF CHANGE-POINTS IN HIGH-DIMENSIONAL NETWORK TRAFFIC D A T A By C ´ eline L ´ evy-Leduc and Fran c ¸ ois Roueff CNRS, L TCI and T´ el´ ec om ParisT e ch W e propose a nov el and efficien t method , that we shall call T opR ank in the foll o wing p aper, for detecting change-points in h igh-dimensional data. This issue is of grow ing concern to th e net w ork securit y com- munit y since net work anomalies such as Denial of Service (DoS) at- tac ks lead to changes in Internet traffic. Our method consists of a data redu ction stage based on record fi ltering, follo wed by a non- parametric change-point detection test based on U -statistics. Using this approach, we can add ress massive data streams and p erform anomaly detection and localization on th e fly . W e show how it applies to some real Internet t raffic provided by F rance-T´ el ´ ecom (a F renc h Internet service provider) in the framew ork of th e ANR-RN R T OS- CAR pro ject. This approach is very attractiv e since it b enefits from a low computational load and is able to detect and lo calize several types of netw ork anomalies. W e also assess the p erformance of the T opR ank algorithm using synthetic data and compare it with alter- native approaches based on random aggregation. 1. In tro duction. Recen t attac ks on v ery p opular web sites such as Y a- ho o and eBa y , leading to a disrup tion of s ervices to users , hav e triggered an in creasing inte rest in netw ork anomaly detection. T ypical examp les in- clude Denial of Service (DoS) attac ks—a n et wo rk-based attac k in whic h agen ts in tent ionally saturate system r esources—and their distrib uted ver- sion (DDoS). Sin ce the aforemen tioned attac ks r epresen t s erious threats for computer net works, deve loping anomaly d etectio n systems for ensur ing the defense against them has b ecome a ma j or concern. Existing detection systems to d eal with DoS or DDoS attac ks are based on t wo different appr oac hes. Th e first one is a signatur e-based approac h whic h compares the observed patterns of the netw ork traffic with kno wn attac k templates. If the attac k b elongs to the set of kno w n attac ks listed in the Received Ap ril 2008; revised Decem b er 2008. Key wor ds and phr ases. Netw ork anomaly detection, c hange-p oint detectio n, rank tests, high-dimensional data. This is an electronic reprint of the origina l article published b y the Institute o f Ma thematical Sta tistics in The A n nals of Applie d Statistics , 2009, V o l. 3, No. 2, 6 3 7–66 2 . This reprint differs from the origina l in pagination and typo g raphic detail. 1 2 C. L ´ EVY-LEDUC AND F. ROUEFF database, then it can b e su ccessfu lly detected: Snort and Bro dev elop ed b y Ro esc h ( 1999 ) an d Paxso n ( 19 99 ), resp ectiv ely , are t w o examples of su c h anomaly detection s y s tems. The ob vious limitation of th is appr oac h is that the signature of the an omaly has to b e kno wn in adv ance. The second detec tion system is based on statistical tools which do not require an y prior information ab out the kind of anomalies we are faced with. As a consequence, this appr oac h aims at detecting anomalies wh ic h do not b elong to a prescrib ed d atabase. It r elies on the f act that an oma- lies in net w ork traffic lead to abru pt c h anges in some n et wo rk charac ter- istics. W e choose those c haracteristics according to the t yp e of attac ks w e are lo oking for. These c hanges o ccur at unkn o wn time instants and ha ve to b e d etected as so on as p ossible. Detecting an att ac k in the n et- w ork tr affic can thus b e describ ed as a c h ange-p oin t detection problem, whic h is a classical iss ue in statistics. The d etectio n can either b e p er - formed with a fixed dela y (batc h approac h ) or with a minimal a ve rage dela y (sequen tial approac h). W e refer to Basseville and Nikiforo v ( 1993 ), Bro dsky and Darkhovsky ( 1993 ), C s¨ orgo and Horv ath ( 1997 ) and th e ref- erences therein for a complete o verview of th e existing m etho ds in stati stical c hange-p oint d etectio n. The most widesp read change-point detection tec hn ique in the field of net work anomaly d etection is the cum u lated su m (CUSUM) algorithm whic h w as first prop osed b y P age ( 195 4 ). The C US UM algorithm has already b een used b y W ang, Zh an g and S hin ( 20 02 ) and Siris and P apagalou (2004) for detecting DoS attac ks of the TCP (T ransmission Con trol Proto col) SYN flo o ding t yp e. Su c h an attac k consists in exploiting the TCP th ree-w a y hand- shak e mec h anism and its limitation in main taining half-op en connections. More precisely , when a server receiv es a SYN p ack et, it returns a SYN/A CK pac ket to the clien t. Until the SYN/A CK pac k et is ac kno wledged by the clien t, the connectio n remains h alf-op ened for a p erio d of at most th e TCP connection timeout. A bac klog qu eu e builds up in the system memory of the serv er to main tain all half-open connections, p ossibly leading to a saturation of the serv er. In Siris and P ap agalou (2004 ) , the authors us e the CUSUM algorithm to lo ok for a c h ange-p oin t in the time series corresp onding to the sum of receiv ed SYN pac k ets b y all the destination IP addresses whic h ha v e b een r equested. With suc h an approac h, it is only p ossible to set off an alarm when a c h ange o ccurs in the aggrega ted series, but it is imp ossible to pick out the malicious flo ws . T aking into accoun t the pr evious defin ition of a TCP/SYN flo o d ing t yp e attac k, it would b e natural, in ord er to ident ify the I P add resses inv olv ed in the attac k, to analyze the time series corresp ondin g to the n umb er of TCP/SYN pac ke ts receiv ed b y eac h IP add r ess, to apply to eac h of th em a c hange-p oin t detection test and to sa y that it is attac k ed if the test sets off an ala r m. Th is idea is used in T artak o vs k y et al. ( 2006a , 2006b ), who DETECTION AND LOCALIZA TION O F CHANGE-POINTS 3 prop ose a m ultic h annel d etectio n p ro cedure whic h is a refined v ersion of the previously quoted algorithms: it make s it p ossible to detect c hanges which o ccur in a c han n el and which could b e obscu red by the normal traffic in the other c hannels if global statistic s w ere used. Note that these metho ds only fo cus on the num b er of TC P/SYN pack ets receiv ed by a giv en destination IP address an d n ot on th e num b er of TCP/SYN pac kets s ent by a giv en source IP address to a giv en destination IP address. Applying a c hange- p oint detecti on test to the latter time s eries to detect an anomaly is b oun d to f ail b ecause of sp o ofing , a metho d used by attac ke rs which mak es th eir IP add ress app ear as a ran d om addr ess on th e Internet. Op erators seeking to und erstand and manage their net works are increas- ingly lo oking at wide-area-net work traffic fl o ws. In th is framework, pre- vious metho ds are b ound to failure since the quan tit y of data to ana- lyze is to o massiv e. Ind eed, eac h flow is c haracterized by 5 fields: sour ce and destination I P addresses, source and destination p orts and proto col n u m b er, which pro duces a v ery large d atabase to store and stu dy . In or- der to detect anomalies in such massive data s treams within a reason- able time span, it is imp ossible to analyze the time series of all the IP addresses receiving TCP/SYN pac k ets. That is w h y dimension reduction tec hniques hav e to b e used. Two main appr oac hes ha ve b een prop osed: some of them are based on Principal Comp onent An alysis (PCA) tec h- niques [see Lakhina, Cr o ve lla and Diot ( 2004 )] and others on r andom ag- gregatio n (sketc hes); see Krishnamurth y et al. ( 2003 ) and Li et al. ( 200 6 ). Lo calizati on of the anomalie s is p ossible with the second app r oac h using hash table inv ersion tec hn iqu es; see Salem, V aton and Gra v ey ( 2007 ) and Abry , Borgnat and Dew aele ( 2007 ). In this pap er w e prop ose a no ve l algorithm for detecting c hange-p oints in a multi-dimensional time series ( N ∆ i ( t )) t ≥ 1 , i ∈ { 1 , . . . , D } , und er computa- tional constrain ts w hic h allo w u s to pro cess the data on the fly , eve n for a high dimension D . Our metho d can b e u sed f or identifying DoS and DDoS attac ks as w ell as PortScan and NetScan in Int ernet traffic in cases wh ere we are faced with massiv e data streams. More precisely , we can identify anoma- lies of the follo wing t yp es: TCP /S YN flo o d ing, UDP fl o o ding, P ortScan and NetScan. UDP flo o din g is an attac k similar to TCP/SYN flo o d ing wh ich aims at saturating the memory of a destination IP address by sen ding a lot of UDP pack ets. A P ortScan consists in s ending TCP pac k ets to eac h p ort of a mac hine to kno w whic h ones are op en . In a NetScan attac k, a source IP address sends pac ket s to a large n um b er of IP addresses in order to detect th e mac h ines whic h are connected to the net work. T he p r oblem of c hange-p oint detection in h igh-d imensional data mainly concerns the n et- w ork security communit y but, in our view, it is a challe nging issue which will b enefit a broader aud ience. 4 C. L ´ EVY-LEDUC AND F. ROUEFF Let u s n o w giv e an outline of this pap er. S ection 2 describ es the framework of our study . In S ection 3 w e describ e the different method s that w e p rop ose to d etect change- p oin ts in a multi-dimensional time series under computa- tional constraints. These approac hes are b ased on t w o d ifferent d im en sion reduction tec hniques: T opR ank uses record filtering, whereas HashR ank is based on random aggregation. T he detect ion stage uses a nonparametric c hange-p oint detection test based on U -statistics. More precisely , we used rank tests f or censored data as prop osed and analyzed in Gom bay and Liu ( 2000 ). The corresp onding algorithms hav e b een wr itten in C language [for T opR ank , see L ´ evy-Leduc, Benmammar and Roueff ( 2008 )] and applied to real datasets corresp onding to some Internet tr affic pr o vided by F rance- T ´ el ´ ecom (a F renc h Internet Service Pro vider) within the framew ork of the ANR-RNR T OSCAR pro ject. In Section 4 w e app ly the T opR ank algorithm to a set of real Internet traffic p r o vided b y F rance-T´ el ´ ecom whic h con tains SYN fl o o ding t yp e attac ks in ord er to explain how to choose the most rel- ev an t parameters. In Section 5 T opR ank is app lied to a set of real data con taining sev eral t yp es of attac ks: S YN flo o ding, UDP fl o o ding and also P ortScan and NetScan. Our researc h indicates that our metho d can b e used to analyze a v ery large amoun t of data an d to detect net wo rk anomalie s on the fly . The metho ds T opR ank and HashR ank are finally compared firs t from a theoretical p oin t of view on a to y example in Section 6 and then with Mon te Carlo exp eriments on synthetic data in S ection 7 . 2. Description of the d ata. In Net wo rk applications the ra w data consists of Netflo w t yp e data collecte d at sev eral p oin ts of the Inte rnet net work and put into a single Netflow t yp e table. The d ata at our d isp osal includ es the source and destination IP addresses, the source and destination p orts, th e start time and the end time of the flow, as w ell as th e proto col and the n u m b er of exc hanged pac ke ts. I n th e case of the TC P proto col, the num b er of pac k ets of eac h type (SYN, S YN/A CK, FIN, RST) is a v ailable. Dep ending on the t yp e of attac k that one wa n ts to detect, some time indexed traffic c haracteristics are of particular in terest and hav e to b e pro- cessed for d etection pu rp oses. F or instance, in the case of the TCP/SYN flo o ding, the quan tit y of int erest is th e num b er of TCP/SYN pac kets re- ceiv ed by eac h destination IP address p er unit of time. W e denote by ∆ the smallest time unit us ed for building time series from our ra w Netflo w t yp e data. The time series are built as follo ws: in the case of TCP /S YN fl o o ding, we shall denote by N ∆ i ( t ) th e n u m b er of TCP/SYN pac ket s receiv ed b y the destination IP ad d ress i in the sub-in terv al in dexed b y t of size ∆ seconds. The corresp ond in g time series of the destination IP addr ess i will thus b e ( N ∆ i ( t )) t ≥ 1 . In th e case of UDP flo o ding, N ∆ i ( t ) will b e defined as the num b er of UDP pac k ets receiv ed by the destination IP addr ess i in the t th sub-interv al of size ∆ seconds. F or a Po r tScan, we DETECTION AND LOCALIZA TION O F CHANGE-POINTS 5 shall tak e as N ∆ i ( t ) the num b er of different requ ested destination p orts of the destination IP address i in the t th s ub-int erv al of size ∆ seconds and for a NetScan, it w ill b e the num b er of different r equ ested destination IP addresses by the source IP address i . F or Scan attac ks, the source address is reliable ( sp o ofing cannot b e used) since the attac k ers wish to receiv e pac ke ts resp ond in g to their requests. Our goal is now to pro vide algorithms for detecting c hange-p oints in the time series ( N ∆ i ( t )) t ≥ 1 for eac h i ∈ { 1 , . . . , D } un der computational con- strain ts whic h mak e it p ossible to p ro cess the d ata on the fly , ev en for a high dimension D . F or in stance, in the case of TCP/SYN flo o ding, D is the n u m b er of destination IP addr esses app earing in the raw d ata and can b e h u ge, u p to sev eral thousand addresses within a minute and sev eral million within a few da ys. F or con ve nience, in the follo wing we will dr op the sup erscript ∆ in the notation N ∆ i ( t ). 3. Description of the metho d s. W e shall only consider batc h metho ds in the follo wing. The traffic is analyzed in s uccessiv e observ ation wind o ws, ea c h ha ving a d uration of P × ∆ seconds, f or some fixed intege r P . A decision concerning the presence of p oten tially attac ke d IP addresses is made at the end of eac h observ ation w indo w and we also iden tify the IP add resses in volv ed. T he v alue of D then corresp onds to the n u m b er of d ifferen t i encoun tered in the observ atio n windo w of time length P × ∆ seconds. A crude solution for detecting c hange-p oints in the time series ( N i ( t )) 1 ≤ t ≤ P w ould b e to apply a change-point detection test to eac h time series ( N i ( t )) 1 ≤ t ≤ P for all i ∈ { 1 , . . . , D } . Since D can b e h u ge ev en in a giv en observ ation win- do w (see Figure 3 in Section 4.1 ), w e are faced in practice with massiv e d ata streams leading to the construction and the analysis of sev eral thousand s of time series ev en for short observ ation p erio d s (around 1 minute). T o o v er- come this d ifficult y , a data red u ction stage must precede the c hange-p oin t detection step. In the follo w ing, w e prop ose t w o different d ata reduction mec hanisms: record filtering and random aggregat ion (sk etc h es). In short, the record fil- tering will select the hea vy-hitters among the fl ows inv olv ed and pr o cess them, while the rand om aggregat ion will construct and pro cess sev eral (ran- domly chosen) linear com bin ations of all the flows. Random aggregation is currentl y the dimension reduction mec hanism whic h is the most u sed in the net work securit y comm unity . Nev ertheless, w e b eliev e that for the pur- p ose of change-point detection, in particular, if the change- p oin ts in v olve a massiv e increase, record filtering wo uld b e a more efficie n t alternativ e. A t fir st glance, random aggregation has the adv ant age of pro cessing all the data. Ho w ever, h ea vy-hitters are mixed with man y other fl ows, whic h ma y smo oth the c hange-p oin ts and resu lt in p o or detectio n. On the other hand , 6 C. L ´ EVY-LEDUC AND F. ROUEFF hea vy-hitters are selected w ith high probabilit y in r ecord filtering and their c hange-p oints are more like ly to b e detected. T o supp ort this idea, w e d e- riv e a to y problem related to th is qu estion in Section 6 and p erform some n u merical exp erimen ts on syn th etic data in Section 7 . As for the c hange-p oint detect ion step, we p rop ose u sing nonparamet- ric tests based on U -statistics wh ic h d o not requir e an y p rior in formation concerning the distribution of the time series constru cted after the dimen- sion redu ction step. Su ch an approac h is of particular in terest for dealing with In tern et traffic data, for whic h th er e is a lac k of commonly accepted parametric m o dels. In the follo wing we shall r efer to record filtering follo wed by a nonpara- metric c h ange-p oin t detection test as the T opR ank algorithm and wh en the record filtering stage is replaced by r andom aggrega tion, the HashR ank al- gorithm. Both algorithms are fu rther describ ed b elo w. 3.1. The T opRan k metho d. The T opR ank alg orithm can b e split into three steps describ ed h ereafter. Note that the follo wing pr o cessing is p er- formed in eac h observ ation window of length P × ∆ seconds and that all the stored data is erased at the end of eac h observ ation w in do w. Step 1 ( R e c or d filtering ). The main dimension r ed uction takes place in this step. In eac h sub-interv al in dexed by t ∈ { 1 , . . . , P } of d uration ∆ sec- onds of the observ ation windo w, we k eep the indices i of the M largest N i ( t ) and lab el them as i 1 ( t ) , . . . , i M ( t ) in such a wa y that N i 1 ( t ) ( t ) ≥ N i 2 ( t ) ( t ) ≥ · · · ≥ N i M ( t ) ( t ). In the follo wing we shall d enote by T M ( t ) the follo w in g set: T M ( t ) = { i 1 ( t ) , . . . , i M ( t ) } . In other words, for all t ∈ { 1 , . . . , P } , # T M ( t ) = M and ∀ i ∈ T M ( t ) an d ∀ j / ∈ T M ( t ) , N i ( t ) ≥ N j ( t ) . W e str ess that, in order to p erf orm the follo wing steps, w e only need to store the v ariables { N i ( t ) , i ∈ T M ( t ) , t = 1 , . . . , P } . Step 2 ( Cr e ation of c ensor e d time series ) . In this stage we shall bu ild censored time series to b e analyzed in the last step. F or a given in dex i , the corresp ondin g time series is censored sin ce it is p ossib le that for a giv en t in { 1 , . . . , P } , i do es not b elong to the set T M ( t ). In this ca se its v alue N i ( t ) is not a v ailable and is censored using the upp er b oun d N i M ( t ) ( t ) = min i ∈T M ( t ) N i ( t ). More form ally , the censored time series is defined b y ( X i ( t ) , δ i ( t )) 1 ≤ t ≤ P , (1) DETECTION AND LOCALIZA TION O F CHANGE-POINTS 7 where, f or eac h t ∈ { 1 , . . . , P } , X i ( t ) = ( N i ( t ) , if i ∈ T M ( t ), min j ∈T M ( t ) N j ( t ) , otherwise, δ i ( t ) = 1 , if i ∈ T M ( t ), 0 , otherwise. The v alue of δ i ( t ) tells us if the co rresp ond ing v alue X i ( t ) has b een cen- sored or not. Observe that, by definition, δ i ( t ) = 1 implies X i ( t ) = N i ( t ) and δ i ( t ) = 0 imp lies X i ( t ) ≥ N i ( t ). In practice, the censored time series are only b uilt for indices i selected in the fi rst step, that is, i ∈ S P t =1 T M ( t ). How ev er, man y suc h time series will b e highly censored. Hence, we p rop ose an additional dimens ion reduction whic h consists in considerin g only the indices i ∈ P [ t =1 T M ′ ( t ) , where M ′ ∈ { 1 , . . . , M } is a c hosen parameter. Step 3 ( Change-p oint dete ction test ). I n Gom bay and Liu ( 2000 ) a nonparametric statistical change- p oint detection metho d is prop osed to an- alyze censored data, as w ell as a wa y of computing its p -v alues. It is a nonparametric rank test using a score fun ction (den oted by A in the fol- lo wing) whic h w as first introdu ced by Gehan ( 1965 ) and Man tel ( 1967 ) in their generalizatio n of Wilco xon’s rank test for censored data. W e apply this test to eac h time series created in Step 2 . Note that eac h of these time s er ies is remov ed when the analysis in a give n observ ation window is complete. With suc h an appr oac h, up to M ′ × P time series of length P are pro cessed in eac h observ ation w in do w of time length P × ∆ seconds. Let us no w fur ther describ e the statistical test that w e p erform. This pro cedure aims at testing from the observ ations ( X i ( t ) , δ i ( t )) 1 ≤ t ≤ P built in the pr evious step if a change o ccurred in the time series ( N i ( t )) 1 ≤ t ≤ P for a giv en i . More precisely , if we drop th e s u bscript i for con ve nience in the description of the test, the tested h yp otheses are as follo ws: ( H 0 ): “ { N ( t ) } 1 ≤ t ≤ P are indep endent and iden tically d istributed rand om v ariables.” ( H 1 ): “Ther e exists some r suc h th at ( N (1) , . . . , N ( r )) and ( N ( r + 1) , . . . , N ( P )) hav e a d ifferen t distribu tion.” Let us now describ e the test statistic that w e use. F or eac h s, t ∈ { 1 , . . . , P } , w e defin e the follo w in g: 8 C. L ´ EVY-LEDUC AND F. ROUEFF • A s,t = 1 ( X ( s ) > X ( t ) , δ ( s ) = 1) − 1 ( X ( s ) < X ( t ) , δ ( t ) = 1), where 1 ( E ) = 1 in the ev ent E an d 0 in its complemen tary set, • U s = P P t =1 A s,t , s = 1 , . . . , P , • S t = ( P t s =1 U s ) / ( P P s =1 U 2 s ) 1 / 2 , t = 1 , . . . , P . W e sh all u se W P = max 1 ≤ t ≤ P | S t | (2) as a test statistic. Since, und er ( H 0 ) [see Gom bay and Liu ( 20 00 )], W P d − → B ⋆ = sup 0 0, Pval ( b ) = P ( B ⋆ > b ) = 2 ∞ X j =1 ( − 1) j − 1 e − 2 j 2 b 2 , b > 0 . The last equalit y is giv en in Gom bay and Liu ( 20 00 ). These results can b e pro ved by remarking th at the numerator of S t is a U -statistic an d the d enom- inator is the normalization which en sures the con v ergence in d istribution of W P . All these results are pr o ve d in detail in Liu ( 1 998 ) and Mido dzi ( 2 001 ), under s p ecific assum ptions. Then, for a giv en asymptotic leve l α ∈ (0 , 1), w e reject ( H 0 ) when Pval ( W P ) < α. (3) In the rejection case, the c h an ge-p oin t instant is giv en b y ˆ t P = Argmax 1 ≤ t ≤ P | S t | . 3.2. The HashRan k metho d. In this appr oac h w e pr op ose another metho d to p erf orm the d ata r eduction stage based on hash functions. As explained previously , th e follo w ing pro cessing is p erformed in ea c h observ ation w indo w of length P × ∆ seconds and all the stored data is erased at the end of eac h observ ation win do w. Step 1 ( Filtering using hash functions ). Let u s define a hash table with L rows and K columns . W e consider L hash functions h ℓ , ℓ = 1 , . . . , L , eac h taking its v alue in { 1 , . . . , K } . T o eac h entry ( ℓ, k ) ∈ { 1 , . . . , L } × { 1 , . . . , K } of the hash table is associated the list L ℓ,k of the ind ices i whic h are hashed in to this en try and a time series ( X ℓ,k ( t )) 1 ≤ t ≤ P defined by X ℓ,k ( t ) = X i 1 ( h ℓ ( i ) = k ) N i ( t ) , t = 1 , . . . , P . DETECTION AND LOCALIZA TION O F CHANGE-POINTS 9 Step 2 ( Change-p oint dete ction test ). W e p erform a statistic al c h an ge- p oint detection test on eac h of the time series previously obtained. Let us denote by C the set of cells ( ℓ, k ) , ℓ ∈ { 1 , . . . , L } , k ∈ { 1 , . . . , K } , of the hash table in wh ic h a change occur red. The test statistic th at w e use is the same as the one explained in Section 3.1 (nonp arametric rank tests), except that the terms related to the censorship are r emo ve d. Step 3 ( Inversion of the h ash table ). Assuming that a time series ( N i ( t )) 1 ≤ t ≤ P whic h conta ins a c hange-p oint will yield a c h ange-p oin t in the L time series ( X ℓ,h ℓ ( i ) ( t )) 1 ≤ t ≤ P , ℓ = 1 , . . . , L, w e classify i as an anomaly if a change -p oin t has o ccurr ed in the time series asso ciated to the cell ( ℓ, h ℓ ( i )) for all ℓ ∈ { 1 , . . . , L } . In p ractice, the set of suc h in dices is obtained from the lists L ℓ,k and the set C d efined in the previous steps as follo ws: \ 1 ≤ ℓ ≤ L L C ℓ , where L C ℓ = [ k :( ℓ,k ) ∈C L ℓ,k . Sev eral t yp es of hash fun ctions can b e consid er ed in the first step, b ut we shall only fo cus on random hashing b ecause of its lo w computational load. W e shall use 4-universal hashing f unctions f or wh ic h a fast implemen tation is describ ed in Thorup and Zhang ( 2004 ). Suc h f unctions are used since they are known to en sure a small n um b er of collisions (a collision o ccur s when the L different hashin g f unctions h a ve the same outpu t when applied to tw o different indices i ). Collisions may yield a false alarm durin g S tep 3 describ ed ab o ve. More pr ecisely , f ollo wing Abr y , Borgnat and Dew aele ( 2007 ), we shall tak e as hash fu nctions the follo wing ( h ℓ ) ℓ =1 ,...,L : h ℓ ( x ) = 1 + 3 X j =0 a j,ℓ x k mo d p ! mo d K , (4) where x is a 32-bit intege r (making this method particularly w ell suited for the hashing of IP addresses), and p is the Mersenne prime n um b er 2 61 − 1. As for the ( a j,ℓ )’s, they are pick ed randomly in { 0 , . . . , p − 1 } with in dep endent outputs from one hash fu n ction to another. 4. Application to real d ata with attac ks of S YN flo o d ing t yp e. In th is section we giv e the results of the T opR ank algorithm wh en it is applied to some real Inte rnet traffic provided by F rance-T´ el ´ ecom within the framew ork of the ANR-RNR T OSCAR pro ject and w e giv e some hints ab out the c hoice of the different parameters in vol v ed. 10 C. L ´ EVY-LEDUC AND F. ROUEFF This data corresp ond s to a recording of 118 min u tes of ADSL (Asymmet- ric Digital Sub scrib er Line) and Pe er-to-Pe er (P2P) traffic to wh ich some TCP/SYN flo o din g typ e attac ks ha ve b een added. Figure 1 (left) displays the total n u m b er of TCP pac ke ts r eceiv ed eac h second b y the different re- quested IP addresses. The n u m b er of TCP /S YN p ack ets recei v ed b y the four attac k ed d estination IP ad d resses are displa yed on th e r igh t in Figure 1 . As w e can see in this figur e, the first attac k o ccurs at around 2000 seconds, the second at around 4000 seconds, the third at around 6000 seconds and the last one at around 6500 seconds. F r om Figure 1 , we can see that w e are faced with massive data streams and th at the attac ks are completely hidden in TCP traffic and thus difficult to d etect. 4.1. Choic e of p ar ameters. As describ ed ab o ve, Step 1 (the record filter- ing step) and Step 2 (the creation of the censored time series) of the T opR ank algorithm rely on sev eral parameters ( P , ∆ , M for Step 1 and M ′ for Step 2 ). As for Step 3 (the c h ange-p oin t detection test), it do es not requir e the tun- ing of an y parameters. The m ain ob jectiv e of the first t w o steps is to cop e with h igh dimensionalit y and th e requirement s of real time implementat ion. The c hoice of th e parameters must satisfy these requirements as well as a reasonable a v erage detection dela y and a relev ant selection of the time se- ries to b e pro cessed in the sub s equen t detection step. In the follo wing, we giv e some guid ance regarding p arameter selection in the conte xt of Net work anomaly d etectio n. Since a decision concerning the presence of attac ks is made at th e en d of eac h observ ation wind o w, the maximal detection delay is giv en by the time length of the observ ation windo w, that is, P × ∆ seconds. The a v erage Fig. 1. Numb er of TCP p ackets exchange d and numb er of TCP/SYN p ackets r e c eive d by the 4 attacke d IP addr esses. DETECTION AND LOCALIZA TION O F CHANGE-POINTS 11 detection d ela y is then giv en b y P × ∆ / 2 seconds (t y p ically ab out 30 seconds in the con text of Net work anomaly detection). On ce the a v erage d etectio n dela y h as b een c h osen, one sh ould c h o ose P as large as p ossible und er the constrain ts of real time data pro cessing for a giv en maximal num b er of tests to p erform within the observ ation w indo w . Indeed, a large P ensures a b etter statistica l consistency . On the other h an d , the test statistic W P in ( 2 ) has an O ( P 2 ) computational complexit y . Giv en the computational limits of a standard computer, w e chose P = 60 in order to allo w up to 10 3 time series to b e pr o cessed within a 1 minute observ ation win do w. Let u s no w explain the c h oice of M , whic h sets the censorship lev el. In- deed, the n umb er of TCP/SYN pac k ets receiv ed b y the M th most requested mac hine corresp onds to a thr eshold ab o v e whic h an IP address ma y app ear as p oten tially attac k ed. F rom the d ata, we remark th at 99% of the observ ed v alues of th is threshold are at most 10 when M = 10 and at most 5 for M = 20. In the applications to real data, w e c hose M = 10 to allo w us to capture flo ws with significan tly high tr affic rates (10 pac k ets p er second) while ensu ring a lo w cost in terms of memory storage. Recall that a M × P data table ( X i ( t ) , δ i ( t )) 1 ≤ t ≤ P, 1 ≤ i ≤ M has to b e stored durin g the first and second step. W e no w commen t on the choi ce of the p arameter M ′ in { 1 , . . . , M } . T ak- ing M ′ = 1 means that we only analyze the IP add resses i having, at least once in an observ ation w indo w , the largest N i ( t ). T aking M ′ = M means that the detection s tep is applied to th e censored time series of all IP ad- dresses i which hav e b een selected in the filtering step. Hence, increasing M ′ increases th e num b er of analyzed censored time series. Figure 2 d ispla ys the n umber of time series wh ich are ac tually b uilt in Step 2 of T opR ank after th e fi ltering stage of Step 1 for different v alues of M ′ : M ′ = 1, M ′ = 5 and M ′ = M = 10 when w e are looking for TCP/SYN flo o din g t yp e attac ks. Figure 3 displa ys the num b er of differen t destination IP addresses ev ery min ute of the traffic trace. Comp arin g Figure 2 with Figure 3 , w e see that Steps 1 and 2 of the T opR ank algorithm app ear to b e necessary to pro vid e an implement ation feasible on the fl y . Indeed, applying Step 3 to eac h IP address ev ery m in u te wo u ld p ro duce an excessive computational load. As for the statistica l p erformance of the metho d with resp ect to the parameter M ′ , w e shall see in the follo wing section that the parameter M ′ do es not significan tly change the results in terms of false alarm an d detection rates. 4.2. Performanc e of the metho d. W e now inv estigate the p erformance of the T opR ank algorithm with the follo wing parameters: P = 60, ∆ = 1 s, M = 10 and M ′ = 1. Using these parameters, the a v er age detection dela y is 30 seconds. 12 C. L ´ EVY-LEDUC AND F. ROUEFF Fig. 2. Numb er of analyze d time series every minute when M ′ = 1 (“ ∗ ”), M ′ = 5 (“ o ”) and M ′ = M = 10 (“ + ”). 4.2.1. Statistic al p erformanc e . First, note th at with the previous c hoice of p arameters the attac ked IP addresses hav e b een iden tified when the upp er b ound of the p -v alue α introd uced in Step 3 of T opR ank is such that α ≥ 2 × 10 − 6 . Figure 4 displa ys the censored time series (Step 2 of T opR ank ) of the four attac ke d IP addresses. T h ese censored time series are d ispla yed in the first observ ation window in which the algorithm detects the anomaly . W e also d ispla y with a ve rtical line th e instant wh ere the c hange is detecte d. Re- Fig. 3. Numb er of destination I P addr esses every minute. DETECTION AND LOCALIZA TION O F CHANGE-POINTS 13 mem b er that the uncensored time series of th ese 4 IP add resses are display ed in Figure 1 (r ight). The T opR ank part of T able 1 gives the smallest p -v alue ab ov e whic h the corresp ondin g attac k is detected, as w ell as the num b er of false alarms. The num b er of f alse alarms corresp onds to the n u m b er of IP addr esses for whic h an alarm is triggered bu t which are differen t f r om the attac ke d IP addresses. F or in stance, the first attac k is detecte d if α ≥ 10 − 8 [see ( 3 )] and the asso ciated num b er of false alarms is equal to 3. I f M ′ = 5 or M ′ = M = 10, the results r emain un c hanged except for the third attac k for which the n u m b er of false alarms equals 10 in stead of 9. In T able 1 we also giv e the results obtained from the same data with a metho d pr op osed by Siris and Papag alou (2004 ) . This algorithm us es the CUSUM algorithm to lo ok for a change -p oin t in the time series corresp ond- ing to the sum of r eceiv ed S YN pac k ets b y all the destination IP addresses whic h ha ve b een requested. F or eac h observ ation window of 60 seconds, an alarm is set off when the statistic g n defined in equatio n (6) of Siris and Fig. 4. Censor e d time series of the 4 attacke d IP addr esses, wher e the vertic al li nes c orr esp ond to the dete cte d change-p oint instants and the unc ensor e d values ar e displaye d with stars (“ ∗ ”). 14 C. L ´ EVY-LEDUC AND F. ROUEFF T able 1 Statistic al p erformanc e for dete cting the 4 suc c essive SYN flo od ing attac ks displaye d on the right-hand side of Fi gur e 1 . The attacks c onsist in sending SYN p ackets to a given destination IP addr ess. In the top r ow the intensity (numb er of SYN p ackets p er se c ond) of e ach attack is given. In the T opRank p art of the table, the displaye d p-values ar e the smal l est ones that ensur e the dete ction of the attack by the T opR ank algorithm and b elow that the c orr esp onding numb er of false alarms in the whole tr affic tr ac e is given. In the SP p art of the table [ SP is the metho d devise d by Siris and Pap agalou (2004) ], the h r ow gives the smal lest thr eshold values that ensur e the dete ction of e ach attac k. In the last r ow the c orr esp onding numb er of false al arms i s di splaye d Number of S YN pack ets 1000 500 200 50 T opR ank p -v alues 10 − 8 10 − 10 2 × 10 − 6 10 − 12 Number of false alarms 3 1 9 0 SP h 5 6.5 9.7 16.34 Number of false alarms 69 65 62 22 P apagalou (2004 ) is greater than a thr eshold h at least once in the w in- do w. Th is quantit y g n dep end s on tw o parameters α and β . W e use the same v alues as Siris and Papaga lou (2004 ) , namely , α = 0 . 5 and β = 0 . 98, to obtain the results displa y ed in T able 1 . W e observe that the T opR ank alg o- rithm allo ws us not only to retriev e th e attac ked destination IP add resses, but also seems to p erform b etter in terms of false alarm rate. This suggests that aggrega ting traffic flo w s resu lts in a p o or detectio n of malicio us fl o ws, esp ecially when the normal tr affic is h igh. Indeed, a close lo ok sh o ws that the normal traffic is particularly high du ring the first attac k, w hic h explains wh y the corresp onding threshold v alue is the lo west (and the false alarm r ate the h ighest) although this attac k is the m ost inte nse. W e shall in vestiga te the comparison b etw een record filtering and aggregation filtering fu rther, in Sections 6 and 7 , in terms of inf orm ation loss and detection p erformance resp ectiv ely . T o compute the n um b er of false alarms, w e h a ve considered that the attac k ed IP addr esses we r e only th ose for whic h an attac k w as generated, but it is p ossible that th e und erlying ADSL and P2P traffic con tains some other attac ks. Figure 5 displa ys the censored time series of some IP add resses whic h we re considered to b e false alarms in th e T opR ank p art of T ab le 1 , as w ell as the time instan t wher e a c hange was detected (v ertical line). Ho w ever, if w e r efer to their time series, these IP addresses could b e consid er ed as b eing attac k ed. Thus, the results sh o wn in T able 1 hav e b een compu ted in the most un fa vorable w a y for th e algorithms. 4.2.2. Numeric al p erforma nc e. As w e h a ve seen, th e T opR ank algorithm seems to giv e satisfactory results from a statistical p oint of v iew. Moreov er, DETECTION AND LOCALIZA TION O F CHANGE-POINTS 15 Fig. 5. Censor e d time series f or IP addr esses c onsider e d as fal se alarms, wher e the vertic al lines c orr esp ond to the dete cte d change-p oint instants and the unc ensor e d values ar e displaye d with stars (“ ∗ ”). with M = 10, M ′ = 1 , and P = 60, applying the T opR ank algorithm tak es only 1 min ute and 19 seconds to p ro cess the w hole tr affic trace of 118 min- utes, when lo oking for T C P/SYN flo o ding typ e attac ks with a computer ha ving the follo wing configur ation: RAM 1 GB, C PU 3 GHz. 5. Application to real d ata with sev eral kinds of attac ks. In th is sectio n w e shall sho w th at th e T opR ank algorithm can not only detect SYN flo o ding t yp e attac ks but also an y other kind of attac ks, su c h as UDP flo o ding, P ortScan and NetScan attac ks. As we shall see in the follo wing, the T opR ank algorithm ca n detect, iden tify the anomaly and also provide the IP addr esses in volv ed. The r eal data of this section has b een p ro vided by F rance-T ´ el ´ ecom In- ternet Ser v ice Pro v id er w ithin the framew ork of the ANR-RNR T OSCAR pro ject. It corresp ond s to a recording of 67 min utes of ADSL and P2P traffic to whic h some attac ks of the follo win g t yp es, S YN fl o o ding, UDP flo o d ing, P ortScan and NetScan, h a ve b een added. The top of Figure 6 d ispla ys th e total n u m b er of T CP pac ke ts, as wel l as the n umb er of T CP p ac k ets r eceiv ed b y the destination IP address attac ked b y a P ortS can. The bottom of Figure 6 displa ys the to tal n um b er of pac k ets, as w ell as the n u m b er of pac ket s sent b y the sour ce IP address generating a NetScan attac k. In Figure 6 w e can see, as in Section 4 , that the attac ks are completely hidden in the total traffic and th us difficult to detect. 5.1. Choic e of p ar ameters. The previous data has b een pro cessed using the same p arameters as th ose used in Section 4 : P = 60, ∆ = 1 s, M = 10 and M ′ = 1. Note that the reduction stage (Step 1 of T opR ank ) is also 16 C. L ´ EVY-LEDUC AND F. ROUEFF Fig. 6. Numb er of exchange d p ackets f or PortSc an and NetSc an attac ks. necessary for the analysis of this dataset. Indeed, in Figure 7 , whic h displa ys the num b er of d ifferen t d estination IP add resses eac h minute of the traffic trace, we can see that Step 3 cannot b e app lied to eac h IP addr ess at every min ute in a reasonable computational time. 5.2. Performanc e of the metho d. 5.2.1. Statistic al p erformanc e . First, note th at with the previous c hoice of p arameters the attac ked IP addresses hav e b een iden tified when the upp er b ound of the p -v alue α introd uced in Step 3 of T opR ank is such that α ≥ 10 − 11 for the Po rtScan, α ≥ 10 − 6 for the UDP flo o d ing, α ≥ 0 . 000 6 for the SYN fl o o ding and α ≥ 0 . 04 for the NetScan. Figure 8 displa ys the censored time series (Step 2 of T opR ank ) of the at- tac k ed IP addr esses in the case of SYN fl o o ding, UDP flo o ding and P ortS can, as w ell as the censored time series of the s ou r ce IP add ress generating the attac k in the case of NetScan. T hese time series are display ed in the firs t DETECTION AND LOCALIZA TION O F CHANGE-POINTS 17 Fig. 7. Numb er of destination I P addr esses e ach minute. Fig. 8. Censor e d time series of the attack e d IP addr esses, wher e the vertic al li nes c orr e- sp ond to the dete cte d change-p oint i nstants and the unc ensor e d values ar e displaye d wi th stars (“ ∗ ”). 18 C. L ´ EVY-LEDUC AND F. ROUEFF T able 2 Statistic al p erformanc e of the T opR ank al gorithm f or dete cting sever al typ es of attacks. In the se c ond r ow ar e displaye d the smal lest p -values that ensur e the dete ction of the PortSc an, SYN flo o ding, UDP flo o di ng and NetSc an typ e atta cks r esp e ctively. In the last r ow, the c orr esp onding numb er of false alarms i s given Po r tScan SYN flo o di n g UDP floo ding NetScan p -v alues 10 − 11 6 × 10 − 4 10 − 6 0.04 Number of false alarms 3 127 136 378 observ ation win do w in which th e algorithm detects the anomaly of the cor- resp ond in g typ e. W e also displa y with a ve rtical line the instan t w here the c hange is detected. T h e detection time dela y is equal to around 1 min ute for the SYN flo o din g, 5 seconds for the UDP flo o d ing, 30 s econds for the P ortScan and 20 seconds for the NetScan. W e can see from Figur e 8 th at the rank test for censored data describ ed in Step 3 of T opR ank can d etect sev eral typ es of c hanges: sudd en incr ease, slo w increase and several types of m agnitude of c han ges. T able 2 giv es the smallest p -v alue ab o v e whic h th e corresp onding attac k is detected, as w ell as the n um b er of false alarms. The num b er of false alarms corresp onds to the n u m b er of IP addr esses for w h ic h an alarm is triggered b y the T opR ank algorithm bu t w hic h are d ifferen t from the attac k ed IP addresses. F or instance, the Po rtScan attac k is d etected if α ≥ 10 − 11 and the associated num b er of false alarms is equal to 3. T o compute the num b er of false alarms, w e ha v e considered, as previously , that th e attac ked IP addresses w ere on ly those for whic h an attac k w as gen- erated, bu t it is p ossible that the bac kground ADSL and P2P traffic con tains some other attac ks. Figure 9 displa ys the censored time series of some IP addresses wh ich we re considered to b e false alarms in the computation of T able 2 in the case of the SYN fl o o ding, UDP fl o o ding and NetScan, as well as the time instan t wher e a c h ange w as detected (v ertical line). Since these IP addresses could b e considered as b eing attac ked, the results of T able 2 are computed in th e most unfa vorable w a y for our algo rithm. This is a ma jor p roblem for comparing algorithms on m assive d ata streams. Th e issue is that without p r op erly lab eled d atasets, comparisons cannot b e p er- formed using standard metho d s suc h as R OC (Receiv er Op erating Charac- teristic) curv es. A second difficult y is to distinguish the relativ e merits of the filtering step and those of the detection step. Finally , a third difficult y arises in the s p ecific case of Net wo rk anomaly detection: In ternet traffic is kno w n to b e b urst y , with loads v arying quite a lot o v er the day . Hence, the p erfor- mance observ ed on a 2 hour dataset cannot b e generalized without caution, esp ecially for metho ds that rely on the c h oice of n umerous parameters. The parameters of th e filtering step can b e interpreted in term s of d imension DETECTION AND LOCALIZA TION O F CHANGE-POINTS 19 Fig. 9. Censor e d time series for IP addr esses c onsider e d as false alarm in the c ase of SYN and UDP flo o ding (top: left and right r esp e ctively) and in the c ase of NetSc an (b ot- tom). The vertic al lines c orr esp ond to the dete cte d change-p oint instants and the unc en- sor e d values ar e di splaye d wi th stars (“ ∗ ”). reduction rate and are th u s easier to compare. Th is is muc h more difficult as far as the detection step is concerned, since the p arameters often n eed to b e adapted to the statistical c haracteristics of th e tr affic data b eing studied. The metho ds prop osed by Krishnamurth y et al. ( 2003 ), Li et al. ( 2006 ), Salem, V aton and Gra vey ( 200 7 ) and Abry , Borgnat and Dew aele ( 2007 ) all use as a dimens ion redu ction tec hnique random aggregatio n (sketc hes) whic h enables th em to w ork on the fl y . All these metho ds use either outlier detection, or C USUM in their c h ange d etectio n step, with sev eral parameters (in add ition to the test threshold) th at need to b e fine-tuned. In pr actice, b ecause of th e high v ariabilit y of the loads within on e da y , th e c hoice of these parameters migh t require some exp ertise. In con trast, our detection step is purely n onparametric. Since it is based on rank s tatistics, it only requires c ho osing a threshold of the p -v alue under which an alarm is set off. In Section 7 w e shall compare our filtering steps with r andom ag gregatio n filtering on synthetic datasets whic h are completely lab eled. 20 C. L ´ EVY-LEDUC AND F. ROUEFF 5.2.2. Numeric al p erformanc e. As we ha v e seen, this metho d seems to giv e satisfactory results from a statistica l p oin t of view. Moreo ve r, with M = 10 , M ′ = 1 , and P = 60, applying the T opR ank algorithm tak es on ly 1 minute and 30 seconds to pro cess the w hole traffic trace of 67 minutes, when lo oking for S YN flo o d ing, UDP fl o o ding, PortSca n and NetScan, with a computer h aving the follo win g confi gu r ation: RAM 1 GB, C P U 3 GHz. This make s the implemen tation of the T opR ank algorithm v ery realistic in detection systems pro cessing d ata on the fly , ev en for very in tens e traffic data. 6. A to y p roblem comparin g record and aggregation metho ds. I n this section w e briefly in tro d uce and solve a to y prob lem to compare the effects of record filtering and rand om aggregation on data dimension reduction in a simplified framew ork. W e ha ve considered these t wo data reduction metho d s in the first steps of th e T opR ank and HashR ank algorithms, whic h aim at detecting an increase of one (or sev eral) comp onents of a D -dimens ional time series for a large D . F or detecting such anomalies, one has to b e able to infer from the reduced data, at eac h time instant , that one of the comp onents is indeed large. W e consider this inference problem in a case where all the comp onen ts hav e th e same kn o wn distribution, except p ossibly one, whose distribution is ob tained b y m u ltiplying b y a scale factor θ − 1 ≥ 1. Hence, we are in a standard p roblem of estimating a scalar parameter θ . T o compare the theoretical merits of the tw o d ata reduction m etho ds, w e simply ev aluate the Fisher information related to the t wo d ifferent observ ations. More precisely , let X 1 , . . . , X D b e D indep endent rand om v ariables with p ositiv e v alues suc h that, among them, D − 1 admit the same densit y p ( x ) and one admits the densit y θ p ( θ x ) with θ ∈ (0 , 1]. W e shall compare the Fisher information associated with the p arameter θ for tw o differen t obs er - v ations: 1. The observ ation ob tained by data dimension redu ction using simple r ecord filtering: Y D = max k =1 ,...,D ( X k ) . (5) 2. The observ ation obtained by d ata dimension red u ction u sing simp le ran- dom aggrega tion filtering: Z D = D X k =1 X k . (6) The distribu tions of Y D and Z D are b oth parametrized b y θ . W e will denote the corresp onding densities b y f D ,θ and g D ,θ resp ectiv ely , and the corre- sp ondin g Fisher inf ormation qu an tities [see Bic k el and Doksum ( 1976 )] b y I D ( θ ) = V ar( ∂ θ log f D ,θ ( Y D )) and J D ( θ ) = V ar ( ∂ θ log g D ,θ ( Z D )) . DETECTION AND LOCALIZA TION O F CHANGE-POINTS 21 Supp ose that p is 2 times con tinuously differen tiable, h as its su pp ort in [0 , 1] and th at E ˙ p p ( X ) 2 < ∞ , where ˙ p denotes the deriv ativ e of p and X a random v ariable with densit y p . W e claim that, for any θ ∈ (0 , 1), as D → ∞ , I D ( θ ) → V ar(( θ ∨ X )( ˙ p/p )( θ ∨ X )) θ 2 and J D ( θ ) ∼ D − 1 ( E [ X ]) 2 θ 4 V ar( X ) , (7) where a ∨ b = max( a, b ). Remark 1. Since I D ( θ ) ≍ 1 and J D ( θ ) ≍ D − 1 , this result clearly sho ws that, for large D , record fi ltering is adv antage ou s fr om an inf orm ation p oint of view in comparison with aggrega tion filtering. Ho wev er, the fact that p has compact su pp ort is crucial in this result. W e b eliev e that I D w ould ha ve differen t asymptotic b eha vior if other assumptions were mad e on the tail distribution of X . Ho w ever, w e lea ve this question op en for future w ork. Let us giv e some simple arguments to supp ort our claims. It is easy to sho w that, as D → ∞ , Y D d − → 1 ∨ ( X/θ ) . W e admit that this con verge nce in d istribution can b e strengthened to estab- lish that the Fish er inf orm ation I D tends to the one asso ciated to the limit distribution. T h e limiting distribution h as d ensit y t 7→ θ p ( θ t ) / R 1 θ p ( u ) du with a su pp ort in [0 , 1 /θ ] and the corresp onding Fisher inform ation is equal to V ar ((1 ∨ X/θ ) ˙ p p ( θ ∨ X )). Hence, the left-hand side of ( 7 ). Denote σ 2 = V ar( X ) and µ = E [ X ] and ˜ Z D = ( √ D − 1 σ ) − 1 ( Z D − ( D − 1) µ ). O bserv e that the Fisher information asso ciated with the observ ation ˜ Z D is the same as for Z D . T he cen tering and n ormalization is c hosen so that th e sum of the ( D − 1) i.i.d. X i ’s in Z D is appr o ximately N (0 , 1). The remaining X i is then divided b y √ D − 1 and thus is n egligible as D → ∞ , ˜ Z D d − → U with U ∼ N (0 , 1) . In con trast w ith the p revious case, as D → ∞ , the asymptotic distrib ution do es n ot dep end on θ . This is why J D ( θ ) → 0, as D → ∞ . T o obtain an equiv alen t as in ( 7 ), w e use ˆ Z D = U + ( θ √ D − 1 σ ) − 1 X 22 C. L ´ EVY-LEDUC AND F. ROUEFF to approximat e the distribution of ˜ Z D , whic h is more precise than the limit distribution. The corresp onding density is giv en by the conv olution ˆ p θ ( x ) = √ D − 1 σ θ Z ∞ t = −∞ g ( x − t ) p ( √ D − 1 σθ t ) dt, where g denotes the density of U . It f ollo ws that ∂ θ log ˆ p θ ( x ) = θ − 1 − R g ( x − t ) q ( √ D − 1 σθ t ) θ R g ( x − t ) p ( √ D − 1 σθ t ) , (8) where q ( t ) = − t ˙ p ( t ). Denote by ˙ g the deriv ativ e of g . Usin g a T a ylor exp an- sion of g ( x − t ) around x , one has for a k ern el fun ction k su c h that R k = 1, as b → 0, Z g ( x − t ) k ( t/b ) dt = b g ( x ) − b ˙ g ( x ) Z tk ( t ) dt + O ( b 2 ) . Observing that R q = R p = 1, we may ap p ly this appro ximation to the con- v olutions app earing in the ratio displa yed in ( 8 ) with b = ( √ D − 1 σθ ) − 1 and k = q and p successive ly . S in ce R tq ( t ) dt = 2 R tp ( t ) dt = 2 µ , w e get, as D → ∞ , ∂ θ log ˆ p θ ( x ) = θ − 1 1 − g ( x ) − 2 µb ˙ g ( x ) + O ( b 2 ) g ( x ) − µb ˙ g ( x ) + O ( b 2 ) = θ − 1 µb ˙ g ( x ) /g ( x ) + O ( b 2 ) . Using this appro x im ation, since ˙ g ( x ) /g ( x ) = − x [recall that g is the density of the N (0 , 1)] and V ar( ˆ Z D ) ∼ 1, we get, as D → ∞ , V ar( ∂ θ log ˆ p θ ( ˆ Z D )) ∼ D − 1 µ 2 θ 4 σ 2 . Admitting that this provides a go o d approximat ion of the Fisher information of Z D , w e get the right -hand s ide of ( 7 ). 7. Application to synt hetic data. In Sections 4 and 5 th e traffic traces are not completely lab eled. W e only ha ve some lab eled an omalies, those generated in the exp erimen ts, bu t man y other anomalies, p resen t in th e bac kground ADSL and P2P traffic, are not lab eled. Ind eed, th e amount of data is to o large and all the destination IP add resses cannot b e thorou gh ly analyzed to make a d iagnostic of an anomaly for eac h of th em. Here, w e generate synthet ic high-dimensional data corresp onding to 1 minute of In- ternet traffic and con taining 1 anomaly . Using Mon te Carlo sim ulations, R OC cur ves are obtained for the differen t detection algorithms, and then compared. DETECTION AND LOCALIZA TION O F CHANGE-POINTS 23 7.1. Description of the synthetic data. W e explain, in the follo win g, h ow the n um b er of SYN pack ets receiv ed by the differen t IP addresses in volv ed in a giv en observ ation win do w is syn thesized in eac h sub-interv al of time length ∆. F or a giv en IP addr ess, w e prop ose mo deling the SYN p ac k et traffic using a P oisson p oin t p ro cess w ith a give n int ensit y expressed as a n u m b er of SYN pac kets receiv ed p er second. In Net work applicatio ns, eac h IP address receiv es a very different amount of traffic. Hence, we shall use differen t in tensities from an IP address to another. T o tak e into accoun t this div ers it y , we prop ose using the realizat ions of a P areto distribution f or the parameters of the d ifferen t in tensities so th at a lot of mac hines receiv e a small num b er of SYN p ac k ets w hile a few r eceiv e a lot. Let u s now fu r ther describ e the framew ork of our n um erical exp er im ents. W e fir st randomly generate a sequ ence ( θ i ) i =1 ,...,D of in tensities f or D = 1000 IP addresses with the P areto distribution havi ng the follo wing densit y: γ α/ (1 + γ x ) 1+ α , when x > 0, with α = 2 . 5 and γ = 0 . 72, wh ic h roughly corresp onds to wh at we observe d in the real traffic traces at our disp osal. Then, w e generate the D time series of length P = 60 corresp ond ing to the n u m b er of p ac k ets receiv ed b y ea c h IP add ress in the 60 su b -in terv als of the observ ation w indo w , wh ic h consists of i.i.d. Po isson random v ariables, except for 1 IP address for whic h a c h an ge-p oin t is introd uced. Let us denote b y ( Y i,j ), where 1 ≤ i ≤ D and 1 ≤ j ≤ P , the d ata th us obtained and b y i 0 the IP address whose time series con tains a c hange-p oin t at time index j 0 ∈ { 1 , . . . , P } : ( Y i 0 ,j ) 1 ≤ j ≤ j 0 i . i . d . ∼ P oisson( θ i 0 ) and ( Y i 0 ,j ) j 0
Original Paper
Loading high-quality paper...
Comments & Academic Discussion
Loading comments...
Leave a Comment