On the Peaking Phenomenon of the Lasso in Model Selection
I briefly report on some unexpected results that I obtained when optimizing the model parameters of the Lasso. In simulations with varying observations-to-variables ratio n=p, I typically observe a strong peak in the test error curve at the transitio…
Authors: Nicole Kraemer
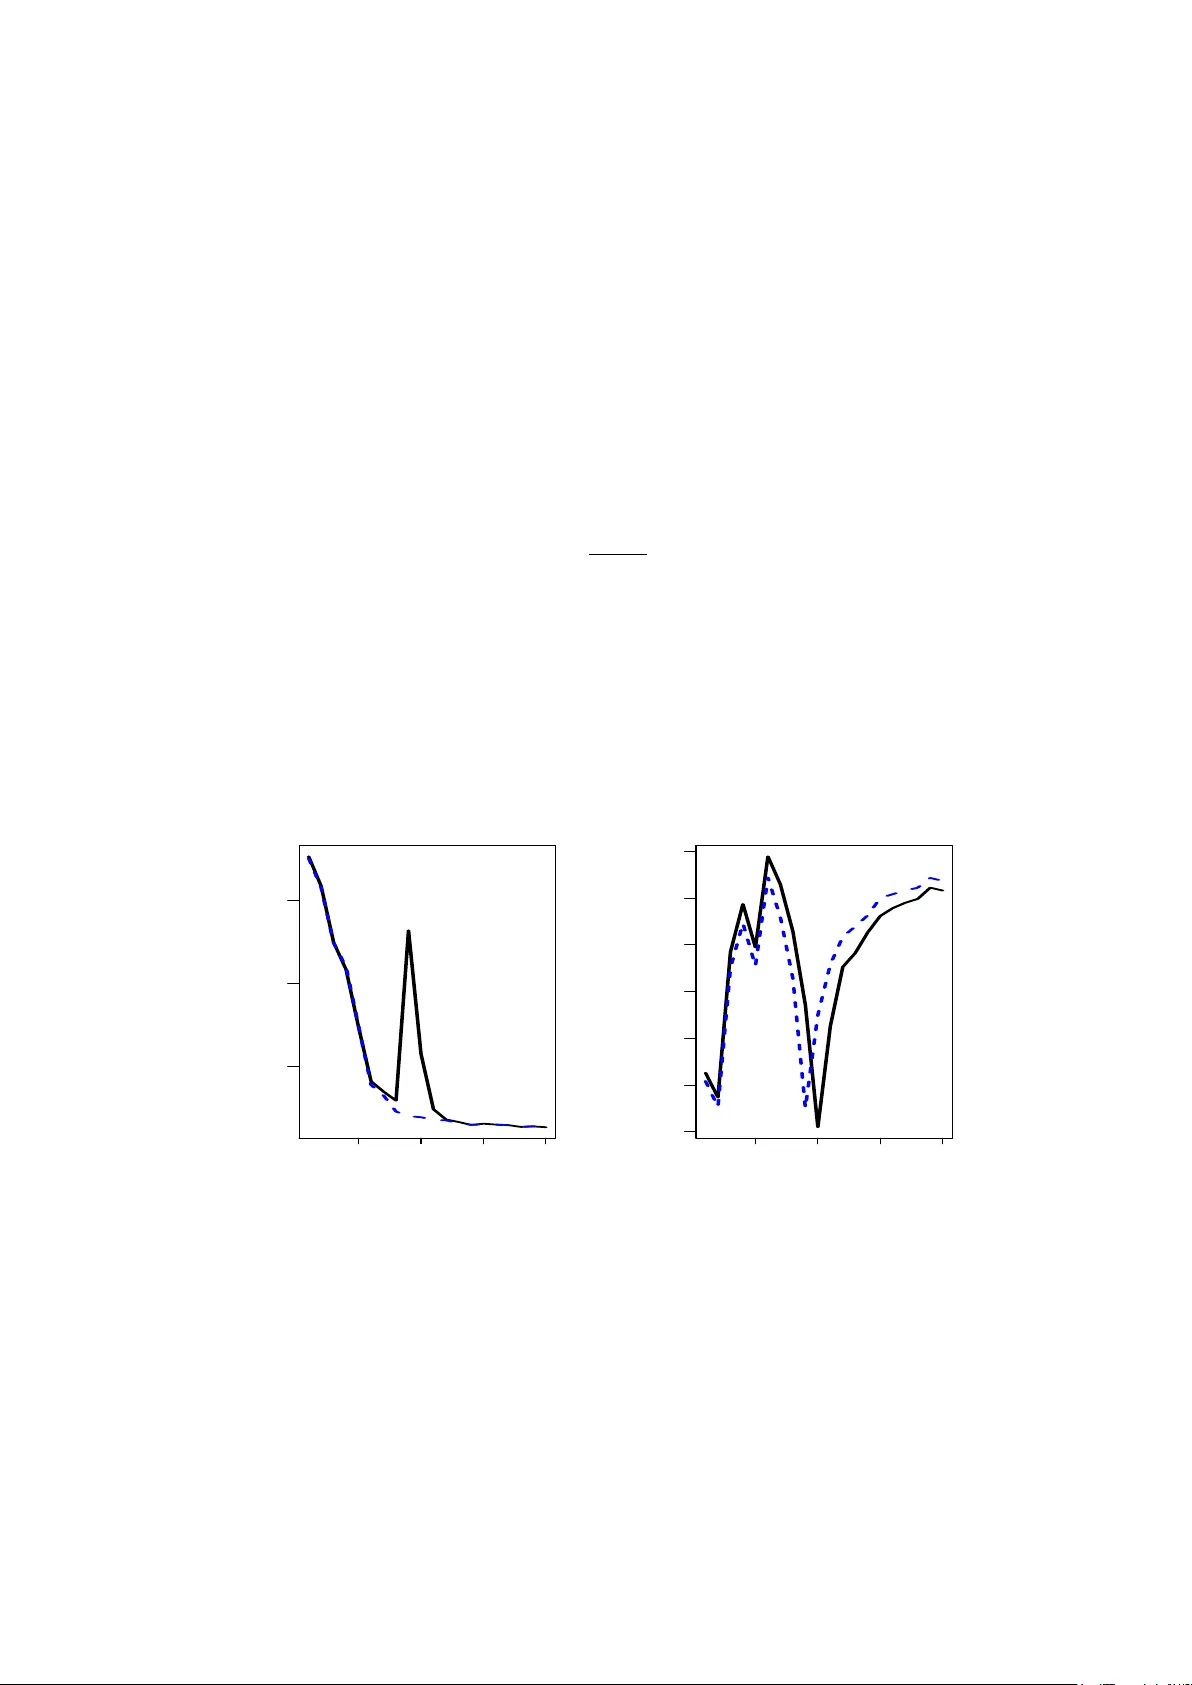
On the P eaking Phenomenon of the Lasso in Mo del Selection Nicole Kr¨ amer Mac hine Learning Group, Berlin Institute of T ec hnology nkraemer@cs.tu-berlin.de Marc h 19, 2022 Abstract I briefly report on some unexp ected results that I obtained when optimizing the model parameters of the Lasso. In sim ulations with v arying observ ations-to-v ariables ratio n/p , I t ypically observe a strong p eak in the test error curve at the transition p oin t n/p = 1. This p eaking phenomenon is well-documented in scenarios that in volv e the inv ersion of the sample co v ariance matrix, and as I illustrate in this note, it is also the source of the p eak for the Lasso. The key problem is the parametrization of the Lasso penalty – as e.g. in the current R pack age lars – and I presen t a solution in terms of a normalized Lasso parameter. 1 In tro duction In regression and classification, an omnipresen t challenge is the correct prediction in the presence of a huge amount p of v ariables based on a small num b er n of observ ations, and for an y regularized metho d, one t ypically exp ects the p erformance to increase with increasing observ ations-to-v ariables ration n/p . While this is true in the regions n > p and n < p , some estimators exhibit a p eaking b eha vior for n = p , leading to particularly lo w p erformance. As do cumen ted in the literature (Raudys and Duin, 1998), this affects all metho ds that use the (Moore-Penrose) inv erse of the sample co v ariance matrix (see Section 3 for more details). This leads e.g. to the peculiar effect that for Linear Discriminant Analysis, the p erformance impro v es in the n = p case if a set of uninformativ e v ariables is added to the mo del 1 . In this note, I show that this p eaking phenomenon can also o ccur in scenarios where the Mo ore-P enrose in verse is not directly used for computing the mo del, but in cases where least-squares estimates are used for mo del selection. One particularly p opular metho d is the Lasso (Tibshirani, 1996) and its curren t implemen tation in the softw are R . As illustrated in Section 2, its parameterization of the p enalty term in terms of a ration of the ` 1 -norm of the Lasso solution and the least-squares solution leads to problems when using cross-v alidation for mo del selection. I presen t a solution in terms of a normalized penalty term. 1 Benjamin Blankertz, Ryoto T omiok a: p ersonal communic ation 1 2 Sim ulation Setting and P eaking Phenomenon F or a p -dimensional linear regression mo del y = x > β + ε , the task is to estimate β based on n observ ations { ( x 1 , y 1 ) , . . . , ( x n , y n ) } ⊂ R p × R . As usual, the cen tered and scaled observ ations are p ooled in to X = ( x 1 , . . . , x n ) > ∈ R n × p and y = ( y 1 , . . . , y n ) > ∈ R n . In this note, I study the p erformance of the Lasso (Tibshirani, 1996) b β lasso = arg min β k y − X β k 2 + λ k β k 1 , λ ≥ 0 for a fixed dimensionality p and for a v arying n umber n of observ ations. Common sense tells us that the test error is appro ximately a decreasing function of the observ ations-to-v ariables ratio n/p . Ho wev er, in sev eral empirical studies, I observ e particularly p o or results for the Lasso in the transition case n/p = 1, leading to a prominent peak in the test error curve at n = p . In the remainder of this section, I illustrate this unexp ected b eha vior on a syn thetic data set. I would like to stress that the peaking behavior is not due to particular choices in the sim ulation setup, but only dep ends on the ratio n/p . I generate n total = 5000 observ ations x i ∈ R 90 , where x i is drawn from a multiv ariate normal distribution with no collinearit y . Out of the p = 90 true regression coefficients β , a random subset of size 20 are non-zero and dra wn from a univ ariate distribution on [ − 4 , +4]. The error term ε is normally distributed with v ariance such that the signal-to-noise-ratio is equal to 4. F or the sim ulation, I sub-sample training sets of sizes n = 10 , 20 , . . . , 190 , 200. The sub-sampling is rep eated 10 times. On the training set of size n , the optimal amount of penalization is chosen via 10-fold cross-v alidation. The Lasso solution is then computed on the whole training set of size n , and the p erformance is ev aluated by computing the mean squared error on an additional test set of size 500. I use the cv.lars function of the R pack age lars version 0 . 9 − 7 (Hastie and Efron, 2007) to p erform the exp erimen ts. The mean test error o v er the 10 runs are displa y ed in the left panel of Figure 1. As exp ected, the test error decreases with the num b er of observ ations. F or n = p ho w ever, there is a striking p eak in the test error (marked by the letter X), and the p erformance is muc h worse compared to the seemingly more complex scenario of n p . W e also observe the peaking b eha vior in the case where n = p in the cross-v alidation split (mark ed b y the letter O). The right panel of Figure 1 displays the cross-v alidated p enalt y term of the Lasso as a function of n . Note that in the cv.lars function, the amoun t of p enalization is not parameterized b y λ ∈ [0 , ∞ [ but b y the more con venien t quantit y s = k b β lasso k 1 k b β ols k 1 ∈ [0 , 1] . (1) V alues of s close to 0 corresp ond to a high v alue of λ , and hence to a large amount of p enalization. The right panel of Figure 1 shows that the p eaking b eha vior also o ccurs for the amoun t of p enalization, measured by s . Interestingly , the p eak do es not o ccur for n = p , but in the case where the num b er of observ ations equals the num b er of v ariables in the cross- v alidation lo ops. This p eculiar b ehavior is explained in the tw o following sections, and I also presen t a normalization pro cedure that solves this problem. 2 50 100 150 200 5 10 15 observations test error X O 50 100 150 200 0.2 0.3 0.4 0.5 0.6 0.7 0.8 observations penalty s Figure 1: P erformance of the Lasso as a function of the num ber of observ ations. Left: test error. Right: p enalt y term s as defined in Equation (1). 3 The Pseudo-In v erse of the Co v ariance Matrix It has b een rep orted in the literature (Raudys and Duin, 1998; T resp, 2002; Opp er, 2001) that the pseudo-inv erse of the cov ariance matrix b Σ = 1 n − 1 X > X = p X j =1 b λ j b u j b u > j is a particularly bad estimate for the true precision matrix Σ − 1 in the case p = n . The ratio- nale b ehind this effect is as follo ws. The Mo ore-P enrose-Inv erse of the empirical cov ariance matrix is b Σ + = rank( Σ ) X j =1 1 b λ j b u j b u > j . In particular, in the small sample case, the smallest p − n eigenv alues of the Mo ore-Penrose in verse are set to 0. This corresponds to cutting off directions with high frequency . While this in tro duces an additional bias, it tends to a void the h uge amoun t of v ariance that is due to the in version of small but non-zero eigen v alues. In the transition case n/p = 1, all eigenv alues are 6 = 0 (with some of them v ery small) and the MSE is most prominent in this situation. The striking peaking b eha vior for n = p is illustrated in e.g. Sc h¨ afer and Strimmer (2005). As a consequence, an y statistical metho d that uses the pseudo-in verse of the cov ariance suffers from the p eaking phenomenon. consequen tly , the p eaking b ehavior also o ccurs in ordinary least squares regression, as it uses the pseudo-inv erse, b β ols = X > X + X > y . 3 50 100 150 200 50 100 150 200 250 observations l1 norm Figure 2: Peaking b eha vior of the ordinary least squares regression: ` 1 -norm of the least squares estimate as a function of the num ber of observ ations. This is illustrated in Figure 2. On the training data of size n = 10 , 20 , . . . , 200, I compute the ` 1 -norm of least squares estimate. The Figure displays the mean norm ov er all 10 runs. F or n = p , the norm is particularly high. Note furthermore that except for n = p , the curv e is rather smo oth, and small changes in the num b er of observ ations only lead to small changes in the ` 1 -norm of the estimate. This observ ation is the key to understanding the peaking b eha vior of the Lasso. While for the estimation of the Lasso coefficients itself, the pseudo-in verse of the cov ariance matrix do es not occur, it is used for mo del selection, via the regularization parameter s defined in Equation (1). I elab orate on this in the next section. 4 Normalization of the Lasso Penalt y Let me denote by n cv the num b er of observ ations in the k cross-v alidation splits, and by s n,cv the optimal parameter chosen via cross-v alidation. As n ≈ n cv , one exp ects the MSE-optimal co efficien ts b β lasso ,n computed on a set of size n and the MSE-optimal co efficien ts b β lasso ,n cv based on a set of size n cv to b e similar, i.e. n ≈ n cv ⇒ k b β lasso ,n k 1 ≈ k b β lasso ,n cv k 1 . No w, if n cv = p , then, in eac h of the k cross-v alidation splits, the n umber of observ ations equals the n um b er of dimensions. As the least squares estimate is prone to the p eaking b eha vior (recall Figure 2), we observe k b β ols ,n k 1 k b β ols ,n cv k 1 . This implies that ev en though the ` 1 -norms of the regression coefficients b β lasso are almost the same, their corresp onding v alues of s differ drastically . T o put it the other wa y around: 4 The optimal s found on the cross-v alidation splits (where n cv = p ) is wa y to o small, and it dramatically ov erestimates the amoun t of penalization. This explains the high test error in the case n cv = p that is indicated b y the letter O in Figure 1. F or n = p , the same argument applies. The optimal s cv on the cross-v alidation splits (where n cv < p ) underestimates the amoun t of complexity in the n = p case, which leads to the p eak indicated by the letter X in Figure 1. T o illustrate that the p eaking problem is indeed due to the parametrization (1), I normalize the scaling parameter s in the following w ay . Let me denote b y ` 1 , ols cv the av erage o v er all k differen t ` 1 -norms of the least squares estimates obtained on the k cross-v alidation splits. F urthermore, ` 1 , ols is the ` 1 -norm of the least squares estimates on the complete training data of size n . The normalized regularization parameter is e s = ` 1 , ols cv ` 1 , ols s cv . (2) Note that the function lars returns the least squares solution, hence there are no additional computational costs. T o illustrate the effectiv eness of the normalization, I re-run the sim ulation exp erimen ts with cross-v alidation based on the normalized p enalt y parameter (2). This function - called mylars – is implemented in the R -pack age parcor v ersion 0.1 (Kr¨ amer and Sc h¨ afer, 2009). The results together with the results for the un-normalized parameter 1 are displa yed in Figure 3. 50 100 150 200 5 10 15 observations test error X O 50 100 150 200 0.2 0.3 0.4 0.5 0.6 0.7 0.8 observations penalty s Figure 3: Performance of the Lasso (blac k solid line) and the normalized Lasso (blue jagged line) as a function of the n umber of observ ations. Left: test error. Right: p enalt y term s (blac k solid line) and e s (blue jagged line) as defined in Equation (1) and (2) resp ectiv ely . 5 Conclusion The p eaking phenomenon is well-documented in the literature, and it effects every estimator that uses the pseudo-inv erse of the sample cov ariance matrix. As I illustrate in this note, this 5 defect in the transition p oin t n/p = 1 can also o ccur in more subtle wa ys. F or the Lasso, the particular parameterization of the p enalt y term uses least-squares estimates, and it leads to difficulties in mo del selection. One can exp ect similar problems if one e.g. measures the fit of a mo del in terms of the total v ariance that it explains, and if the total v ariance is estimated using least squares. In this case, a normalization as prop osed ab ov e is advisable. Ac kno wledgements I observ ed the peaking phenomenon during the preparation of a paper with Juliane Sch¨ afer and Anne-Laure Boulesteix on regularized estimation of gaussian graphical mo dels (Kr¨ amer et al., 2009). T ogether with Luk as Meier, the three of us discussed the source of the p eaking phenomenon in great detail. My colleagues Ryota T omiok a, Gilles Blanchard and Benjamin Blank ertz pro vided additional material to the discussion and p oin ted to relev ant literature. References Hastie, T. and Efron, B. (2007). lars: L e ast A ngle R e gr ession, L asso and F orwar d Stagewise . R pack age version 0.9-7. Kr¨ amer, N. and Sch¨ afer, J. (2009). p ar c or: estimation of p artial c orr elations b ase d on r e gu- larize d r e gr ession . R pack age version 0.1. Kr¨ amer, N., Sc h¨ afer, J., and Boulesteix, A.-L. (2009). Regularized estimation of large-scale gene regulatory netw orks using graphical gaussian mo dels. preprint. Opp er, M. (2001). Learning to Generalize. A c ademic Pr ess , pages 763–775. Raudys, S. and Duin, R. (1998). Exp ected classification error of the Fisher linear classifier with pseudo-inv erse cov ariance matrix. Pattern R e c o gnition L etters , 19(5-6):385–392. Sc h¨ afer, J. and Strimmer, K. (2005). An empirical Bay es approac h to inferring large-scale gene asso ciation netw orks. Bioinformatics , 21(6):754–764. Tibshirani, R. (1996). Regression shrink age and selection via the lasso. Journal of the R oyal Statistic al So ciety Series B , 58:267–288. T resp, V. (2002). The Equiv alence b et ween Ro w and Column Linear Regression. T e chnic al R ep ort . 6
Original Paper
Loading high-quality paper...
Comments & Academic Discussion
Loading comments...
Leave a Comment