KiWi: A Scalable Subspace Clustering Algorithm for Gene Expression Analysis
Subspace clustering has gained increasing popularity in the analysis of gene expression data. Among subspace cluster models, the recently introduced order-preserving sub-matrix (OPSM) has demonstrated high promise. An OPSM, essentially a pattern-base…
Authors: ** - **Obi L. Griffith** (BC Cancer Agency, Canada) - **Byron J. Gao** (Texas State University – San Marcos, USA) - **Mikhail Bilenky** (BC Cancer Agency
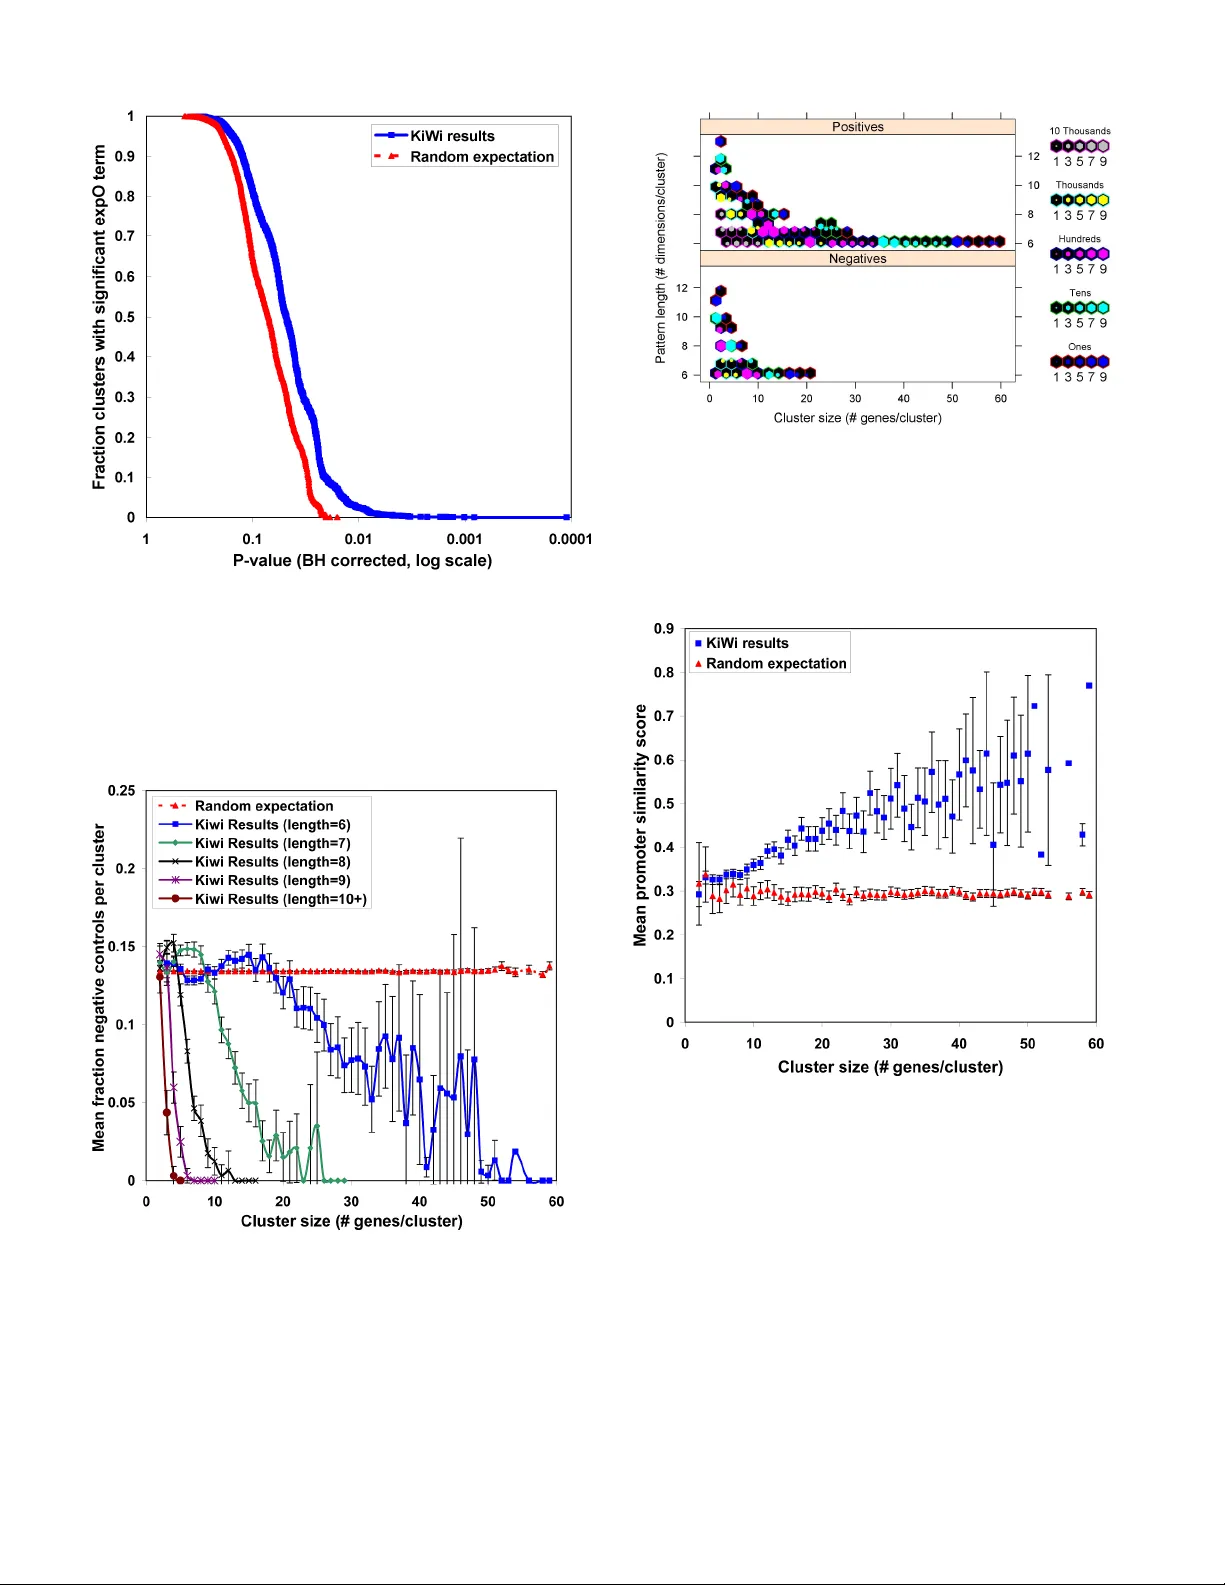
KiWi: A Scalable Subspace Clustering Algorithm for Gene Expression Analysis Subspace cl ustering has gained i ncreasing popularity in t he analysi s of gene ex pressio n data. A mong subspace cl uster models, the recently introduce d order- preservi ng sub- matrix (OPSM) has demon str ate d high pr o mise. An OP SM , ess ential ly a patte rn- based subs pa ce cl uste r, is a su bse t of r ow s and c olu mns i n a da ta matrix for w hich all the row s induce the same line ar ordering of columns. Ex isti ng OPSM discovery methods do not scale w el l to increasi ngly larg e expression dataset s. In partic ular, twig clusters having few g enes an d man y ex peri ment s inc ur ex plos ive computati onal costs and are c ompletely pr uned off by ex isting methods. How ever, it i s of particular i nterest to determi ne small groups of g enes th at are t ig htly coregul ate d acros s ma ny conditions. I n this paper, w e present KiWi, an OPS M subspa ce clust eri ng al gori th m th at is s ca lable to massi ve dat asets, c apa ble of disc ov ering tw ig clus ters a nd i dent ify ing negat iv e as w el l as positi ve corr elatio ns. We ex tens ively vali date K iWi usi ng rel eva nt biologic al datasets and show that KiWi correctly assi gns redundant probe s to the same cluster, groups ex periments with comm on clinical ann otation s, diffe rentiates real prom oter sequences fr om negative c ontrol seq uences, and sh ow s good association with cis-regulatory motif predictions. Keywords-KiW i; subspace clusteri ng; biclu stering; OPSM; pattern- based clus ter; gene e xpression an alysis; twi g cluster; I. I NTRODUCTION Numero us studies have used co expre ssion of large expre ssion datasets to infer functio nal associat ions between genes [1], to ide ntify group s of related genes that ar e importa nt in specif ic cance rs or rep resent c ommon tum our progression mech anisms [2] , to study evolut ionary change [3], f or integra tion with ot her l arge-sca le data sets [4 ][5], [6], a nd fo r the gener ation of high-q uality biol ogica l interactio n networks [7][8][9 ] [10]. A number of studie s have also at tempted to use coexpressi on to i dentify co regulation w ith the h ypothesis that if two or mor e genes are expr essed a t the same time and lo catio n and at s imilar l evels then they may be r egulated by the sam e trans cription facto rs and r egulatory elemen ts. This a pproa ch has shown promise particular ly in simpler model orga nisms such as A. th al ia na and S. cere visia e [11] [12 ][13] [14] and many groups are currently w o rking on implem enting this idea in mamm alian systems. How ever, trad itional clust ering meth od s hav e not w orked part icula rly w ell on large datasets f or this probl em. Most method s assign each ge ne to only one cluster w hile in reality many genes lik ely take part in m ultiple processe s. Also, global coexpression is measured across all conditi ons, w hereas, it is proba ble that most g enes are on ly tightl y coregul ated under certain co nditio ns or locat ions. In re cent y ears, a new field of clus tering analy sis term ed subspac e clusteri ng (or bic lustering) has gaine d increa sing popul arity in the analy sis of g ene expres sion data an d oth er biol ogic al data [15][ 16][1 7][1 8] [1 9]. In c ontra st to tradi tion al cluster ing methods suc h as hierarchic al clusteri ng, subspace cluste ring meth ods do no t requir e expres sion t o be cor related acro ss all conditions fo r genes to be assigned to the same cluster. T his has sever al advantages for da ta in which biologically relevant su bsets exist ( e.g. diff erent tissue ty pes) or where a few noisy expe rimen ts migh t signif icantly bi as the results of the clusterin g algorit hm. This also allows assignmen t of genes to multip le clusters for d ifferent su bsets of experim ental conditi ons. More re cently, t he order -preser ving sub-matr ix (OP SM) has been i ntrodu ced an d dem onstrate d as a biol ogical ly m eaningf ul subspa ce cluster model [15] [20] . An OPSM, e ssentiall y a patte rn-bas ed s ubspa ce clu ster , is a su bset of rows an d c olumn s in a dat a matrix f or which all the rows induce the s ame linear orde ring of col umn s. In t erms of ge ne ex pressi on, an OPS M might repr esent a gro up of coregulated ge nes whose expre ssion levels rise and fall synchronously in response to a series of environm ental or ce llular stim uli. A recent report revie wed several existing bicl ustering method s [17]. T hey found that in gener al, bicl ustering meth ods outpe rform global m ethods such as hier archical cluste ring. They also sho wed that OPSM had the hi ghest propor tion of cluste rs with signifi cant en richm ent of on e or m ore Gen e Onto logy (GO) categor ies and had good correspo ndence with know n pathw a ys according to th eir analy sis of A. tha lian a metabolic p athways and S. cere visia e protein -pr otein interact ion netw orks. H owever, th ey stat e that the re are consi derable pe rform ance dif ferences between the test ed metho ds. P er formanc e is a signific ant factor as the size o f the subspac e clusteri ng search space (sea rching a ll possible subspaces ) is n early inf inite an d increases expon entially with the size of the data set to be analyzed. A s costs of express ion analy sis contin ue to decreas e, the num bers an d sizes of expre ssion datase ts have grown at an ever -incr easing ra te. The Gene Expr ession Omnibus (GEO ) currently hold s over 70,000 samples for over 100 d iffere nt orga nisms [21] and the Stanford Micr oarray Da tabase (SM D) contai ns over 10,000 pub lic exper iments for over 20 organi sms [22]. Further more, as arra y desi gns continue to impr ove, it ha s become possibl e to include probe s for essentially all known genes for many specie s. T he developm ent of exon ar rays, alternative splicin g array s, w hole- genom e tiling array s, SAGE-t ype expe riments, an d high- thro ughput seq uencing t echnolo gies incr eases the si ze of the Obi L. Griffith † , Byron J. Gao ‡ , Mikhail Bilenky † , Yuli ya P ryc hyn a † , Martin Ester § and Steven J.M. Jones † † BC Can cer Agen cy, Can ada ‡ Texas State University – San Marcos, USA § Simon Fraser University, Canada obig@bcgs c.ca, bgao@txsta te.edu, mbilenky@ bc gsc.ca, y _ prychyn a@yahoo.ca, ester@ cs.sfu.ca, sjones@bcg sc.ca problem eve n furthe r. Thus, with exp ression data of potentiall y tens or hundred s of thousands of both rows and columns we need al gorithms tha t can hand le not only ‘la rge data sets’ but ‘massive datasets’. In our exp erienc e, we have found that exi sting subspac e clusteri ng methods do not scale well to these larger expressio n datase ts. We hav e attem pted to analyze l arge dat asets w ith a Gibbs sampl ing based bicluster ing algorithm called gene expre ssion mining server (GEM S) [18]; an adaptive q uality- based cluste ring algori thm [16]; an OPSM-b ased (OP-c luster) algorithm [20]; an d PrefixS pan [23], one of the fast est sequent ial min ing algorith ms. In all cases, ther e were eit her built in lim its (e.g. O P-cluster is lim ited to 100 colum ns and 5000 rows) or prac tical limitatio ns in terms of m emor y or process or requi rements th at made it imposs ible to obtain results for our large datas ets (Ta ble 1). In particular , those “ twig cluster s” defined here as clusters having small size (few genes) and natu rally large dimensionality (man y experim ents) in cur explo sive co mputatio nal co sts and would b e co mpletel y pruned off by existing m ethods. H owever, it is of p articular interest t o biologists to determ ine small g roups of genes that ar e tightly core gulated und er many condi tions. Some p athways or proce sses might require onl y tw o ge nes to act in concer t. Thus, there is a clear n eed for s ubspace clusterin g metho ds that can be run on larg e datasets and de tect these twig clusters. Previo usly, we introd uced a framework t hat discove rs signi ficant O PSM subsp ace clus ters f rom m assive datas ets [24]. Here we pres ent an open -sourc e softw are im plemen tation of th is alg orith m calle d KiWi (vers ion 1.0) th at is capabl e of running o n a number of di fferent biologic ally rele vant dataset s ranging from sm all to very large in size. We extensiv ely validate the result ing clus ters f or these datasets and show th at KiWi co rrectly assigns redun dant pr obes t o the sam e clu ster, groups exper iments with common exp erimental annotations (such as tissue s ource) , differ entiates re al prom oter sequ ences from negative contro l sequ ences, an d show s goo d associ ation with de novo motif predicti ons (cisRED ). As subs pace cluster ing metho ds cont inue to ga in popular ity over global clustering methods , simple and scalabl e software will be neede d to handl e the chal lenge of ever-in creasing dataset si zes faci ng the biologi st. To this end, we provide sourc e code and a work ing executabl e for Ki Wi to th e bioinf ormatics c ommunity (http://w ww.cs.sf u.ca/~bgao/ personal/) . II. R ESU LTS A. KiWi subspace cluster ing results For all thre e datasets analy zed, K iWi w as able to run to compl etio n (after para meter op timiza tion) a nd produc e a large numbe r of cluster s. The res ults are s ummariz ed in Tab le 2 and densi ty distrib utions for cluster size (numbe r of genes) versus patter n length (number of expe riments) plotted in Figure s 1-3. A large numbe r of clusters (13412 to 212532) was identi fied for th e three datasets , with a r ange of s izes an d patte rn lengt hs. In gene ral, KiWi appears well suited t o identify ing smaller cluster s with long patter ns. For the GPL96, exp O, and Cooper datase ts the av erage clu ster size w as 5. 11, 3.89 , and 6. 79 and the avera ge patter n length was 24.04, 42.48, and 6.85 re spect ivel y. B. Grouping of pr obes to common gene identifier Figure 4 sh ows the results of the ‘ probe to comm on gene’ analy sis. Using the ex pO datas et (becau se it is base d on t he more c urrent Affymet rix pla tform) we fo und that of the 23705 cluste rs identif ied by KiWi, 188 0 (7.93%) c ontained at le ast one pai r of redun dant probes (i.e. dif feren t probe s corres ponding to the sam e gen e) and on av erage, Ki Wi clusters contai ned 0.177 red undant pro be pairs per cl uster. This was signi ficantly m ore than the 24.5 ( 0.10%) clus ters w ith at le ast one r edundan t pair (p<0. 0001, 1 0,000 pe rmu tations ) and th e 0.002 a verage numbe r of redunda nt probe s per cluste r (p<0.00 01, 10000 per mutations) ident ified in our random simulations. C. Experiment al annotation analysis Figure 5 sho ws the results of the ‘e xperimenta l annotation analy sis’. This used th e expO data becau se unlik e most g ene express ion dat asets, th e expO data ar e accom panied by carefu l and compr ehensi ve experi mental anno tatio ns. The graph shows a significa nt tendency by KiWi to group experi mental dimensions with c ommon exp erimental an notation term s such as tissue source , histolo gy, gender, ethni city, smoking, or alco hol consumpti on status (p= 0.009) . When onl y tissue source ter ms w er e co nsidered, a nearly id entica l graph was obser ved with a simil ar level of signi ficance =0 .005 (F igure 6). D. Negative cont rol analysis Figure 7 sho ws the average numbe r of ne gative contr ol sequen ces (f or the C ooper dataset ) in KiWi cluste rs fo r diffe rent p attern lengths ( number o f exper iments) a nd cl uster size (numbe r of genes/pro moters). The random expec tation is that nega tive sequen ces w ill be included at a cons tant rate based on the prop ortio n of total genes/pro moter s that are negat ives. This is what we obser ve with the randomly gener ated clusters havi ng a very constant mean frac tion of negati ve contro ls for all clust er sizes and pattern lengt hs. Over all, the frac tion of ne gative co ntrol s eque nces inc luded i n KiWi cluster s w as 0. 129. This was significant ly lower than the mean frac tion of 0.134 o bserved for random simulati ons (p<0 .001, 1000 per mutatio ns). The more gene s that form a cluster (share a KiWi patt ern), the less likely that clus ter is to include negati ve contro l sequence s. Similarl y, the longe r the patter n (more e xperimenta l dimensions) a cl uster has, the less likely that cluster is to include a negative c ontrol se quence. Whe n negativ e control sequence s were exc luded and cl ustered separa tely from real seque nces we found that significantl y more c lusters (with grea ter clust er siz e and patt erns le ngths) were pr oduced fo r the real data than the negativ e control data (Figure 8). E. cisRED analys is Figu re 9 sh ows that Ki Wi clu sters for t he Co oper pr omote r dataset are m ore likely to have promoters that contain sim ilar conser ved motifs t han randomly gro uped gene s. T he overa ll mean prom oter sim ila rity score f or Ki Wi clu sters of 0.339 w as sign ificantly greater th an th e score of 0.29 6 for ran dom (Wilcox test, p < 2 .2e-16). As the cluste r size increases (more genes) the separation from random increases. This is a lso true for incr easing numbe r of experi ments (Fi gure 10). III. DISCUSSION We have exten sively assessed and vali dated the perfo rmance of KiWi, a subspa ce cluste ring im plementati on that is sc alable to very larg e expression datasets (10000s of genes and 1000s of expe riments) and able to ide ntify smaller (tw ig) clusters . An a dvantag e of KiWi is that su bspac e clust ers can be ident ified f or a datas et of v irtually any size. By experim enting w ith the setti ngs for k and w , the user ca n balance th e num ber and qual ity of clus ters identif ied agai nst desired runt ime. We chose settings t hat would produce the best results (in te rms of n umbers of clusters and m axim um pattern length) but still run t o com pletion in ~24- 48hours on an ord inary PC. Typ ically subspace cl ustering method s are evalua ted on significantly smaller da tasets and with only prelim inary bi ologic al assess ment s such as GO analysis . Here, we g o significant ly furth er and d emonstrat e KiWi’s ability to identify biologically interestin g clusters (at both the gen e level and experim ent lev el) from ex pression datasets that w ere, until now, inacce ssible to subspace clust ering methods. An initial m atter for discussion is th e idea that KiWi is a ble to identif y the s o-called tw ig clusters rather th an being lim ited to cluster s with very large number s of genes over small numbe r of ex perim ents. If w e plot a densi ty gra ph of the n umber of genes ver sus number o f experiments for a ll clusters we see that there is a bias tow ards sm aller cluste rs. For example , in t he expO da ta 80% o f clusters had 5 ge nes or less a nd 97 % had 10 genes or le ss (Figure 2) although so me larger clusters were found as well (up to 162 genes in the GPL96 dat aset, 23 in the expO dataset , and 69 in the Cooper dataset ). These cluste rs, while small in gene number, ar e in many cases coe xpressed acro ss a lar ge number of experiments. For clusters with 5 genes or l ess, the n umber of ex peri men ts over w hic h coex pressi on was obser ved ranged fro m 10 to 120 w ith a mean of 42.48. Similar t rends w ere seen for th e GPL 96 and C ooper data (Tabl e 2; Figure 1 -3). We bel ieve thi s is a novel cont ribution to the subsp ace clustering fie ld. Previous studi es have tended to focus on th e large r clu sters by desig n or necess ity. Wh ile th ese lar ge clusters have been shown to be of intere st or value, there is no r eason t o expec t that all or even m ost bio logica l proces ses or dis ease m echanism s would inv olve tigh t co-reg ulation of large g roups of gen es. In f act, we expect that m any importan t processes w ill involve relatively small numbers of g enes. Indeed, the biological assessments discussed below showed that m any of these small cluste rs are of biologi cal interest. Gene Ontolo gy (GO) and oPossum analysis results were previo usly reported [24] using a large Affymetr ix dataset (refer red to here as GPL96). We showed that K iWi can group genes with over -repr esentation of GO biolo gical proc esses and oPossum tra nscriptio n fac tor binding sites. I n anot her pre vious study [25] we fo und that for the GPL96 data, app roxi mately 33% of coexpr essed gene pa irs with a global Pearson correl ation (r) of at leas t 0.80 s hared a comm on GO biol ogica l process te rm. This w as the min imum r value f or wh ich we saw clear sepa ratio n from random performanc e. Other studies have reco mmended r=0. 84 as a good cutoff for re liable globa l coexpres sion [26]. Howev er, even with th e less stringen t cutoff of r=0.8, only 9701 gene pai rs actually attained this level of gl obal coex pressi on. We hy pothesi zed that su bs pace cluster ing might pro vide a useful alter nati ve or complement ary me thod f or iden tify ing bi olog ically rel evant coex pressi on relationsh ips. With KiWi w e were a ble for the firs t time t o anal yze our large GP L96 datase t (updated with a further 973 experi ment s since our previ ous pu blicat ion) f or subs pace coexpr ession. T he entire set o f 13412 KiWi clusters (repre senting 39 3352 coe xpressed gene pa irs) had si milar level s of GO performance with 23 % of clusters having at least one s ignif icant G O te rm (FD R<0.1) and g ood s epara tion f rom random expect ation. This is pe rhaps ex pected g iven that the vast major ity of KiWi clusters have very high correl ation of expression between genes across their subset of experiments. For exa mple, in t he GPL96 da taset, 90% o f KiWi c lusters had an avera ge r > 0.95 (Figur e 11) wherea s only 44 of the gene pairs ide ntified b y global metho ds had r value s this high. This demonst rates tha t whereas few ge ne pairs or c lusters are hi ghly correl ated across all cond itions/ex periments, m ost gen es are highly cor rela ted with one or mor e othe r genes acr oss some subs et of the c onditi ons. Using ano ther large Affymetrix da taset (expO) we show that KiW i is also very good at group ing probes for the same gene. I n fact, a significa nt propo rtion of the to tal clusters contain ‘r edundant’ p robes. In itself , this is n ot a surprisi ng result, b ut is an important positive cont rol that shows KiWi correctly identifies logically related gen es. How ever, this also argue s for removing or averaging o f redunda nt probe s before cluster ing to avoid wasted co mputatio n time when gene cluster s (as opposed to probe c lusters) ar e the de sired end- produc t. The ex pO dat aset w as also useful f or its ev aluati on of exper iment-le vel clust ering by KiWi. Part o f the promise of bicluste ring m ethods is th at they will i dentify not only coexpres sed gen es bu t also the su bset of expe rimental tissues or cond itions under which t hey are coexpre ssed. Such bicl usters could be of partic ular value for ide ntifying tissue- or stage-s pecific coregul ation. Bu t, they als o allow identif ication of core gulation for previously uncon sider ed sample gro ups. For exam ple, w e were able t o ident ify gen e clusters sp ecific to gender , smoking and alcoho l consumptio n status. The Expre ssion Project for Oncolo gy and Inte rnationa l Genomic s Consort ium should be appla uded for not only making their raw exp re ssio n da ta (C EL fi les ) ava ila ble i n GEO b ut al so for prov iding the se de tailed and standard ized c linical annota tions. Almost no ne of the other dat asets in GEO have do ne so. Such datasets m ake possible, f or the firs t tim e, true tw o-dimensional evalu ation of biclus tering meth ods on clin ically relev ant expres sion da ta. In the Cooper pro moter datase t, expression leve ls were measure d by report er gene a ssay for a large number o f prom oter sequen ces acr oss a set of 16 diffe rent cell lin es. Thus, th e dat a comes in the n ormal f ormat of a gene/ promo ter versus exp eriment/con dition m atrix but expression is measure d by repo rter gene activity (luciferase levels) in stead of hybr idizatio n intensity (a s on a microarray). The Cooper pro mo ter da ta set is a re la tive ly sma ll data set a nd was cho sen for re asons oth er th an its siz e. How ever, in su bspac e cluste ring prob lems, even a seemingly small da taset contai ns a very large set of possibl e subs paces. F or exam ple, f or the Co oper dat aset with th e paramete rs we chose, th ere are 3 .3 x 10 224 possible subspac e clusters. W hat makes the Cooper data set partic ularly useful is the prese nce of a l arge numbe r of nega tive co ntrol sequen ces (r andom DNA sequ ence). We hypothes ized that KiWi would b e bia sed aga inst inc lusion o f the se nega tive contr ol sequ ences and this is in deed w hat we obse rved. Als o, both the pat tern length and number of genes see m to be strong predicto rs of how relia ble a patte rn is. We can in principle use this infor mation to define rules for the minimu m length and cluster s ize in combinati on need ed for a ‘reliabl e’ pat tern. Vis ual ly, a c lus ter with p atte rn len gth o f 10 + look s r eli able wit h 3 or m ore ge nes, a clust er wi th pat tern l ength of 9 looks reliab le with 4 or more genes, and so on. Compar ing the Coop er pro moter KiW i cluster s to a cisRE D analy sis of th e Co oper pr omoter sequenc es als o show ed a tendenc y for coexpr essed genes to share common re gulator y motifs. This result suggest s that KiWi coexpressio n analysis may be useful in filtering de no vo motif pred ictions and/or selecti ng coexpre ssed genes as inp ut for motif disco very. As in the nega tive cont rol analys is, we f ound that both the clu ster size and num ber of dim ensio ns were predi ctors of prom oter similarity . These f indings conf irm the in tuitive i dea that OPSM pa tterns are more li kel y to be real if the y are shar ed by more genes and/or across more experi ments. This implie s that smaller (twig) c lusters w ill need l onger patte rns (mor e experim ents) in or der to h ave the sam e level of c onfidence as larger c lusters. A useful futur e development o f KiWi would be the de velopment of a score or p-va lue by which cl usters could be automat icall y ranked that take s both the numbers of genes and exper iments into co nsidera tion. IV. CONCL USI ON By desi gn, KiWi i s capable of id entifying bo th nega tive and positive c orrelations of ex pression, tw ig clusters (as sm all as two gen es), and g enes that appear in m ultiple clust ers. We have dem onstrated that these cluste rs correc tly group rela ted probe sequ ences, avoi d ‘con tam ination ’ by negativ e con trols and t end t o sh are c ommon biol ogica l pr ocesses (GO ) and comm on regul atory sequen ces as define d by both m otif- scanning metho ds (oPossum) and de no vo motif predictio n methods (cisRED). Fina lly, over-r epresentati on of experi mental annotat ion terms gives hope that tissue- or conditi on-specif ic clu sters c an be def ined. These fea tures suggest tha t KiWi should be useful for a wide range of biol ogical ap plicati ons an d m ay be of partic ular use i n the ide ntification o f nove l groups o f coregul ated genes. To facilitat e these applica tions, w e provide all datasets, source cod e, a software t utori al and a working ex ecuta ble (for Win dows® opera ting s ystem s) to the bioinf orm atics resea rch co mmunit y (htt p:/ /www.b c gsc.c a/pl atfo rm/b ioi nfo/g e/k iwi and http :// www.c s. sfu. ca /~b gao/per so nal/) . V. M ETHODS A. Algorit hm The KiW i algorit hm takes as input a standard ge ne expressio n data m atr ix with genes as rows, experiments as colum ns, and som e measure of ex pressi on lev el f or each data point. By sortin g the gen e (row ) vecto rs and re placing the entr ies with their corr esponding exp eriment (co lumn) label s, the data m atrix can be tr ansform ed in to a sequen ce databa se, and OP SM mining ca n be red uced to a speci al ca se of the seque ntial pattern mining p roble m [27]. An OP SM subspace cluster is uniquely specified by this sequenti al pattern and its suppo rting s equences . In oth er w ords, w e are l ooking for a set of genes (the suppor ting sequenc es) which have the same linear order of expression value s for some sub set of experiments ( the patte rn). Instea d of findi ng a compl ete se t of patt erns that are beyon d som e min imum number of gen es, K iWi t argets the longe st patterns for any fixed number of gene s (i.e. the subsp ace cluste r w ith the most experim ents sh owing the sam e patte rn of ex pressi on). KiWi exploits two param eters k and w to pro vid e a bi ased testing on a bounded numb er of candida tes, substa ntially reducin g the search space and p roblem scale. In pa rticu lar, KiWi pe rform s a level- wise sea rch, w here sh orter pattern s gradua lly grow into longer pa tterns level by level. Ba sed on the obse rvati on th at mor e fre quent sub- pattern s are likel y to grow into m ore frequen t super- patterns, w e keep th e top k patterns at each level w ith the greatest number of supporting genes. These patter ns are used to ge nerate candi dates for the ne xt level. Based on the obse rvation th at a l ong pattern segmen ts its supporting sequences into sm all sections, in counting t he number of supporting seq uences, we onl y consider a region of wid th w . In othe r words , only if the new element of a c andidate appears in the n ext w pos ition s of a s equence do we con sider the ca ndidate to be suppor ted by the seq uence. Other techni ques em ployed by Ki Wi, such as the choic e of ran king statis tics, memor y management, p atter n extensio n and redunda ncy removal , are discussed e lsewhere in de tail [24]. The averag e case run time of KiW i is O ( kwn ), linear in n , the num ber of r ows (g enes) [24]. KiWi is also the first sub space cluster ing method to ident ify anti-cor relation as w ell as correlat ion. Anti- correlation of expressi on is inte resting be cause it can also imply common proce ss/pathway membe rship or negat ive regulatio n [28]. Anti- correlate d genes migh t also represen t mem bers of oppo sing pa thways ( when o ne is act ive the ot her i s repr essed) [29] or case s where expres sion of one gene repre sses the expre ssion of other genes (nega tive regulator s). Anti- correl ation in the c ontext of su bspace cluster ing can be capture d by the so -called gene ralized order-pre serving sub- matrix (GOPSM) [24], w here all the gen es in a GOPSM in duce the same or oppo site linear o rdering o f experiments. KiWi mines GO PS M subsp ace cl uster s by sear chi ng the seq uence data base f orward an d ba ckw ard sim ultaneou sly . KiWi m arks any cluster that contain s one or more an ti-correla ted genes . If an ‘anti- correlate d cluster’ con tains more than tw o genes it w ill by def inition c ontain b oth positively and negatively correla ted pairs of g enes . B. Datasets Several d atasets and m ethods were utili zed to t est for biol ogic al coher ence of gene clus ters predict ed by the KiWi clusterin g algorithm . Expression datasets utiliz ed include: (1) GPL96 - a set of 1640 Affymetrix (H G-U133 A) experiments from the Gene Expres sion Om nibus (GEO, GPL9 6) [ 21] cover ing a br oad r ange of exper imental co nditions; ( 2) expO - a set of 1026 Affymetr ix (H G-U133 Plus 2.0) experiments fro m 123 di fferen t canc er tiss ue ty pes from the ex pO (Ex pressi on Project for Oncolo gy) project (GEO, G SE2109) ; (3) Cooper pro moters - a high-th roughput pro moter dataset repor ted by Coop er et a l (2006) c onsisting o f 16 ce ll lines for which t he expre ssion of 632 promote r sequenc es (plus 98 nega tive control seque nces) were assayed by reporter gene assay [30]. The se data set s are summar ized i n Table 1. C. Dataset processing The Affymetr ix HG -U133A prob es were normaliz ed and mapped to gene/pr otein ident ifiers as previ ously rep orted [2 5]. The exp O data were normaliz ed from CEL file s using the Biocon ductor ‘just .gcrm a’ function in th e ‘gcrm a’ library (ver sion 2 .4.1) . Prob es were mappe d to Un iprot and Ens embl ide ntifiers using t he Biocond uctor ‘biomart ’ package [31] . The Coop er pro moter da ta were used a s prov ided. T ab-del imited data m atrices f or each dataset w ere load ed into th e KiWi software (v. 1.0) and subspace cluster s identified using the param eters outline d in Ta ble 3. Param eters w ere chosen by experim entation to iden tify valu es of k and w that would produce the largest number of clust ers and longe st patter ns but still run to complet ion w ithin 24 to 48 hours. D. Biological evaluatio n Groupi ng of prob es to comm on gene iden tifier . Af fymetrix gen e expr essi on ch ips (su ch as HG- U133 Plus 2.0, used for expO) co ntain numerou s probe sets derived from the same gene e ither as red undant pro be sets or prob e sets for diff erent transc ripts of the s ame g ene. I t is expe cted th at s uch probe s ets will d isplay co rrelated expression gi ven th at they meas ure the same or related trans cripts . Therefo re, we exp ect that pro be sets mapped to a comm on gene iden tifier w ill be grou ped tog ether in the same s ubspace clust er m ore ofte n than expecte d by chance. This represen ts a kin d of positive cont rol experi ment . The num ber of pro be pairs mapped t o the sam e gene w as dete rmin ed for all clu sters. S ignifican ce w as assess ed by rando m permutat ion anal ysis. That i s, 10000 set s of clusters were rando mly generated (with the same size s and dimensions as produ ced by KiW i). Th e mean num ber of redundan t probe pa irs for all clus ters was th en co mpared be tween K iWi and the dist ributi on of ran dom result s. Exp erime ntal ann otat ion an alysi s . KiWi subspa ce cluster s consist of a set of 2 or more gene s found to h ave correl ated ex pression patterns (spec ifically an O PSM) for som e subset of th e availabl e experim ents. Most vali dation m ethods look for biolo gically consist ent grouping of gene s. To dete rmine if th e experim ents ar e also gr ouped in a meaning ful way , an over-rep resentati on analy sis was app lied to exper imental a nnotatio ns. The expO dataset was chos en as this dataset is accompanied by carefully annotate d clinical details. For example, each experiment is annotated as one of 123 different tumor tissu e types. Clusters w ith a m inimum of tw o genes and 50 experiments were selec ted for analysis. Statistic ally over- represented experim ental annot ation ter ms were defined usi ng Fisher Exact statistic s and corrected for multiple tes ting by a Ben jamini and H ochberg (BH) correct ion with the Bioconduct or ‘mu lttest’ package . Overall sig nifican ce of the K iWi cluster s was determined b y compar ing to randoml y gener ated clusters using a Ko lmogoro v-Smirnov test. Negat ive co ntro l ana lys is . In the Co oper pr omoter dataset , the aut hors measured expres sion levels by repor ter ge ne assay for a la rge nu mber of pr omoter sequ ences acros s a s et of 1 6 differ ent cell lines. They al so inclu ded a larg e num ber of negat ive contro l seque nces (rando m DNA seque nce). Unlike the rea l prom oter se quenc es, w e do not expect th ese s equences to drive ge ne expressio n in any meaningful way. They may produce s ome low level ' noisy ' expression values but n othing coordina ted. Any cluster s formed from such data most likely repre sent random patter ns as opposed to meaningful pat terns. Therefo re, we can hypoth esize th at if Kiw i is detectin g ‘true’ or ‘real’ c lusters they shoul d be biased t owards positive s equences and against negative seq uences. To this end, we ran KiWi on expression data for al l sequences (positives an d negatives ) and dete rmin ed the fract ions of KiWi clust ers ‘c ontam inate d’ by negati ve control seq uences. Significa nce was determine d using a rand om perm utati on appr oach as des crib ed abov e. We also clustere d positive and nega tive sequenc es separat ely and compar ed t he number s, siz es (number of gene s) and pa ttern lengths (number o f e xperiments) o f cluster s for eac h datase t. cisRE D anal ysis . F or al l Coope r prom oter sequen ces (excl uding ne gative co ntrol seq uences) t he cisRED pipe line was used to pr edict p utative re gulator y motifs as descri bed previous ly [32]. Briefly, ci sRED uses m ultiple discov ery methods applied t o sequenc e sets that include u p to 42 orth olog ous se quence regi ons f rom ve rteb rates (most ly mamm als). Motif s ignif icance is estim ated by apply ing disc overy and pos t-pr ocessi ng m ethods t o rand omize d seq uence sets that ar e adap tive ly de rived from ta rget s equenc e sets. Mo tifs are then a nnotated ba sed on their similarity to known tra nscript ion factor binding si te (TFBS) mod els (using TRANSFAC 9.3 ). Motifs with p-values below a th reshold (disco very p-va lue < 0.0 01 and annotati on p-val ue < 0.000 5) are ret ained, groups of similar m otifs identifi ed and co- occur ring m otif pa ttern s defi ned. A ny s et of tw o or m ore genes with a c o-occurrin g motif pa ttern is hypothesize d to be c o- regul ated by on e or more tran script ion fact ors. W e can fur ther hypo thesize t hat these pu tative ly co-r egulated ge ne group s are more likely to b elong to a cluste r of coe xpres sed gene s (as defi ned by KiWi) tha n randomly for med gro ups of genes. To test this, a promoter sim ilarity score was define d. For ev ery KiWi clu ster, f or each pair of gen es in the cluste r, we ca lculate the num ber of cisRE D motifs an notated with the s ame TFBS model (c ountin g re peated annot ations on ly onc e; F igure 12) . More f ormally , we def ine } ,..., , { 2 1 , n i i i i l l l L = to be a s et of annotati on labels fo r n conserv ed motif s predicte d in the prom oter of a gen e “ i ”. Then we defin e a prom oter sim ilari ty scor e (S) as the av erag e number o f common anno tat ion lab els for ev ery pair ( i , j ) of genes from a KiWi cluster of size N as follows: ) 1 ( | | 2 , − = ∑ N N L L S j j i i ∩ R EFEREN CES [1] Jensen LJ, Lagard e J, von M ering C, Bork P: Arra yProspector: a web reso urce of func tional asso ciations inferre d from micro array expr ession data. Nucle ic Acids Res 20 04, 32( Web S erve r issue ):W445- 448. [2] Segal E, Fri edma n N, Koller D, Regev A: A mod ule ma p showing condi tiona l acti vity of expr ession mod ules in canc er. Nat Genet 2004, 36(10) :10 90-109 8. [3] Ol dham MC, H orvath S, Ges chwind D H: Co nserva tion and ev olutio n of gene coe xpr essi on n etworks in human an d chi mpan zee bra in s. Proc Natl Acad Sc i U S A 2006, 103 (47):1797 3-179 78. [4] Stuar t JM, Se gal E, Koller D, Kim SK : A ge ne-coe xpres sion netw ork fo r global d iscover y of cons erved gen eti c modules. Sci ence 2003, 302 (5643 ):249-255 . [5] Ke mmeren P , van Berkum NL, V ilo J, B ijma T , Donde rs R, Brazma A, Hol stege FC: Prote in interactio n ve rificatio n and fu nctio nal annot ation by inte grate d analy sis of g enome -scale data. Mol Ce ll 200 2, 9(5): 1133- 1143 . [6] Walhout AJ, Reboul J, Shtanko O, Bertin N, Vagli o P, G e H, Lee H, Douce tte-Stam m L , Gunsal us K C, Sche tter A J et al: Inte grating intera ct ome, ph enome, and tran scrip tome m apping da ta for th e C. elegan s germli ne. C urr Bi ol 2002, 12(22 ):1952 -1958. [7] Hav erty P M, Hans en U, W eng Z: Com putatio nal i nfere nce of tran scripti ona l regulat ory network s from expr ession profi lin g and tran scrip tion fact or bindi ng site id enti fica tion . Nucleic Acid s Res 2004, 32(1) :179- 188. [8] Segal E, Wan g H, Koll er D: Disc overing m olecu lar path ways from prot ein int eract ion and gen e expres sion data. Bi oinform atic s 2003, 19 Suppl 1:i2 64-27 1. [9] Ge H, Walh out AJ, Vid al M: Integra tin g 'omi c' in formati on: a brid ge betw een ge nomics a nd sy stems bio logy . Trends Genet 20 03, 19( 10):55 1- 560. [10] L i S , A r m s t r o n g C M , B e r t i n N , G e H , M i l s t e i n S , B o x e m M , V i d a l a i n PO, Han J D, Ch esneau A, Ha o T et al: A map of th e in tera ct ome netw ork o f the me tazoan C. ele gans. Scie nce 20 04, 3 03(565 7):540- 543. [11] Segal E, Shapi ra M, Regev A, Pe'er D, Botstein D, Koller D, Fried man N: Mo dule ne two rks: ide ntify ing re gulato ry mo dules and their condi tion -speci fic regu lat ors from gene express ion data. Na t Genet 2003, 34(2 ):166 -176. [12] Ihm els J, Bergm ann S, Barka i N: D efini ng tra nscrip tion modul es usi ng larg e-scale gene expr essio n data. Bioinfo rmatic s 200 4, 20( 13):1 993- 2003 . [13] Ley fer D, W eng Z: Genome -wide decodi ng of h ierarch ical mo dular stru ctur e of tran scri pti ona l regula tion by cis- element and expres sion clus terin g. Bioin format ics 2 005, 21 Su ppl 2 :ii197-ii 203. [14] Habe rer G , Mader MT , K osarev P, Spa nnagl M, Yang L, May er KF: L a rge-scal e cis-e lement dete ction by analy sis of co rrelate d expre ssion and seq uence co nservatio n betw een Arabido psis and Br assica ol eracea. Plant Physiol 2 006, 142 (4) :1589-1 602. [15] B e n - D o r A , C h o r B , K a r p R , Y a k h i n i Z : D i s c o v e r i n g l o c a l s t r u c t u r e i n gene expr ession da ta: th e order-pres ervi ng sub matri x prob lem. J Comp ut Biol 20 03, 10 (3-4):37 3-384 . [16] D e S m e t F , M a t h y s J , M a r c h a l K , T h i j s G , D e M o o r B , M o r e a u Y : Adapt ive qu ality- based cl usteri ng of g ene e xpress ion prof iles. Bioin formati cs 20 02, 18(5 ):735-746 . [17] Pre lic A, Ble uler S, Zimme rmann P, W ille A, Buhlma nn P, G ruissem W, Hennig L, T hiele L , Zitzler E: A system atic com parison a nd eval uation of bicl uster ing met hods fo r gene expr ession da ta. Bio infor matics 2006, 22(9 ):1122 -1129. [18] Wu CJ, Kasif S: G EMS: a web s erve r for bicluste ring a naly sis of expr essio n data. N ucleic Acids Res 2005, 33(We b Serv er iss ue):W 596- 599. [19] Madei ra SC, Oli veira AL: B iclu sterin g algori thms for b iologic al d ata analy sis: a survey . I EEE/ACM Trans Co mput Biol Bioinform 2 004, 1(1): 24-4 5. [20] L iu J, Wang W: O p-cluste r: Cl usteri ng by tende ncy in high dimens ional space . In: P roceeding s of t he 3rd I EEE I nternatio nal Conf ere nce on Dat a Mining. Melbourne, F L, USA: I EEE Computer So ciety; 200 3: 187-194. [21] B ar rett T, Su zek TO, Trou p DB , Wilh it e SE, Ngau WC, Ledoux P , Rudnev D, Lash AE, Fu jibuch i W, Edgar R: NCB I GEO: mini ng milli ons of exp ressi on profi les--da taba se and tools. Nucleic Acids Res 2005, 3 3(Datab ase issue ):D562- 566. [22] Sherlock G , Hernandez-Boussard T, Kasarskis A, Bin kley G, Matese JC, Dw ight SS, K aloper M, Weng S, Jin H, B all CA et al: T he Stanf ord Microa rray Data base. Nuc leic Acids Res 20 01, 29(1 ):152-15 5. [23] P e i J , H a n J , M o r t a z a v i - A s l B , P i n t o H , C h e n Q , D a y a l U , H s u M C : PrefixSpan : Mining Sequ ential Pattern s Efficiently by Prefix Projec ted Patter n Gro wth. I n: Pro ceedings o f the 2001 I nter national Co nfere nce on Data E ngineer ing. He idelberg , Germany : IEEE Edu cational Activi ties Depar tment ; 2001: 21 5-226. [24] Gao BJ, Gr iffi th OL, Ester M , Jones SJ: Discove rin g significant OPSM sub space c lusters in massi ve gene exp ressi on da ta. In: Proc eedin gs of the 12 th AC M SIGK DD I nternational Confer ence o n Know ledge Disco very and Dat a Mini ng. Phil adel phia, PA , USA : ACM P ress ; 2006: 922-9 28. [25] Gr iffith OL , Pleasance ED , Ful ton DL , Oveisi M, Ester M, S iddiq ui AS , Jones S J: Asses smen t and integra tion of pub licly avai lab le SAGE, cDNA micr oarray, and oligon ucleot ide m icroarra y expressi on d ata for glo bal coe xpress ion analy ses. G enomics 2 005, 86( 4):4 76-48 8. [26] Allo cco DJ, K ohane I S, Butte A J: Quant ifying the re lationsh ip betw een co-expres sion , co-regu lat ion and gene func tion. BMC Bioin formati cs 2004 , 5:18 . [27] Agr awal R, Sr ikant R: Mining Sequ ential Pa tterns . In: P roceeding s of th e Elevent h Interna ti onal C onf erenc e on Da ta En gineeri ng. Tai pei, Taiw an: IEEE Comp uter Society ; 1995: 3-14. [28] Dhill on I S, Marcot te EM, Roshan U : Diam etrical clus tering f or identif ying an ti-cor rel ated gene cl usters . Bioinfo rmatics 2003, 19(13) :16 12-161 9. [29] Qian J, Dolled-Filha rt M, Lin J, Yu H, Gerstein M: B eyond synexp ression relat ion ships: loc al clus terin g of time-sh ift ed and in verted gene expr ession pr ofiles i den tifies n ew, bi ologica lly rele vant inte ractions. J Mol Biol 2 001, 31 4(5): 1053- 1066. [30] Coop er SJ, Trink lein ND, Anton ED, Ngu yen L, Myers RM : Comp rehen sive an alysis of t ran script iona l promot er st ructure a nd funct ion in 1% of the huma n genome. Genom e Res 2 006, 16(1):1 -10. [31] Gentl eman RC , Care y VJ , Bates D M, Bo lstad B , Dettl ing M , Dudo it S, Ellis B , Gautier L, Ge Y, Gent ry J et al: Bi ocond uctor: op en software develop men t for c omputa tion al biolog y an d bi oinform atic s. Genom e Biol 20 04, 5 (10):R80 . [32] Ro ber ts on G , Bil en ky M, L in K , He A , Yu en W , Dag pin ar M, Var ho l R, Te ague K, Grif fith OL , Zhang X e t al: cisRED : a data base syste m for geno me-scal e computat ional dis cove ry of regulatory eleme nts. Nucle ic Acids Res 20 06, 34(Dat abase issue) :D68-73. Fig ur e 1 . KiWi results for th e GPL 96 dataset. The density plot sho ws the cluste r size (number of ge nes) versus pat tern length (numb er of experimen ts) for all c lust ers. The d ensity plot was produced usin g the Bi ocond uctor ‘h exbin ’ libr ary (versi on 2. 3.0 ). Fig ur e 2 . KiWi results for th e expO dataset. Fig ur e 3 . Ki Wi results for th e Cooper dataset. Fig ur e 4 . Prob e to c ommon gene an alysis. The mea n nu mber of p rob e pai rs in a clus ter th at a re map ped t o the s ame gene (re dundant probes) is shown f or each cl uster size (num ber of genes pe r cluster ). Error bars in dicate 95% conf idence limits. Fig ur e 5 . Experime ntal annota tion an alys is. The frac tion of c lust ers with at least one s ignific ant ly over-rep resen ted expe rimental annotatio n te rm at e ach leve l of signifi cance is s how n. Sign ific anc e was d etermi ned b y Fisher Exac t t est. P -valu es were c orrec ted by the B enjamin i and Hoc hberg m ethod and a re disp layed on a reverse l og sca le. Fig ur e 6 . Experime ntal anno tatio n analy sis e xcluding all anno tatio n term s exce pt tissue source . The fra ct ion of c lust ers wit h at lea st one si gnifi cant ly over-r epr esen ted tissu e source term at e ach le vel of signif icance i s show n. Signif icance w as det ermin ed b y Fisher E xac t test . P-valu es were c orr ect ed b y the Ben jami ni and Hoch berg met hod. Kolmo gorov-Smi rnov t est sh owed a s ignific ant diffe rence from r andom (p=0.0 05). Fig ur e 7 . Nega ti ve con trol ana lysis. The mean fr action o f ne gative co ntrol seque nces in cluded in eac h clus ter f or each clu ster s ize i s sh own. R esult s are br oken down by pat tern len gt h excep t for the rando m res ults for which al l clus ter siz es and pattern l engths sho wed const ant cont aminatio n by negativ e contr ols. Er ror bars indica te 95% confi dence limi ts. Fig ur e 8 . Ki Wi resu lts for C ooper d ataset with nega tive c ontrol seq uen ces (Ne gatives ) and real promote r seq uence s (Pos itives) cl ustere d separ ately . The two datase ts we re subm itted to KiW i with identical parame ter s (k=1 00000; w=16; min_r ow=2, min_c ol=6 ). The d ensit y plot sh ows th at the posit ive dat a inhe rently produces mor e cluste rs with l onger patterns ( mor e expe rime nts) and gr eater cluste r size (more genes ). Fig ur e 9 . cisRED analy sis. The mea n pr omoter simi lari ty sc ore (see met hod s) for ea ch clu st er size i s shown. Random exp ect ation is based on 2000 randomly gen erat ed c lusters for each cl uster siz e. Error bars in dicate 95% confi dence l imits. Fig ure 10. cisRED analy sis comp aring diff erent pattern l engths. The mean pro moter similar ity sco re for each patte rn le ngth is sho wn. A s with clus ter s ize (Fig. 9) th e promot er si mi larit y score in cr eases wi th great er patte rn le ngth (n umber of ex perime nts). E rror bar s in dicate 95% confide nce limi ts . Fig ure 11. Distributio n of me an Pear son corre lations f or all KiWi cluste rs for GPL 96 data. This fi gure sh ows that the vast maj ority of sub space c lusters (bi -clu sters) have very high averag e pairw ise cor relatio ns wit h 90% o f cl usters having an aver age r > 0. 95. Fig ure 12. Diagramma tic expl anation o f “prom oter similarity score”. For an y pair of genes , the up stream regi on i s compared for over lap of ann otat ed TFB S mot ifs (Sp1 , AP-2 , etc ). Th ese a re rep res ent ed a s colored shapes in the diag ram a bove. Each common mo tif is co unted once . The prom oters a bove s hare t wo moti fs (r ed squ are an d blue c ircle). Ther efore, th e score for t his gene pa ir i s 2. Th en, the overa ll p romoter s imi larit y score (S) for a cluster of ge nes is calc ulated as the sum of the pair wise scores divided by the number of pair s. TABL E I. D ATA SE T S U SED IN K I W I A SSESSMENT Datas et # of rows # of colum ns GPL96 1 2332 1640 expO 2 0113 1026 Cooper p romot ers 730 16 TABL E II. K I W I R ESU LTS Dataset # cl uste rs found Mean gen es/clus ter (range ) Mean ex ps/clust er (range ) GPL 9 6 13412 5.11 (2 to 162) 24.04 ( 11 to 108) ex pO 23555 3.89 (2 to 23) 42 .48 (10 to 120) Coope r 21253 2 6.79 (2 to 59) 6.85 (6 to 14) TABL E III. P ARAMETERS U SED IN K I W I A SSESSMENT Dataset k w Min. ge nes Min. exps GPL96 3 0000 45 2 10 expO 1 00000 18 2 10 Cooper 1 00000 16 2 6
Original Paper
Loading high-quality paper...
Comments & Academic Discussion
Loading comments...
Leave a Comment