A Canonical Measure of Allelic Association
The measurement of biallelic pair-wise association called linkage disequilibrium (LD) is an important issue in order to understand the genomic architecture. A large variety of such measures of association have been proposed in the literature. We prop…
Authors: ** - **J. H. H.** (주 저자) - **M. R.** - **S. K.** *(원문에 저자 정보가 명시되지 않아 정확히 파악할 수 없습니다.)* **
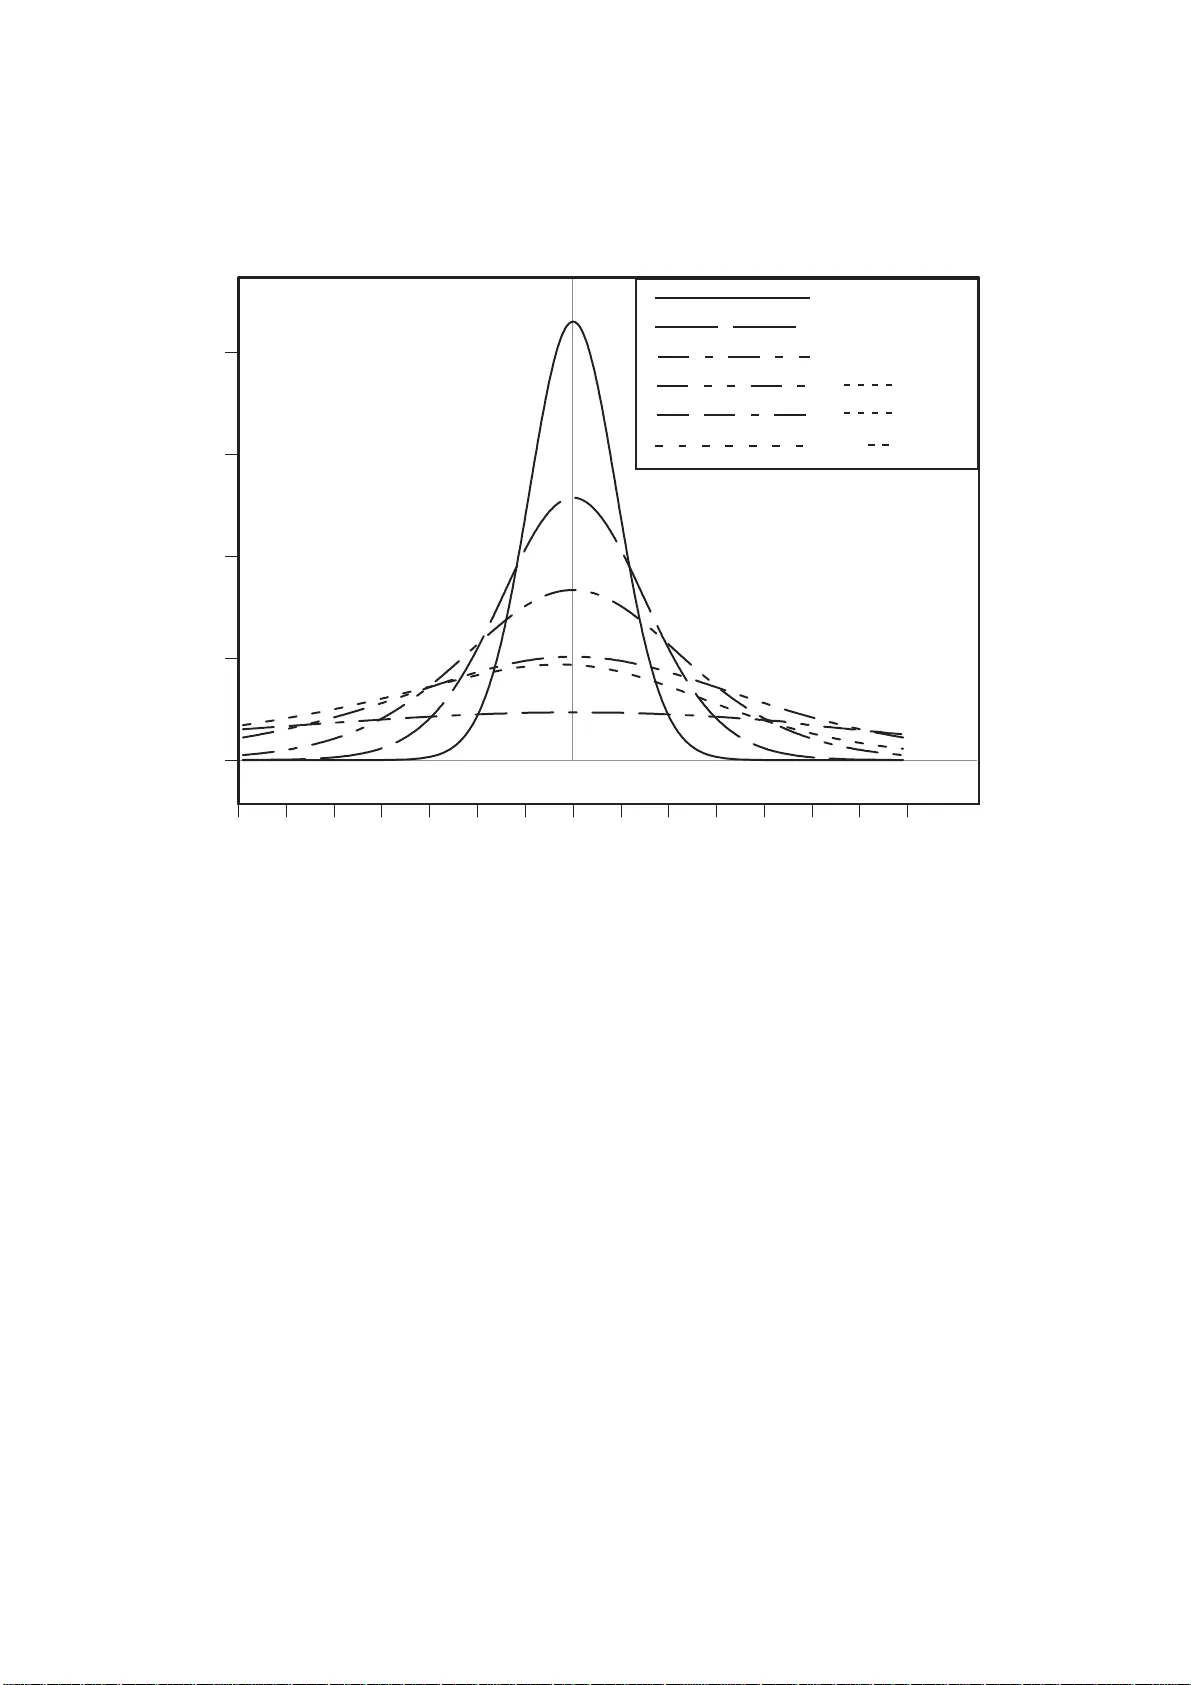
A Canonical Measure of Allelic Asso ciation Markus Sc holz & Dirk Hasenclev er Institute for Medical Infor matics, Statistics and Epidemiolo gy Univ ers it y of Leipzig Haertelstras se 16-1 8 04107 Leipzig Germany Corresp ondi ng author: Markus Scholz Univ ers it y of Leipzig Institute for Medical Infor matics, Statistics and Epidemiolo gy Haertelstras se 16-1 8 04107 Leipzig Germany T elephone: +49 34 1 97 16190 F ax: +49 34 1 97 16109 Running head: Canonical measure of asso ciation Abstract The mea surement of biallelic pair -wise a sso ciation ca lled link age disequilibrium ( LD) is a n impor tant issue in or der to understand the geno mic archit ecture. A large v ariety of suc h measures of ass o ciation in tw o b y tw o tables ha ve been prop osed in the literature. W e propos e and justify six biometrical postulates whic h should b e fulfilled by a canonical measure of LD. In short, LD m eas ur es are defined as a mapping of t wo by tw o probability tables to the set o f rea l nu mbers. They should be zero in case of indep endence a nd extr emal if o ne of the en tries approaches zero while the marginals are p os itively bounded. They should re flec t the symmetry g roup of tw o by t wo t ables and b e in v ariant under certain tra nsformations o f the marg inals (selection inv ar ia nt) . There scale should be maximally discriminative for arbitrary tables, i.e. ha ve maximum entropy rela tive to a calibr ating s y mmetric distribution on the manifold o f tw o b y tw o pro bability tables. None of the established measures fulfil all of th ese pr op erties in general. W e prove that there is a unique canonical measure of LD for each c hoice of a ca librating symmetric distribution on the set of pro bability tables. An explicit form ula of the canonical measure is der ived for Jeffreys’ non-informative Dirichlet prior distribution and the uniform Dirichlet distribution. W e compare the canonical LD measure s with other candidates fro m the literature. Based on the empirical distribution of as s o ciation encountered in t ypical SNP data we recommend the canonical measur e der ived from Jeffreys ’ no n-informative prior distribution when as sessing link age dis equilibrium. Resp ective R-pro cedure s are av a ilable o n request. In a second part, w e consider v arious estimators for the theoretical LD measur es discussed and compare them in an extensive simulation study . The usual plug-in estimator s based on frequencies can le ad to unreliable estimates. Estimation functions based on the computationally exp ensive volume measures were prop os ed recen tly as a r emedy to this w ell-known problem. W e c onfirm that v olume estimators hav e b etter ex p ected mean square er ror than the naive plug-in e stimators. But they are outp erfo r med by estimators plugging-in easy to calcula te non-infor mative Bay esian pro bability estimates into the theoretical f or mu lae for the measur es. Keyw ords: a llelic asso cia tion, Diric hlet distribution, link age disequilibr ium, maximum en tropy , t wo by tw o c o ntingency tables 1. In tro duction 1.1. Bac kground Mo dern genetic high-throug h-put metho ds incr easingly provide medium to large size data sets that consist of high dimensio nal vectors of binary markers. W e hav e b een par ticularly mo tiv ated by the example of SNP-chips that a ddress up to one million of biallelic single nucleotide poly morphisms (SNPs). Another exa mple of this data type is patterns of g enomic a b erratio n in tumo ur s that ca n be measured based aga in on SNP-c hip technology or b y matrix comp etitive genome hybridisation (mCGH). W e restrict our selves to one sample pro blems as oppo sed to tw o or more sample problems e nco un- tered in the context o f disease asso cia tion cas e-control studies. The fo c us is to detect highly linked pairs of markers. In the ca se of SNPs this kind o f asso ciation is ca lled link age dis equilibrium (LD). Highly linked SNPs a re in terpr eted to b e inherited to gether. LD indicates that a r ecombination even t betw een the tw o sites was rare in the p opulatio n under study . Ho wev er, there may be other r easons for high LD such as admixtur e or selec tion. Link age has b een analys ed to understand the ge nomic architecture esp ecially with r esp ect to rec o mbination hot-sp ots and jointly inherited haplo t yp e blo cks (Sc hulze et a l., 20 04; Service et al., 2 006). In the following w e alwa ys restrict o urselves to LD b etw een t wo biallelic m ar kers. A basic step in analysing such data is assessing a sso ciations b etw een markers in a very lar ge nu mber of tw o by tw o ta bles and compar ing asso c ia tions b etw een tables . A b ewildering plethora of measures of asso ciation are used in the liter ature (Devlin & Risch , 1 995; Hedrick , 198 7; Thomas, 2004). Some suggestions on the preferred use of single mea sures w ere made (Devlin & Risc h, 1995; Mueller, 2004). Most of these arguments are ba sed on biological issues such a s dep endence o n a llelic frequencies and rate o f decay (Hedrick, 1987) or o n practica l applica tions such a s co rrelation o f test statistics (Pritchard & Przeworski, 20 01) and determination of haplot yp e blo cks (Gabr ie l et al., 2 002). After a s hort review of different LD measur es, w e propos e a nd justify biometrical and statistical po stulates to cho ose b e tween meas ures of asso cia tion in the one sample ca se. W e conclude tha t none of the established LD measures fulfil all of the desira ble prop er ties in genera l. W e construct a family of canonical link age disequilibrium measure s which fulfil all of our p ostulates . F amily members differ in the choice o f a sy mmetric Dirichlet distribution on the set of all t wo by tw o contingency tables. Thes e Diric hlet distributions calibra te the scale of the measur e which ess entially mea sures the extremac y of LD relative to the given distribution. The new measures are co mpared with the established o nce. Finally , the problem of estimation of the new measure is addres sed and different estimators ar e compa red in a simulation study . 1.2. Measures of Link age Disequilibrium W e c o nsider to analyse c o ntingency tables o f t wo biallelic mar kers at one strand of the genome. Let T be the manifold o f all tetranominal proba bilit y models written as a t wo by tw o ta ble o f probabilities: T consists of all tw o by tw o matrices t with ent ries p ij ∈ R , ( i, j ∈ { 0 , 1 } ) fulfilling the pr op erties p ij > 0, P i,j p ij = 1. The p ij denote the probabilities o f the corr esp onding combination of the tw o alleles o f the markers i and j . In the following, we abbrev iate P 1 i =0 P 1 j =0 = P i,j , p i. = p i 0 + p i 1 and p .j = p 0 j + p 1 j for co nv enience. Here, the m ar ginals p i. and p .j denote the fr equencies of the alleles o f the tw o mark ers. Statistically , a measure of LD is simply a measur e of a sso ciatio n in the contingency table t . The following measures were defined in literature: D: The measur e D is the absolute deviation o f the observ ation fro m the exp ectation tha t the a lleles of marker i a r e rando mly combined with alleles of mar ker j under the assumption of c onstant marginals. Hence: D = p 00 − p 0 . p . 0 This measure is zer o in case of indep endence of the mar kers but extremal v alues dep end on the marginals. L ewontin ’ s D ′ (Lewon tin, 196 3): The widely used measure D ′ is a standardisation of the original measure D : D ′ = D D max where D max = min { p 0 . p . 1 , p . 0 p 1 . } if D ≥ 0 min { p 0 . p . 0 , p 1 . p . 1 } if D < 0 Lewon tin’s D ′ ranges from − 1 to 1 and tends to these v alues if o ne of the p ij tends to zero while the marginals a re b ounded aw ay from zero . Corr elatio n c o effici ent r (Hill & Rob er ts o n, 19 6 8): The usual correlation co efficient applied to binary data has s imila r p opularity a s D ′ . It also ranges from − 1 to 1 where an abs olute v alue of 1 is obtained when a diagonal of t tends to z e r o: r = D √ p 0 . p . 0 p 1 . p . 1 Odds r atio λ (Edwards , 1963): λ = p 00 p 11 p 01 p 10 The o dds ratio is the firs t qua nt ity which is no t directly dep endent on D and the ma rginals. It is well known that λ is indep endent of selection of sing le rows or columns of the ta ble t . It is thus often used analysing (tw o sample) ca se-control studies. The odds ra tio is extremal if one o f the p ij tends to zero while the marginals ar e b ounded a wa y from zer o. Y ule’s Q ( Y ule, 1900): Q = λ − 1 λ + 1 Since the co mmon o dds ra tio λ is not standar dised, th is quantit y ha s been defined as a function of λ which is b o unded to [ − 1 , 1]. It can a lso b e written as a difference of the tw o conditiona l proba bilities p 00 p 11 p 00 p 11 + p 01 p 10 and p 01 p 10 p 00 p 11 + p 01 p 10 (Hartung, 19 91). Mutual informatio n M I (Li et al., 200 8; W eav er & Shannon, 196 3): M I = X i,j p ij log 2 p ij − 1 X i =0 p i. log 2 p i. − 1 X j =0 p .j log 2 p .j M I has its minimal v alue zero when p 00 = p 0 . p . 0 and its maximal v a lue one only if t is diagonal with either p 00 = p 11 = 1 2 or p 01 = p 10 = 1 2 . Hence , M I is not norma lized. A further measure Dv ol has bee n prop osed by Chen et al. (Chen et al., 200 6). Rather than a new measure of LD it is an alternative estimation function for D ′ . D v ol is defined as the fraction of contingency tables with less extreme D in the spa ce o f all co ntingency ta bles with same s ign of D and fixed m ar ginals. The use of these mea sures has b een discuss ed extensively a nd it has b een recommended to calculate r when one marker is used to predict another mar ker and to use D ′ as a measure of recombination probability (Devlin & Risc h, 19 95; Mueller, 200 4). How ever, all these rec o mmendations lack of a clear definition of desired statistical prop erties of a measure of LD. Hence, the use a nd interpretation o f these m eas ures remain v ague. 2. The canonical measure of Link age Disequili brium 2.1. P ostulates for a Canonical Measure of Link age Disequilibrium In this section we list po stulates for a cano nical measure of LD giving b oth biological and mathematical justifications. P1 (Dom ain of asso ciation measure): A meas ure of LD is a co ntin uous function η : T → R . The LD measure η is formally defined on the manifold T of tetra nomial proba bility mo dels ( with t wo by tw o lay-out), not o n a set of concr ete r ealisations (for example as tw o by tw o data tables of sample size N ). Defining the LD measure and estimating it from concrete da ta ar e radically s eparate tasks. P2 (Lac k of asso ciation and complete l ink age disequili brium): T ables in link age equilibr ium show no asso ciation that is they fulfil p ij = p i. p .j ( i, j ∈ { 0 , 1 } ). Complete LD is present whenever at least one p ij approaches zer o while the marg inals retain a po sitive lower limit. When a new SNP emerges in a p opulation by a single m utation even t, the new allele is exclus ively found in conjunction with only one of the tw o alleles of a n already existing SNP . As long as no recombination even t o ccurs, the new SNP remains in complete LD with the o ther SNP . The cor resp onding tw o b y t wo table features a single zero cell. The measure r discussed above b ecomes extremal only if the underlying table approa ches diagonal for m. A dia gonal structure suggests po pulation admixture, spe c ific negative selection or a mutation e ven t giv ing rise to bo th SNP s simult aneo usly . The p o s tulate co vers all these cases. P3 (Symm etry): The LD measure η reflects the tw o by t wo symmetry structure of T : a) η is in v ariant under permutation of t he SNPs which means ma trix tra nsp osition. b) η changes sign when alle les o f a SNP , which are rows o r co lumns o f the table, are transp os ed. Since we consider the one-sample case none of the binary markers is distinguished. SNP transp osition and allele transp ositio n generate a symmetry gro up (a dihedral group D 4 ) that should leav e a measure of a sso ciatio n es sentially inv ar iant. Requiring an tisymmetry and thus introducing a s ig n to the link age disequilibrium measure is con venien t in applications where we ha ve well defined marked states of the mar kers (Thomas, 2 004). Alterna tively , one may just take the absolute v alue of η to obtain a meas ure inv a riant under the full symmetry group. Note that P3 implies that tables in link a ge e q uilibrium are mapp ed to zero, s ince tra nsp osing pres e rves the co ndition of no asso cia tion. P4 (Sel ection inv ariance:) The L D measure η is not changed by selec tio n of alleles of o ne SNP that does not affect the co rresp o nding allele frequency ratios o f the other SNP . In other w ords, m ultiplication of columns or rows by p ositive num b ers and re no rmalisatio n o f the ta ble do es not change the measure of associa tion. Selection of allele s and genetic drift is co mmo n dur ing the course of evolution in a population. Allele frequencies fluctuate a nd differ in distinct po pulations. The meas ure of LD should c a pture an intrinsic prop erty of the genome architecture that reflects the structura l probabilit y of a recombination ev ent betw een tw o mar kers. It sho uld thus not depend o n the marg inal allelic frequencies that happ en to b e observ able in a g iven p opula tion. In a ddition, ther e may o ccur sampling selectio n in obtaining the data tha t intro duces bias. Using a selection inv a riant measure of asso ciation safeg ua rds against th is danger up to a certain deg ree. Selection inv ar iance is particula rly impo r tant if the mea sure of a sso ciatio n is intended to be mea ning- fully co mpared b etw een t ables with mar kedly different marg ina l distributions (a llele f req uenc ie s). P5 (Standardization): The LD mea sure η is standar dized to v alues in ( − 1 , 1). The ex tremal v alues ± 1 stand for p erfect LD. T o achieve uniqueness w e r equire that η ( t ) → 1 fo r t → 0 . 5 0 0 0 . 5 P6 (Maximum Ent ropy) : The L D measure η s hould cla s sify arbitra ry tables of T a s discrimina- tively as pos s ible. T o for ma lise the notion of arbitra ry tables we c ho os e a symmetric ”non- informative” distribution on T and require that the induced distribution o f the LD measure η has max imum entrop y . Tha t is it is unifor m o n ( − 1 , 1). Postulates 1 to 5 do not determine yet the scale for ass o ciation v alues b etw een 0 (indep endence) and the ex tremal v alues ± 1. The sixth pos tulate req uires using a most informa tive and discriminative scale. The LD mea sure η s ho uld b e a go o d general clas sifier o f arbitr a ry tables of T . No particula r v alue of the LD mea sure η within ( − 1 , 1) should b e priv ileged. Therefore, we require tha t η hav e a uniform (m aximum entrop y) distributio n on ( − 1 , 1) when sa mpling ar bitrary tables from T . Postulate 6 implies the choice of a sy mmetr ic ca librating distribution on T to sp ecify sa mpling ”arbitra ry” tables. In theorem 2 w e will see that η has an intu itive interpretation based on the prop ortion o f tables ha ving less extreme LD than the giv en one in the chosen distribution. Later we calculate the LD measure η for Dirichlet distributions D ( α ), α = ( α 00 , α 01 , α 10 , α 11 ) ( α ij > 0). This family of distributions is often used in a B ayesian con text as prior distribution for contingency tables since it is the conjugate pr ior to the multinomial distribution (Geisser, 1984; W alley, 1 996). The density of the Dirichlet distribution is given by: f D ( α ) = 1 B ( α ) Y i,j p α ij − 1 ij where B ( α ) = Q i,j Γ ( α ij ) Γ P i,j α ij is the Beta-function and Γ denotes t he Gamma function. The Dirichlet distributions are symmetric (inv a riant under transp ositio ns of columns or rows) if and only if all α ij are equal. F or simplicity of notation, we iden tify the vector α with one of its co mpo nents in the symmetric case . A principled choice for a symmetric non-informative distributio n on T to define the canonical LD measure η may be the well-kno wn non-informative Jeffreys’ pr ior α = 1 2 (Geisser, 1984; Jeffre y s, 1961). In addition, with D 1 2 the dis tribution of the m inor ma rginal frequencies is unifor m on [0; 0 . 5] which in our ex pe rience is often encountered in SNP-arr ay-data. W e a lso discuss the ch oices α = 1 a nd α = 2. 2.2. Construction of a Canonical Measure of Link age Disequilibrium W e will now ex plo re the cons e q uences of this set of p ostulates . In par ticular, we will show that for any contin uous symmetric distribution o n T the canonica l LD measur e η exists a nd is unique. Later we will calculate η for symmetr ic Dirichlet distributions. W e start with a clo ser lo ok at selectio n in v ariance. Selection in v ariance ma y be formalised as the action of a suitable gro up G on T : Consider the gr oup G = ( R + × R + , · ) with component-wise multiplication. F or every ( µ, ν ) ∈ R + × R + we define a map: g ( µ, ν ) : T − → T t = p 00 p 10 p 01 p 11 7− → g ( µ, ν )( t ) = 1 µν p 00 + µp 01 + ν p 10 + p 11 µν p 00 µp 01 ν p 10 p 11 (2.1) Since g ( µ, ν ) ◦ g ( µ ′ , ν ′ ) = g ( µ · µ ′ , ν · ν ′ ) and g (1 , 1) = I d T this defines a G-group a ction on T . A function η : T → R is defined as selection inv ariant if η ( t ) = η ( g ( µ, ν )( t )) for all ( µ, ν ) ∈ R + × R + . Lying in the same group orbit defines an equiv alence relation o n T : W e say tw o elements t 1 , t 2 ∈ T are equiv alen t t 1 ∼ t 2 if and only if there are ( µ, ν ) ∈ R + × R + with g ( µ, ν )( t 1 ) = t 2 . Thus every s election inv ariant function η : T → R induces a well-defined map ˜ η : ˜ T → R on the quotien t space ˜ T = T / ∼ . Theorem 1 (o dds ratio): a) The odds ratio λ : T → R ; t = p 00 p 10 p 01 p 11 7→ λ ( t ) = p 00 p 11 p 01 p 10 is selection in v ariant. b) The odds ratio induces a homeomor phism ˜ λ : ˜ T → R + . c) The in verse mapping ˜ λ − 1 : R + → ˜ T ca n b e described b y l 7− → √ l 2 · (1+ √ l ) 1 2 · (1+ √ l ) 1 2 · (1+ √ l ) √ l 2 · (1+ √ l ) d) E very selection- inv ariant function η : T → R can b e written as a function of λ , namely η = ( ˜ η ◦ ˜ λ − 1 ) ◦ λ . Pro of: a ) is eas ily verified. Ev ery equiv alence class [t] in ˜ T has a representant with marg ina ls 1 2 , namely [ g ( q p 11 p 10 p 00 p 01 , q p 11 p 01 p 00 p 10 )( t )] which has the form g iven in c). d) is trivial. ✷ F or every distribution D on T the o dds ra tio λ induces the distribution λ ∗ ( D ) o f the corr e s p o nd- ing o dds ratios on R + . Theorem 2 (E xistence of a canonical LD measure): Let D b e a symmetric (non-informative) distribution on T . Let L denote the cumulativ e distribution f unction of λ ∗ ( D ) on R + . Define η ( t ) = 2 L ( λ ( t )) − 1 (2.2) Then η is the unique canonica l LD meas ure that fulfils p ostulates P1-P6 chosen D . Pro of: Because of theorem 1 the measure η depends only on the o dds r atio λ of the table. By construction η is uniform on ( − 1 , 1). The remaining p ostulates and uniqueness a re ea sily verified. ✷ Remark: Note that this construction provides η with a n intuit ive interpretation. η ( t ) is a signed measure of extr e mality of the o dds ratio λ ( t ) relative to an underlying calibr ating distr ibution D of arbitrar y tables on T . It is based on the prop ortion o f ta bles with less extreme odds ratio in this distribution. 2.3. Calculation of t he Canonical Measure of Link age Disequilibrium for Symmetric Diric hlet Distributions W e determine the distribution function of the o dds ra tio λ under the Dirichlet distribution D ( α ). Define Ω Λ = { t ∈ T : λ ( t ) < Λ } ∀ Λ ∈ R + W e ca lculate Z Ω Λ f D ( α ) = 1 B ( α ) Z Ω Λ p α 00 − 1 00 p α 01 − 1 01 p α 10 − 1 10 (1 − p 00 − p 01 − p 10 ) α 11 − 1 dp 00 dp 01 dp 10 (2.3) Using the form ula p 10 = (1 − p 00 − p 01 ) p 00 λp 01 + p 00 we tra nsform the co o rdinates ( p 00 , p 01 , p 10 ) to ( p 00 , p 01 , λ ) with the co r resp onding functional deter mi- nant ∂ ( p 00 , p 01 , p 10 ) ∂ ( p 00 , p 01 , λ ) = (1 − p 00 − p 01 ) p 00 p 01 ( λp 01 + p 00 ) 2 F urthermore, Ω Λ can be parameterized b y p 00 ∈ (0 , 1), p 01 ∈ (0 , 1 − p 00 ) and λ ∈ (0 , Λ). Hence, (2.3) can b e written as Z Ω Λ f D ( α ) = Z Λ 0 l ( λ ) dλ (2.4) where l ( λ ) = λ α 11 − 1 B ( α ) Z 1 0 Z 1 − p 00 0 p α 00 + α 10 − 1 00 p α 01 + α 11 − 1 01 (1 − p 00 − p 01 ) α 10 + α 11 − 1 ( λp 01 + p 00 ) α 10 + α 11 dp 01 dp 00 (2.5) is the probabilit y densit y of λ under the Dirichlet distributio n D ( α ). A plot of this densit y can be found in figur e 1 for some special Diric hlet dis tr ibutions. In the follo wing, we consider symmetric Dirichlet distributio ns and denote the co rresp onding canonical LD measure with η α . In ca se of α ∈ 1 2 , 1 there ar e ana lytic formulae for η α which will be deriv ed now. Theorem 3 (Analytic form ula for η 1 ): η 1 ( λ ) = 2 λ 2 − λ − λ ln λ ( λ − 1) 2 − 1 ∀ λ 6 = 1 (2.6) The g ap of definition at λ = 1 can be remov ed by tak ing the limit lim λ → 1 η 1 ( λ ) = 0 . Pro of: A t first we s olve the double integral for l in (2.5) l ( λ ) = 6 Z 1 0 Z 1 − p 00 0 p 00 p 01 (1 − p 00 − p 01 ) ( λp 01 + p 00 ) 2 dp 01 dp 00 (2.7) Using par tial frac tio n decomp ositio n we obtain after some calc ulation l ( λ ) = − 6 Z 1 0 p 00 λ 3 2 λ − 2 λp 00 + (2 p 00 + λ − λp 00 ) ln p 00 p 00 + λ − λp 00 dp 00 (2.8) The only s ummand in (2.8 ) causing difficulties is R p 00 (2 p 00 + λ − λp 00 ) ln ( p 00 + λ − λp 00 ) dp 00 . It can be solved by substitution of p 00 (1 − λ ), where it is necessary to distinguish λ > 1 and λ < 1. A singularity o ccurs for λ = 1 which ca n be r emov ed separately . After a longer calcula tion it follows that l ( λ ) = 2 − 2 λ + ln λ + λ ln λ ( λ − 1) 3 ∀ λ 6 = 1 (2.9) and l (1) = lim λ → 1 l ( λ ) = 1 6 . With equation (2.9) the third integral can b e calculated Z Λ 0 l ( λ ) dλ = Z Λ 0 2 1 − λ + 2 ln λ ( λ − 1) 3 + ln λ ( λ − 1) 2 dλ Both summands can b e dealt with using partial integration Z Λ 0 l ( λ ) dλ = Λ 2 − Λ − Λ ln Λ (Λ − 1) 2 ✷ Theorem 4 (Analytic form ula for η 1 2 ): η 1 2 ( λ ) = 2 π 2 Z λ 0 ln y √ y ( y − 1) dy − 1 (2.10) This in tegral ca n a lso b e express e d in terms of the dilogarithm function dilog x = − R x 0 ln | 1 − y | y dy (see Maximom (2 003) for pro per ties o f dilog ) for which g o od numerical pro ce dures a re av a ilable (Ko elbig ). η 1 2 ( λ ) = 4 π 2 ( ln √ λ ln √ λ − 1 √ λ + 1 + dilog √ λ − dilog − √ λ ) − 1 (2.11) Again, there is a gap of definitio n a t λ = 1 which can b e resolved by lim λ → 1 η 1 2 ( λ ) = 0. Pro of: Equatio n (2.1 0) follows dire c tly fro m equation (2.5 ) a fter elementary integration. Equation (2.11) follows from (2.10) after substitution of √ y and par tial integration. ✷ 2.4. Comparison of the Canonical LD Measures with Commonly Used LD Measures In this section we compare the canonica l LD measures, esp ecially η 1 and η 1 2 , with e s tablished mea s ures of LD represented by its most c ommon re presantativ es D ′ , r and Q . W e analyse their commonalities, differences a nd b ehaviour in special situations with the help of seven rema rks. Remark 1: All LD meas ur es based o n the o dds ra tio λ , such as η α (for α > 0) and Q , a re strictly monotone functions of each other. Figures 2 illustrates these functional re la tions. Remark 2: The measure Q is a go o d appr oximation for η 2 with max t ∈ T | Q ( t ) − η 2 ( t ) | ≈ 0 . 0 35. Hence, Q is appr oximately uniformly distributed under D (2). O ptima l ag reement o f Q and η α is obtained for α ≈ 1 . 77 with max t ∈ T | Q ( t ) − η α ( t ) | ≈ 0 . 0 13. Remark 3: The LD meas ure r needs a diagonal structure to appr oach the extremal v alues o f ± 1 while D ′ , Q and η α (for α > 0) co uld become extremal whenev er one table entry tends to zer o. T hus for tables with D ′ , Q or η α near 1 , r may assume v alues in (0 , 1). C o mpare Figure 3. Remark 4 : The LD measur es D ′ and r ar e not selection inv ariant. Pro of: W e pr ov e this by an example. Let t 1 = 1 8 3 1 1 3 and t 2 = 1 12 9 1 1 1 . It holds that t 1 ∼ t 2 with µ = ν = 3. O ne ca lculates that D ′ ( t 1 ) = r ( t 1 ) = 1 2 while D ′ ( t 2 ) = r ( t 2 ) = 2 5 . On the o ther hand λ ( t 1 ) = λ ( t 2 ) = 9. ✷ It is not surprising that measur es depending on D a re not selection-inv ariant s ince the concept of D is based on consta nt margina ls while selectio n may change these. Remark 5: F or every ε > 0 there is a table t ε ∈ T such that | D ′ ( t ε ) | < ε and λ ( t ε ) > 1 ε . Hence, there ar e tables for which D ′ measures almo st no LD and λ , Q and η α measure almost per fect LD. Pro of: Consider for example t δ = (1 − δ ) 2 + √ δ 3 δ (1 − δ ) − √ δ 3 δ (1 − δ ) − √ δ 3 δ 2 + √ δ 3 for δ > 0 sufficien tly small. Then it follows that lim δ → 0 D ′ ( t δ ) = 0 and lim δ → 0 λ ( t δ ) = ∞ . ✷ Note ho wev er that this a bnormality only o ccur s when three table entries tend to zer o. C o mpare Figure 4. Remark 6: F or tables with not t o o imbalanced marginals, monotonicit y betw een D ′ and odds ratio based measures is essentially pres e rved. T able 1 s hows the Kendall correlation co efficie nt determined for tables with sp ecified marginals. Remark 7: On a set of ta bles with constant margina ls , p 00 is uniformly distributed under D (1). Thu s after sta ndardisation with D max , D ′ is uniformly distributed on ( − 1 , 1) and has maxim um en- tropy in this case. By constructio n the canonica l LD measur e s η 1 and η 1 2 are unifor mly distributed when pa ired with their resp ective Dirichlet distribution. Compare Fig ur e 5. 3. The Estimation Problem for LD Measures W e now inv estiga te v arious estimator s for the theoretica l link age disequilibrium mea sures discussed ab ov e. Here, we do not addr e ss the pro blem that the entries n ij sometimes m ust als o b e estimated from real data by a phasing algorithm in case of double heterozygote markers. This ca n be done for example with the help of the exa ct solutio n of an EM-algo rithm (see W eir (19 96) for details). At this step it is nece s sary to assume haploid p opulatio ns or p olyploid p opulatio ns in Hardy-W einber g equilibrium. Estimation is based on observed contingency tables t N = n 00 n 10 n 01 n 11 with n ij ∈ N a nd P i,j n ij = N . The table t N is regar ded as a ra ndo m realizatio n of the true ta ble t ∈ T under the co rresp o nding tetranomial distribution with sample size N . The tables t N form a s ample space T N of a ll p o ssible realizations of t after N -fold sampling. In th e follo wing, w e will define and co mpare differ e nt fa milies of c onsistent es timators for link age disequilibrium measur es given an o bs erv ation t N ∈ T N . 3.1. Estimators for LD Measures The common a pproach is the use of ”plug-in” estimates, where the proba bility e stimates ˆ p ij of p ij are inserted into the theoretica l for mula of a measure. O ften, the frequency maximum-lik eliho o d estimates n ij N of p ij are used. Howev er this m ay lead to inflated or undefined estimates of the desired quantit y es pe c ially in c ase of small sample sizes (T ear et al., 2 002). This appr oach has b een used bo th extensively a nd car elessly in the literature to e stimate for exa mple D ′ and r . W e will deno te corres p o nding estimators a s naive estimators N E . F or a ny LD measure M it r e ads ˆ M N E ( t ) = M ˆ t with ˆ t = n 00 N n 01 N n 10 N n 11 N (3.1) An a lternative appro ach is using ”non-infor ma tive” Bay esian probability estimates for p ij (W alley, 1996). ˜ p ij = α + n ij 4 α + N with α ∈ 1 2 , 1 (3.2) which is the exp ectation of the posterio ri distribution D ( α + n ) w ere n = ( n 00 , n 01 , n 10 , n 11 ). Ca lcu- lating M with the help of ˜ p ij instead of p ij yields a consisten t semi-naiv e estimator S N E . It has the form ˆ M S N E ( t ) = M ˜ t with ˜ t = ˜ p 00 ˜ p 01 ˜ p 10 ˜ p 11 (3.3) A further approach is to ca lculate the expec tation of M under a p os teriori distribution which is the ordinary Bayes estimator B E ˆ M B E ( t ) = Z T f D ( α + n ) M ( t ) dt = 1 B ( α + n ) Z 1 0 Z 1 − p 00 0 Z 1 − p 00 − p 01 0 p α 00 + n 00 − 1 00 p α 01 + n 01 − 1 01 p α 10 + n 10 − 1 10 · (3.4) (1 − p 00 − p 01 − p 10 ) α 11 + n 11 − 1 M ( t ) dp 00 dp 01 dp 10 Finally , so me LD measures ca n b e estimated with a so- called volume formula. The concept of vol- ume measures can be traced bac k to Hotelling (1939) and has been applied to co nt ingency tables by Diaconis & Efron (1985) and to link age dise q uilibrium measures b y Chen e t al. (2006). In the simplest case, the idea is to count the n umber of tables which a re less ”extr eme” than an observed table and compare this ”volume” with the total v olume of all po ssible tables. Chen et al. (2006) defined D v ol a s the num ber of tables with fixed marg ina ls, fixed sign of D a nd less extreme v alues of D divided by the num ber of ta bles with fixed ma r ginals and fixed sign of D . In the o riginal definition, this measur e is alwa ys grea ter or eq ual to 0 and less than 1 . F o r b etter comparability with the o ther estimators, we co nsider an obvious sig ne d version ˆ D ′ V E with v alues in the int erv al ( − 1 , 1) b y assig ning the sign of D of the o bserved table t N . The cla imed adv antage of this estimating pro cedur e is tha t ˆ D ′ N E is inflated (T ea r et al., 2002) while ˆ D ′ V E is not in case o f tables with small num b ers where the o c currence of zer os is lik ely (Chen et al., 2006). Generalising this a pproach, we define a n estimation function ˆ η V E α for η α . An y Dirichlet distribution D ( α ) induces a pr obability distribution w α on the sample space T N and thus a discrete probability distribution o f the corr esp onding o dds r atios λ ˜ t . W e define ˆ η V E α ( t N ) in analo gy to equa tion (2.2 ) as the pr obability under D ( α ) to obtain an o dds ratio less extreme than λ ˜ t N standardised to ( − 1 , 1). By construction, the function L in (2.2) can be interpreted a s the ”volume” of tables with s maller odds ratio t han Λ divided by the total volume of all ta ble s in T N . Note tha t T N contains all tables with fixed sum of en tries but not fixe d ma rginals a s in the defi- nition o f ˆ D ′ V E . This definition can b e used to construct a nother estimation function for η directly from t he observed contingency ta ble t N . In con trast to the construction of ˆ D ′ V E we w ill not assume that all alternative tables t N ∈ T N are equally likely . Ther efore, we calculate the probability of a single table t N given a Dirichlet distribution. Theorem 5: Let w α ( t N ) be the probability o f the table t N ∈ T N under the distribution D ( α ) on T N , then w e have w α ( t N ) = N B N , P i,j α ij Q i,j n ij B ( n ij , α ij ) (3.5) where we define nB ( n, x ) = 1 for n = 0, x > 0 a nd B is the Beta-function. Pro of: Let M ( n, p ) b e the multinomial distributio n o f n ij under th e probabilities p ij , then w α ( t N ) = pro b ( t N | D ( α )) = Z T M ( n, p ) f D ( α ) dp = C Z 1 0 Z 1 − p 00 0 Z 1 − p 00 − p 01 0 p ˜ n 00 00 p ˜ n 01 01 p ˜ n 10 10 (1 − p 00 − p 01 − p 10 ) ˜ n 11 dp 10 dp 01 dp 00 where C = 1 B ( α ) N n ij and ˜ n ij = n ij + α ij − 1. Using the ident ity Z y 0 x n ( y − x ) m dx = y m + n +1 B ( m + 1 , n + 1) it follows that w α ( t N ) = C B ( ˜ n 10 + 1 , ˜ n 11 + 1) B ( ˜ n 01 + 1 , ˜ n 10 + ˜ n 11 + 2) B ( ˜ n 00 + 1 , ˜ n 10 + ˜ n 01 + ˜ n 11 + 3) = C Q i,j Γ ( n ij + α ij ) Γ P i,j n ij + α ij Rewriting the last equation yields equation (3.5). ✷ Remark: O bviously , f or the Dirichlet distribution D (1) we hav e w = 1 ( N +3 3 ) constant. With the last theor em, the v olume estimato r for η can b e defined. Let ˆ λ ( t N ) = ( n 00 + α 00 ) ( n 11 + α 11 ) ( n 01 + α 01 ) ( n 10 + α 10 ) (3.6) be the semi- naive estimator for the odds ratio, then, we define ˆ l ( λ ( t )) = N X i =0 N − i X j =0 N − i − j X k =0 w ( i , j, k , N − i − j − k ) χ ˆ λ ( t i,j,k,N − i − j − k ) , ˆ λ ( t N ) with t i,j,k,l = i j k l where the indicator function χ has the form χ ( λ 1 , λ 2 ) = 1 : λ 1 < λ 2 1 2 : λ 1 = λ 2 0 : else And finally ˆ η V E D ( α ) ( λ ( t )) = 2 ˆ l ( λ ( t )) − 1 (3.7) 3.2. Comparison of Estimators W e compared thes e estimation functions in a simulation study . Firs t, we simulate true tables b y random dr awing fro m s pe cified Dirichlet distr ibutions. F ro m it, true v alues of the link age disequilibrium measures can be calculated. In the next step, we co nstruct a concrete rea lization of the tr ue ta bles by random dra wing from the corresp onding multinomial distribution with different sample sizes N . The estimation functions are co mpared with respect to their expected mean square err or. The a nalysis is p erformed for η 1 , η 1 2 , D ′ , r , Q a nd corr esp onding estimation functions. Results can b e found in table 2. Because of different v ariances of the true meas ur es, we ca n o nly compare different estima to rs for one and the s a me LD measur e. How ever, the results fo r η are compa r able to those for D ′ and Q . Lo oking at the res ults presented in table 2 we can summarize the follo wing obser v ations. Observ ation 1: F o r all scena r ios and measures , the naive estimator has the highest mean sq ua re error . Observ ation 2: Semi-naive and Bayes estimators p er form almost e q ually well for all measur es. How- ever, as expe cted the Bay es estimator p er forms b est if the defining distribution equals the sampling distribution of the tables. The semi-naiv e estimator is r o bust against v ariation o f the sa mpling distri- bution. Observ ation 3: The volume estimator for D ′ is better than the naive estima to r but w or s e than the semi-naive estimators. It is esp ecially worse in case of s ampling dis tr ibution D 1 2 were small ent ries of the tables are likely . Observ ation 4: The volume estimator per forms compar able to the semi-naive a nd Bayes estima- tor for both η 1 and η 1 2 . Summarising these r e sults, we sug gest to use one of the se mi- naive estimators to estimate all link - age disequilibrium mea sures considered. The Bayes estimator s a re not b etter but are computationally more ex p ens ive. The same holds true for the volume estimators. Mor eov er, fo r D ′ the volume esti- mator is clearly outperfo rmed by the s emi-naive estimator s if the occurr e nc e of small table entries is likely . 3.3. Numerical Issues The analy tic s o lutions (2.6) and (2.11 ) cause numerical problems, b ecause of the sing ularity for λ = 1 in co mbination with the differences in the numerator. Hence, in the neighbourho o d of λ = 1 it is useful to repla ce the a nalytic for mula by the co r resp onding T a ylo r serie s . After some calculation o ne finds that η 1 (1 + ε ) = 1 6 2 ε − ε 2 + O ε 3 (3.8) η 1 2 (1 + ε ) = 1 π 2 2 ε − ε 2 + O ε 3 (3.9) where O is the first Land au o rder symbol. The calculation o f the Bayes es timator of η is a lso computationa lly co mplicate. W e sugg est to use Monte-Carlo integration in combination with a quick sa mpling to ol for Dirichlet distributions. The calculation of th e v olume estimator for η is computationally exp ensive as w ell if the n um b er of ha plo- t yp es is high, since computational eff or t rises with O N 3 . Algorithms o f all metho ds hav e be e n implemen ted in the statistica l softw are R (Ihak a & Gentleman, 1996). W e will provide the scripts up on r equest. 4. Discussion In this paper w e prop o s ed and justified six postulates for a cano nical measure of (allelic) asso ciation (link a ge disequilibrium) in tended for a pplica tion to one-sa mple t wo by t wo co ntin gency ta bles T : The measure is a mapping of T to the set of real n umbers. It should be zero in case of indep endence and extremal if one of the ent ries a pproaches zero while the marginals are p os itively b o unded. It should reflect the symmetry group o f tw o b y tw o tables a nd b e inv ar iant under certain tr ansformations of the marginals (selection inv a riant). Their sca le should b e maximally discriminative for ar bitrary tables relative to a calibra ting (symmetric) distribution on th e manifold of t w o b y tw o pro bability tables . W e pr ov ed that there is a unique cano nical LD measure for e a ch c hoice of a ca librating symmetr ic distribution o n T . This ca libr ating distribution s pe c ifies an eas y -to-interpret scale essentially based on the fra ction of tables ex hibiting a less e xtreme o dds ra tio than the given one. Althoug h we will use Bay esian and empiric al Bay esian co nsiderations in the following in or der to motiv ate the choice o f the calibrating distribution, it is only nice but not necessary that t he calibr a ting distribution is a prop er Bay esian prior for data at hand. The canonic a l LD mea sures hav e maximum entropy relative to their defining calibrating dis tr ibution. The principle of maximum entrop y classifier s is not new and has be en applied to several ar eas of int eres t (for example Nigam et al. (19 99); Zhu et a l. (20 05)). Howev er, to our knowledge ther e is no application of ma ximum entropy classifiers to the problem of ass o ciation measures of tw o by tw o con- tingency tables . Theoretical and empirical arg uments suppo rt the c hoice of D 1 2 as calibra ting distribution. D 1 2 is Jeffreys’ non-infor mative prior on T der ived from a n information in v ariance principle (Je ffr eys, 19 61). D 1 2 induces the uniform distribution o n the margina l frequencies and is weakly informative co nc e rn- ing the odds ra tio (confer Fig ure 1). Empir ically in o ur exp e r ience, SNP-ar ray data o ften exhibit a rather uniform distribution of minor allele frequencie s when disr egarding extremely rare SNPs (confer Figure 6). Conse q uent ly , η 1 2 tends to ha ve a roughly uniform distribution when ca lculating pair-wise LD in a small regio n of the genome (confer Fig ur e 7 ). Thus η 1 2 can a lso b e interpreted in an empirical Bay esian way as the fraction o f tables in the analysed data exhibiting a less extreme odds ratio than the g iven one . Hence, for applicatio ns in SNP da ta we recommend the us e of η 1 2 . In situations whe r e most tables hav e less im balanced margina ls, Q (corresp onding to η 2 ) is a reasona ble alternative. The po pular measures D ′ and r are not s e le ction inv a r iant. D ′ is motiv ated by a biologica l mo del of h uman evolution and genomic structure which is not in t he focus o f our biometrical p oint of view (Morton et al., 2001; Shete, 20 03). Selection inv a r iance is particula rly impo rtant if one wants to com- pare LD b etw een pairs of SNPs acro ss the g e nome or acro ss different p opulations. In this case o ne needs a measur e of a sso ciation tha t can b e compared b etw een tables with markedly different margina l distributions (alle le frequencies). The measur e r (and M I ) is extr emal when a diagona l of the table tends to zero. The ca nonical measure is extrema l when there is o ne zero in the table b eca use an emerging s ing le SNP gives rise to a table with one zero. On the other hand, measures whic h are extremal only for tables with a diagonal zero are p er tinent w he n measuring the degree of redundancy between single markers. W e s harply distinguish b etw een the definition o f a LD measure and its estimation. F o r D ′ the e stima- tion problem has be e n considered recently and partly b y Sebastiani & Abad-Grau (2007). Lo (1991) inv estigated jackknife and bo otstrap estimators for D ′ . The usual naiv e plug-in estimator s based on f reque nc ie s can lea d to unreliable estimates (Chen et al., 2006; Lo, 199 1; Sebastiani & Abad-Grau, 200 7). Es timation functions based on the computationally exp ensive volume mea sures (Chen et al., 2006) were pro p o sed recently as a remedy to this well-kno wn problem. Here, we inv estigated four different consisten t estimation functions for the mea s ures η , D ′ , r and Q , the naive estimator, the semi-na ive estimator, the Bay es estimator a nd the volume estimator (for η , D ′ only) and c o mpared them in an extensive simulation study ba s ed on the exp ected mean square error ( Lo, 1991). W e confirmed that v olume estimators hav e b etter exp ected mean sq uare error than the naiv e plug- in estimators. In the case of D ′ , volume estimatio n p erform w orse than the semi-naive estimator partic- ularly fo r the sampling distribution D 1 2 . The reason is that the v olume definition for D ′ is ba sed on tables with fixed mar ginals. Implicitly the marg inals are trea ted as c ertain but they a re in fact random. In cont ra st, our volume estimator for η trea ts the marg ina ls as random and its a ccuracy is reasona ble. In our study the semi-naive estimator outperfo rms the naive estimator with resp ect to accuracy and the volume and Ba yesian es tima tors with respect to computational cost. In summary we prop ose a ca no nical measure η 1 2 for analysing link age disequilibrium in the one-sa mple case. The cano nic a l measure is uniquely characterised by a s et of six bio metr ical p o stulates. It is easy to interpret a nd ca n b e eco nomically ca lculated and estimated by the semi-naive estimato r using R functions w hich we will b e glad to provide on request. References The Ha pMap pro ject http://www.hapmap.org / Chen, Y., Lin, C.H. L., Saba tti, C. (2006 ). V o lume Measures for Link age Disequilibrium. BMC Genetics 7 (5 4). Devlin, B., Risch, N. (1995 ). A Compar ison o f L ink age Disequilibrium Mea sures for Fine-Scale Mapping. Genomics 29 , 311 -322 . Diaconis, P. , Efron, B. (1985 ). T e sting for Independence in a Two-W ay T a ble : New Interpretations of the Chi-Square Statistic. The A nnals of Statistics 13 (3), 845-874. Edw ards, A.W.F. (19 63). The Me a sure of Asso c iation in a 2x2 T able . J ournal of t he R oyal Statistic al So ciety, Series A 1 26 , 10 8-11 4. Gabriel, S. B., Schaffner, S.F., Nguyen, H. , Moore, J. M., Ro y, J. , Blumenstiel, B., Higgins, J., DeFelice, M. , Lochner, A., F aggar t, M., Liu-Cordero, S.N. , R otimi, C., Adeyemo, A. , Cooper, R., W ard, R., Lander, E.S ., Dal y, M.J., Al tshuler, D. (2 002). The s tructure o f haplotype blocks in the h uman genome. Scienc e 296 (55 7 6), 2225 -222 9 . Geisser, S. (1984 ). On Prio r Distributions for B inary T ria ls. Th e Americ an Statistic an 38 (4), 244- 2 51. Har tung, J. (1991 ). S tatistik: L ehr- un d Handbuch der angewandten Statistik . Munich: R. Olden- bo urg V er lag GmbH 25 Hedrick, P.W. (1987 ). Gametic Disequilibrium Measures: Pr o ceed with Caution. Genetics 117 , 331-3 41. Hill, W.G. , R ober tso n, A . (1968). Link age Disequilibrium in Finite P opulatio ns . The or etic al and Applie d Genet ics 38 , 226-23 1. Hotelling, H. (19 39). T ub es and Spheres in n-Spaces, a nd a Cla ss of Statistical Problems. Americ an Journal of Mathema tics 61 , 440-460. Ihaka, R., Gentleman, R. (1996). R a language for data ana lysis a nd gra phics. Journal of c ompu- tational and gr ap hic al statistics 5 , 299-3 14. Jeffreys, H. (1961). The ory of Pr ob ability . London: Oxford Univ ersity Press, Inc. Koelbig, K.S. Col le cte d Algo rithms fr om CACM 327 -P 1 -0. Lew ontin, R.C. (1963 ). The Interaction o f Selection and Link age. I. Gene r al Co nsiderations; Het- erotic Mo dels. Genetics 49 , 4 9-67. Li, Y.M. , Xiang, Y ., Sun, Z .Q. (200 8). An E ntropy-Based Measure for QTL Mapping Using Ex- treme Samples of Population. Hum an Her e dity 65 , 121-128. Lo, S.K. (1991). O n the analysis a nd application of mea s ures of link age disequilibrium. Austr ali an Journal of Statistics 33 (3 ), 249-259. Maximom, L.C. (20 03). The dilog arithm function for co mplex ar gument. Pr o c e e dings of the Roy al So ciety of L ondon A 45 9 , 28 0 7-28 1 9. Mor ton, N.E. , Zhang, W., T aill on-Miller, P., Ennis, S. , Kwok, P.Y., Coll ins, A. (2001). The optimal measur e of allelic as so ciation. Pr o c e e dings of the National A c ade my of Scienc e 98 (9), 5217- 5221 . Mueller, J.C. (2004). Link age Disequilibrium for Different Scales and Applications. Briefings in Bioinfo rmatics 5 (4), 355 -364. Nigam, K. , Laffe r ty, J. , McCall um, A . (1999). Using Maximum Entrop y for T ext Classification. IJCAI-99 Workshop on Ma chine Le arning for Information Filtering , 61 -67. Pritchard, J.K. , P rzew orski, M. (200 1). Link age disequilibrium in Humans: Mo dels and Data . Americ an Journal of Human Genetics 69 , 1 -14. Schulze, T.G., Zhang, K. , Chen, Y., Akula, N. , S un, F. , McMahon, F.J. (20 04). Defining haplotype blo cks a nd tag single-nucleotide p olymorphis ms in the human genome. Human Mole cular Genetics 13 (3), 335 -342. Sebastiani, P., Abad-Grau, M.M. (20 0 7). B ayesian estimates o f link age disequilibrium. BMC Genetics 8 (3 6) doi:10 .1186 /147 1 -2156-8-36 Ser vice, S., DeYoung, J. , Kara yior gou, M., Roos, J. L., Pretorious, H. , Bedo y a , G., Ospina, J. , R uiz-Linares, A., Macedo, A., P al ha, J.A ., H eutink, P. , Aulchenko, Y., Oostra, B., v anDuijn, C., Jar velin, M.R., V arilo, T., Peddl e, L., Rahman, P. , Pi- ras, G., Monne, M., Murra y, S., Gal ver, L., Pel tonen, L., Saba tti, C., Collins, A., Freimer, N . (20 06). Magnitude and Distribution of Link age D isequilibr ium in Population Iso la tes and Implications for Genome- wide Asso cia tion Studies. Natur e genet ics 38 (5), 556 -560. Shete, S. ( 20 03). A Note on the Optimal Meas ure of Allelic associa tion. Annals of Human Genetics 67 , 18 9-191 . Teare, M. D., Dunning, A .M., Durocher, F., Rennar t, G. , Ea ston, D. F. (20 02). Sampling distribution of summa r y link age dis equilibrium measures. Annals of Hu m an Genetics 66 , 2 23-23 3. Thomas, D.C. (2004). Statistic al Metho ds in Genetic Epidemi olo gy . New Y or k , NY: Oxford Univ ers it y Press, Inc. W alley, P. (1996). Infer ence f ro m Multinomial Data: Learning About a Bag of Marbles. Journal of the R oyal S tatistic al So ciety, Series B 58 (1), 3-57 . Wea ver, W., Sh annon, C.E. (1 963). The Mathematic al The ory of Communic atio n. Urbana, IL: Univ ers it y of Illino is Press Weir, B.S . (19 9 6). Genetic Data A nalysis II. Sunder land, MA : Sinauer Asso ciates , Inc. Yule, G.U. (1900). On the Asso ciation of Attributes in Sta tistics. Phil osophic al T ra nsactions of the R oyal So ciety of L ondon, Series A 190 0 194 , 269 -274 . Zhang, K., Deng, M., Chen, T., W a terman, M.S. , Sun, F. (2002 ). A dynamic pro gramming algorithm for haplotype blo ck par titioning. Pr o c e e dings of the National A c ademy o f Scienc e 99 (11), 7335- 7339 . Zhu, S., Ji, X., X u, W., Gong, Y. (20 05). Multi-lab elled Classification Using Maximum En tropy Metho d. Pr o c e e dings of the 28th annual international ACM SIGIR c onfer en c e on R ese ar ch and Development in Informatio n R etrieval , 274- 281. Figures and T ables Figures -7 -6 -5 -4 -3 -2 -1 0 1 2 3 4 5 6 7 0.0 0.1 0.2 0.3 0.4 P S f r a g r e p la c e m e n t s D (5 , 5 , 5 , 5) D (2 , 2 , 2 , 2) D (1 , 1 , 1 , 1) D 1 2 , 1 2 , 1 2 , 1 2 D 1 5 , 1 5 , 1 5 , 1 5 D 2 , 1 , 1 2 , 1 5 ln λ f (ln λ ) Figure 1 : Density of the log o dds ratio under differen t Diric hlet distributions P S f r a g r e p la c e m e n t s Q Q η 1 η 1 η 1 2 η 1 2 Figure 2 : Relation betw een o dds ratio bas ed measur es of LD P S f r a g r e p la c e m e n t s Q η 1 η 1 2 D ′ Q η 1 η 1 2 r r r r Figure 3 : Cor relation of r with other mea sures of LD (100 ,0 00 simulations from D 1 2 ). P S f r a g r e p la c e m e n t s Q η 1 η 1 2 D ′ Q η 1 η 1 2 r Q η 1 η 1 2 D ′ D ′ D ′ Figure 4 : Cor relation of D ′ with o dds ratio based measures of LD (1 00,000 simulations from D 1 2 ). -1.0 -0.5 0.0 0.5 1.0 0 5000 10000 15000 20000 25000 -1.0 -0.5 0.0 0.5 1.0 0 5000 10000 15000 20000 25000 -1.0 -0.5 0.0 0.5 1.0 0 5000 10000 15000 20000 25000 -1.0 -0.5 0.0 0.5 1.0 0 5000 10000 15000 20000 25000 -1.0 -0.5 0.0 0.5 1.0 0 5000 10000 15000 20000 25000 -1.0 -0.5 0.0 0.5 1.0 0 5000 10000 15000 20000 25000 -1.0 -0.5 0.0 0.5 1.0 0 5000 10000 15000 20000 25000 -1.0 -0.5 0.0 0.5 1.0 0 5000 10000 15000 20000 25000 -1.0 -0.5 0.0 0.5 1.0 0 5000 10000 15000 20000 25000 -1.0 -0.5 0.0 0.5 1.0 0 5000 10000 15000 20000 25000 P S f r a g r e p la c e m e n t s Q η 1 η 1 2 D ′ Q η 1 η 1 2 r Q η 1 η 1 2 D ′ D ′ D ′ r r Q Q η 1 2 η 1 2 D ` 1 2 ´ D ` 1 2 ´ D ` 1 2 ´ D ` 1 2 ´ D ` 1 2 ´ frequency frequency frequency frequency frequency frequency frequency frequency frequency frequency D (1) D (1) D (1) D (1) D (1) η 1 η 1 Figure 5 : Distribution o f v a rious LD measures ass uming a Diric hlet distribution D 1 2 or D (1) on T . By construction, the canonical LD measures η 1 2 and η 1 are unifor mly distributed for D 1 2 and D (1) resp ectively . D ′ is un iformly distributed for D (1). Minor allelic frequency Frequency 0.0 0.1 0.2 0.3 0.4 0.5 0 20000 40000 60000 80000 100000 120000 P S f r a g r e p la c e m e n t s Q η 1 η 1 2 D ′ Q η 1 η 1 2 r Q η 1 η 1 2 D ′ Figure 6 : Distribution of minor allelic frequency in the CEU HapMap sa mple genotyped with Mapping 500k Affymetrix c hipset (Hapma p). -1.0 -0.5 0.0 0.5 1.0 0 500 1000 1500 2000 2500 3000 -1.0 -0.5 0.0 0.5 1.0 0 500 1000 1500 2000 2500 3000 P S f r a g r e p la c e m e n t s Q η 1 η 1 2 D ′ Q η 1 η 1 2 r Q η 1 η 1 2 D ′ Q η 1 2 frequency frequency Figure 7: Distribution of Q and η 1 2 for all pairs of markers of chromosome 22 of the CE U HapMa p sample. W e s e le cted pairs o f SNPs with minor allelic frequency g reater than 10 % and dis tances less than 50kb. Semi-naive estima to rs using α = 1 2 were calculated. It reveals that η 1 2 differentiates considerably b etter betw een tables than Q . T ables Minor ma r ginal frequencies Kendall’s τ 0% t o 10% 0.873 10% to 20% 0.905 20% to 30% 0.916 30% to 40% 0.930 40% to 50% 0.957 T able 1: Kendall’s corr elation co efficie nt b etw een D ′ and λ for tables with sp ecified margina l fre- quencies (bas e d o n a sample of N = 1 , 000 , 00 0 drawn from D 1 2 ). Estimator D ` 1 2 , 1 2 , 1 2 , 1 2 ´ D (1 , 1 , 1 , 1) D (2 , 2 , 2 , 2) N = 50 N = 100 N = 500 N = 50 N = 100 N = 500 N = 50 N = 100 N = 500 ˆ η N E 1 0.127 0.084 0.027 0.083 0.03 9 0.0064 0.050 0.022 0. 0040 ˆ η S N E 1 0.070 0.047 0.016 0.040 0.02 2 0.0052 0.033 0.018 0. 0038 ˆ η B E 1 0.063 0.042 0.014 0.040 0.02 2 0.0051 0.034 0.018 0. 0038 ˆ η VE 1 0.067 0.046 0.016 0.041 0.02 3 0.0052 0.037 0.019 0. 0039 ˆ η N E 1 2 0.140 0.093 0.0304 0.086 0.039 0.0056 0.038 0.0134 0.0019 ˆ η S N E 1 2 0.040 0.027 0.0095 0.022 0.012 0.0029 0.017 0.0088 0.0018 ˆ η B E 1 2 0.036 0.024 0.0085 0.025 0.014 0.0031 0.020 0.0097 0.0018 ˆ η VE 1 2 0.040 0.027 0.0094 0.029 0.015 0.0033 0.025 0.0116 0.0020 ˆ D ′ N E 0.115 0.074 0.023 0.081 0.03 9 0.0072 0.053 0.024 0.0045 ˆ D ′ S N E 1 0.080 0.053 0.017 0.048 0.02 7 0.0065 0.037 0.020 0.0043 ˆ D ′ S N E 1 2 0.067 0.045 0.015 0.050 0.02 8 0.0065 0.041 0.021 0.0044 ˆ D ′ B E 1 0.072 0.047 0.015 0.047 0.02 7 0.0064 0.037 0.020 0.0044 ˆ D ′ B E 1 2 0.064 0.042 0.014 0.051 0.02 8 0.0065 0.043 0.022 0.0044 ˆ D ′ VE 0.114 0.069 0.021 0.058 0.03 1 0.0067 0.038 0.020 0.0044 ˆ r N E 0.017 0.0087 0.0019 0.017 0.0085 0.0017 0.018 0.0090 0.0018 ˆ r S N E 1 0.015 0.0082 0.0018 0.015 0.0078 0.0017 0.016 0.0084 0.0018 ˆ r S N E 1 2 0.014 0.0078 0.0018 0.016 0.0080 0.0017 0.017 0.0086 0.0018 ˆ r B E 1 0.015 0.0082 0.0018 0.015 0.0078 0.0017 0.016 0.0084 0.0018 ˆ r B E 1 2 0.014 0.0078 0.0018 0.015 0.0079 0.0017 0.017 0.0086 0.0018 ˆ Q N E 0.135 0.090 0.029 0.095 0.04 7 0.0085 0.071 0.034 0.0065 ˆ Q S N E 1 0.087 0.059 0.020 0.059 0.03 3 0.0076 0.055 0.030 0.0064 ˆ Q S N E 1 2 0.076 0.051 0.017 0.061 0.03 4 0.0077 0.060 0.031 0.0064 ˆ Q B E 1 0.080 0.053 0.018 0.058 0.03 3 0.0076 0.055 0.030 0.0064 ˆ Q B E 1 2 0.072 0.047 0.016 0.062 0.03 4 0.0077 0.059 0.031 0.0064 T able 2: The exp ected mean squa re erro r fo r different estimators of different L D measur es based on 100,0 0 0 sim ulations of true tables drawn from the Dirichlet dis tr ibution in the columns a nd their realizations w ith sample size N . The estimator s are explained in the text. Except for the canonica l measures, we ca lculate the semi-naiv e a nd Bay esian es timators for both α = 1 2 and α = 1 as w ell.
Original Paper
Loading high-quality paper...
Comments & Academic Discussion
Loading comments...
Leave a Comment