Community Detection using a Measure of Global Influence
The growing popularity of online social networks has provided researchers with access to large amount of social network data. This, coupled with the ever increasing computation speed, storage capacity and data mining capabilities, led to the renewal …
Authors: ** - Rumi Ghosh (University of Southern California, Information Sciences Institute) - Kristina Lerman (University of Southern California, Information Sciences Institute) **
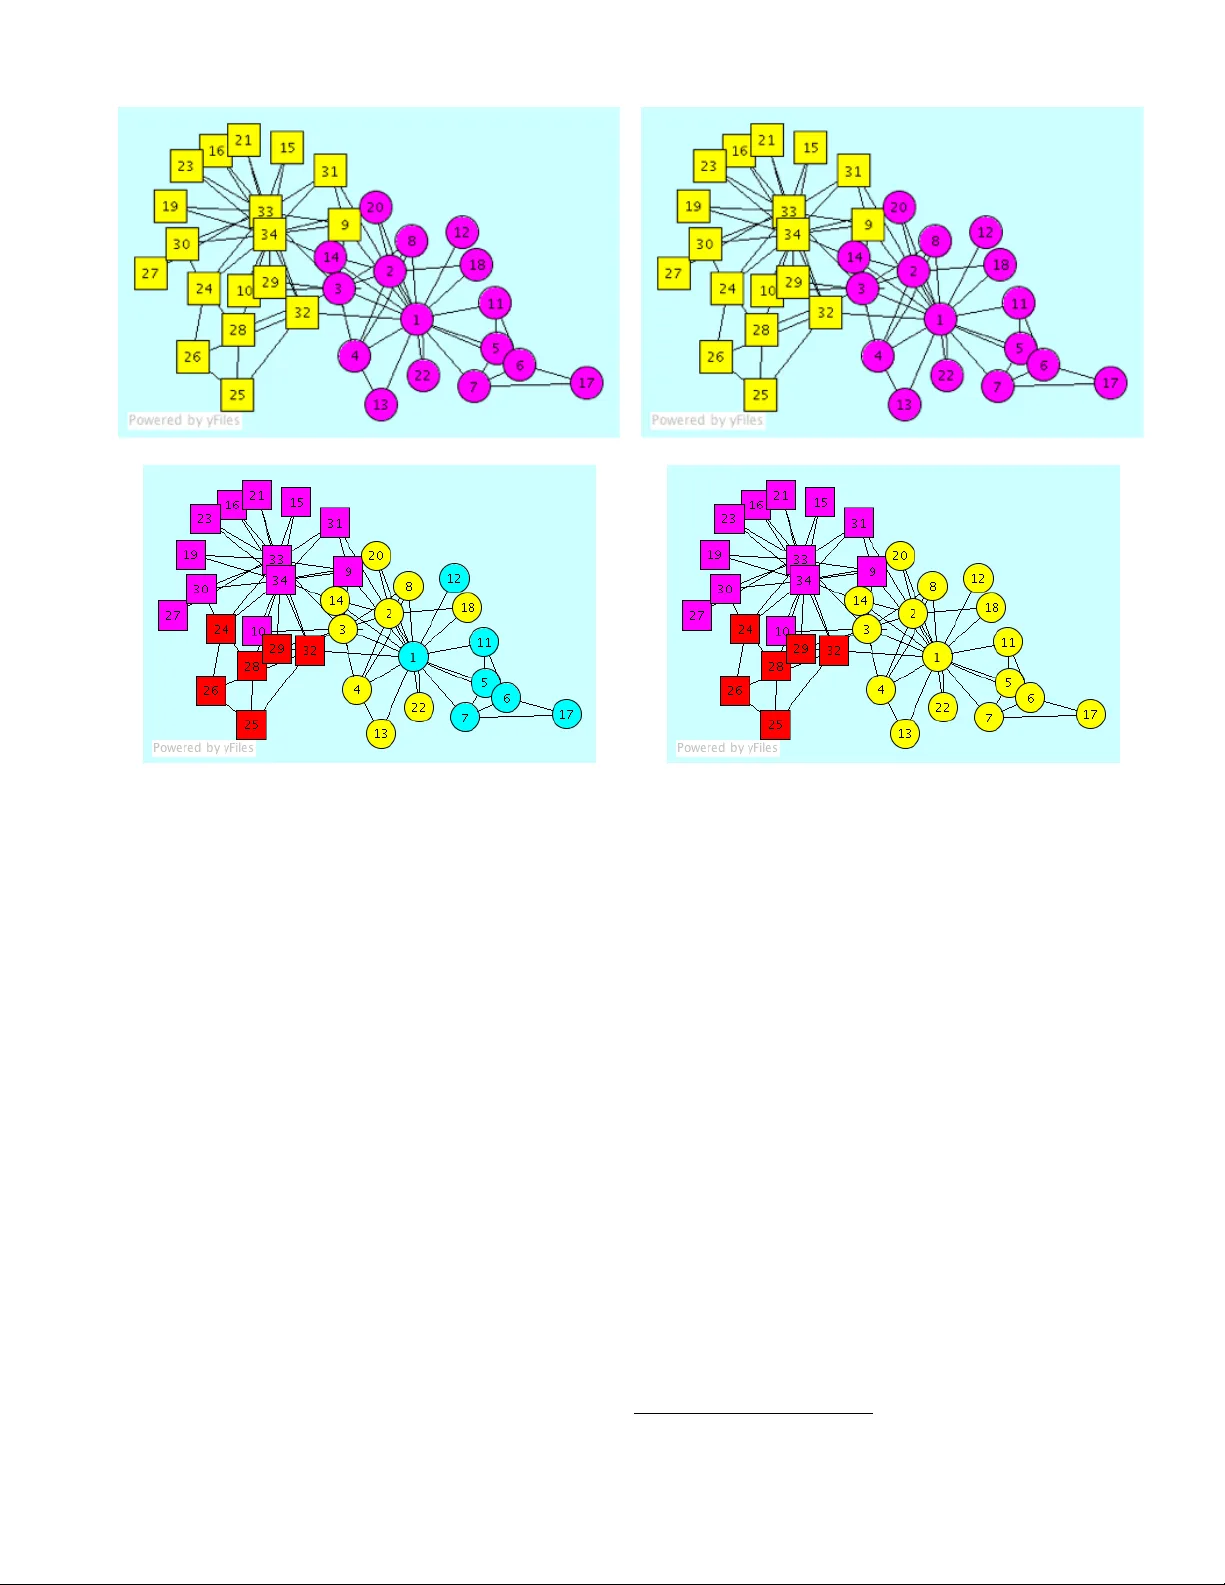
Comm unity Detection using a Measure of Global Influence Rumi Ghosh University of Souther n California Inf or mation Sciences Institute 4676 Admiralty W ay Marina del Rey , California 90292 rumig@usc.edu Kristina Ler man University of Souther n California Inf or mation Sciences Institute 4676 Admiralty W ay Marina del Rey , California 90292 ler man@isi.edu ABSTRA CT The gro wing p opularit y of online so cial net works has pro- vided researchers with access to large amount of social net- w ork data. This, coupled with the ev er increasing com- putation speed, storage capacit y and data mining capabil- ities, led to the renewal of interest in automatic commu- nit y detection metho ds. Surprisingly , there is no univer- sally accepted definition of the comm unity . One frequently used definition states that “communities, that hav e more and/or b etter-connected ‘internal edges’ connecting mem- b ers of the set than ‘cut edges’ connecting the set to the rest of the w orld” [10]. This definition inspired the mo dularit y- maximization class of communit y detection algorithms, which lo ok for regions of the net work that hav e higher than ex- p ected densit y of edges within them. W e introduce an alter- nativ e definition whic h states that a communit y is comp osed of individuals who hav e more influence on others within the comm unity than on those outside of it. W e present a math- ematical form ulation of influence, define an influence-based mo dularit y metric, and sho w ho w to use it to partition the net work into comm unities. W e ev aluated our approach on the standard data sets used in literature, and found that it often outp erforms the edge-based mo dularit y algorithm. K eywords comm unity structure, automatic detection, so cial netw orks, global influence, modularity , eigen vectors 1. INTR ODUCTION Comm unities and so cial netw orks hav e been a source of in terest for researchers for sev eral decades [3, 7]. How ever, one of the main problems faced by the early researc hers was the difficulty of collecting acquaintanceship and related em- pirical data from human sub jects [3]. The adven t of the in ternet and the growing p opularit y of online so cial net- w orks c hanged that, pro viding the researc hers access to huge amoun t of in v aluable h uman so cial net work data. This, cou- pled with the ever increasing computation speed, storage ca- Permission to make digital or hard copies of all or part of this work for personal or classroom use is granted without fee provided that copies are not made or distributed for profit or commercial advantage and that copies bear this notice and the full citation on the first page. T o copy otherwise, to republish, to post on serv ers or to redistrib ute to lists, requires prior specific permission and/or a fee. The 2nd SNA-KDD W orkshop ’08 ( SNA-KDD’08) August 24, 2008 , Las V egas, Nevada,USA.) Copyright 2008 A CM 978-1-59593-848-0 ... $ 5.00. pacit y and data mining capabilities, led to the reemergence of interest in the so cial netw orks in general, and communit y detection metho ds sp ecifically . Despite a long history of in vestigation, surprisingly , there is not a single universally accepted definition of the commu- nit y . A definition preferred by so ciologists is that a commu- nit y is comp osed of individuals who are similar to one an- other in some wa y , whether it is b ecause they see the same friends or belong to the same organizations. This definition inspired the class of communit y-finding metho ds based on hierarc hical clustering. These algorithms assign nodes to the same communit y if they are sufficiently similar to eac h other. Similarit y measures include structural equiv alence, where tw o no des are said to b e equiv alent if they hav e the same set of neigh b ors, and approximate equiv alence that uses Euclidean distance and Pearson correlation. Another similarit y measure used in hierarc hical clustering metho ds is the n umber of paths b et ween nodes. Hierarchical clustering, ho wev er, may not assign ev ery no de to a non-trivial comm u- nit y . In addition, it do es not provide a measure of ho w goo d a particular division of the netw ork in to comm unities is. Ph ysicists and computer scientists prefer to define com- m unity as “a group of vertices in which there are more edges b et w een vertices within the group than to vertices outside of it” [2]. This definition help ed inform a v ariety of graph-based approaches to automatic communit y detection, including graph partitioning and mo dularit y optimization tec hniques. Graph partitioning algorithms [5, 17] attempt to minimize the n umber of edges running b et ween comm u- nities. One of the main disadv antages of these metho ds is that either the num b er of communities has to b e sp eci- fied a priori , or they rep eatedly bisect the graph without a w ell-defined stopping p oin t. Since it is almost imp ossi- ble to alw ays kno w beforehand the num b er of comm unities within a large netw ork, these metho ds are unable to auto- matically detect natural communities. F urthermore there is no guarantee that the communities in to whic h w e ha ve divided the netw ork represen t the b est possible comm unity division of the netw ork. Newman and his colleagues real- ized that rather than minimize the num b er of edges running b et ween groups, one should instead lo ok for groups that ha ve higher than exp ected num b er of edges within them and low er than exp ected edges b et w een them [12, 11, 14, 13]. These algorithms maximize a measure called mo dular- ity , which is the fraction of all edges within communities min us the exp ected v alue of the same quantit y . The modu- larit y optimization metho d is fast (if approximate), and can b e applied to b oth undirected and directed graphs. It is able to find the “b est” assignment of no des to communities, although each no de can belong to only a single comm unity . Some researchers hav e recen tly questioned the applicabil- it y to real-world netw orks of the edge-density definition of the communit y and the mo dularit y optimization techniques based on it. Lesko vec et al. [10] found that in large net works, comm unities tend to ‘blend’ into the giant connected com- p onen t, making it imp ossible to extract any but the trivial small and tigh tly knit communities. W e stak e a claim in this active field by in tro ducing an alternativ e definition of communit y that is based on in- formation spread on netw orks. W e claim (without muc h theoretical or empirical support) that a comm unity is com- p osed of individuals who hav e more influence on individuals within the communit y than on those outside of it. W e tak e a structure-based view of influence, defining it as the n um- b er of paths, of any length, that exist b et ween tw o no des. The more paths there are, the more opportunities one no de has to affect the other. This will result in the actions of the communit y members becoming correlated with time, whether through adopting a new fashion trend or vocab- ulary terms, watc hing a movie, or buying a pro duct. W e define influence-based modularity metric, and sho w ho w to use it to partition a net work in to comm unities. W e ev aluated our approach on the standard data sets used in literature, and found that it giv es at least as go od performance as the standard mo dularit y-based algorithm. The paper is organized as follo ws. In Section 2 we define and give a mathematical deriv ation of influence. Section 3 describ es ou r re-definition of the mo dularit y metric in terms of influence, and sho ws ho w the new modularity can be used for automatic communit y detection. W e present results of applying our approac h to w ell-studied net works in Section 4. In Section 5 we compare our approach to those that hav e previously b een describ ed in literature, and conclude with Section 6. 2. A MEASURE OF GLOB AL INFLUENCE A netw ork of N no des and E links can b e represented using a graph G ( N , E ), where N is the num b er of vertices of the graph representing the nodes of the netw ork, and E is the num b er of edges of the graph. Edges are directed; ho wev er, if there exists a an edge from vertex i to j and also from j to i , it is represen ted as an undirected edge. A path p is an n hop p ath from vertex i to j , if there are n v ertices b et w een the vertex i and vertex j along the path. W e allow the paths to be non-selfav oiding, meaning that the same pair of vertices could b e trav ersed more than once on the path. The graph G ( N , E ) can be represented b y an adjacency matrix A whose elemen ts A ij are defined as A ij = 1 if ∃ an edge from v ertex i to j ; 0 otherwise . W e introduce an index for measuring the degree of in- fluenc e a no de has on other no des. W e use this index to divide the netw ork in to communities so that no des which ha ve higher influence on each other are group ed together. A t the same time this index could also b e used to find out the status of the p eople in the communit y based on their influence [7]. Influence can be defined as the capacity to ha ve an effect on someone. P o ol and Ko c hen [3] state that “influence in large part is the ability to reach a crucial man through the Figure 1: Connectivit y:Edge Connectivity and Path Connectivit y righ t channels, and the more the channels in reserve the b etter.” This is the measure of global influence that we emplo y , and w e also adopt the concept of attenuation when transmitted through intermediaries [7]. Therefore, influence dep ends not only on direct contact betw een p eople, but also on the num b er of w ays an individual can reach another, or the n umber of n hop paths b et ween them. Hence, the influence of node a on b is likely to b e more if there are more paths from a to b . The strength of the effect via longer paths with more in- termediaries is lik ely to b e low er than via shorter c hains with few er intermediaries. W e mo del the atten uation of influence o ver longer c hains through tw o parameters α and β . W e use t wo parameters, rather than a single parameter, to mo del the fact that a no de may hav e more influence ov er its direct neigh b ors, than it will hav e ov er the neighbor’s neighbors, and so on. Thus, β (0 ≤ β ≤ 1) is the dire ct attenuation factor , the probabilit y that the effect will b e transmitted to the immediate neighbors of the no de. α (0 ≤ α ≤ 1) is the indir e ct attenuation factor , the probabilit y that the effect will be transmitted through links other than those to the no de’s immediate neighbors (i.e., via friends of friends). Let us consider transmitting an effect or a message from no de b to node c in a netw ork in Figure 1. The probabilit y of transmission to the immediate neighbors of b is β . The probabilit y of transmission o ver the fiv e 1-hop paths is β α . In general, the probability of a transmission along an n -hop path is β α n − 1 . Note that β = α is a special case when the transmission probability along all links is the same. The total influence of no de b on no de c is th us dep en- den t on the n umber of (attenuated) c hannels b et ween b and c , or the sum of all the weigh ted paths from no de b to c . This definition of influence mak es in tuitive sense, b ecause the greater the n umber of paths b et ween b and c , the more opp ortunities there are for b to transmit messages to c and to affect what c is doing. W e represent total num ber of links from no de i to no de j as i 0 / / j , which is given by the elements A ij of the adjacency matrix A . Next, we represent the total n umber of 1-hop paths from node i to node j as i 1 / / j , and it is given by P N k =1 A ik A kj , since a path can exist from i to j in one hop via a particular no de k iff ∃ an edge from i to k and also from k to j . Summing ov er all k ∈ N , we get the ab o ve result. W e define matrix A 1 = A · A whose elements, A 1 ij = P N k =1 A ik A kj , giv e the the total n umber 1-hop paths from i to j . Similarly the total num b er of 2-hop paths from node i to no de j is represe nted as i 2 / / j and is giv en b y N X l =1 ( N X k =1 A ik A kl ) A lj . W e define matrix A 2 = A · A · A whose elements A 2 ij = P N l =1 ( P N k =1 A ik · A kl ) · A lj giv e the the total num ber 2-hop paths from i to j . Generalizing the total num b er of chains from no de i to no de j with n in termediaries j is represented as i n / / j and is by the matrix A n where A n = n + 1 times z }| { A · A · · · A = A ( n − 1 ) · A (1) Adding weigh ts to take in to account the attenuation of effect of no de i on no de j , we get total influence of no de i on j as i / / j = β i 0 / / j + β α i 1 / / j + · · · + β α n i n / / j · · · W e represent the measure of influence of no des on other no des b y the influenc e matrix P where P = β A + β α A 1 + · · · + β α n A n + · · · . (2) After elemen tary manipulations, this series can b e rewritten as P = β A ( I − α A ) − 1 (3) where I is the identit y matrix. This equation holds while α is less than the reciprocal of largest c haracteristic root of adjacency matrix A [4]. The influence matrix captures the effective connectedness of a no de not only in terms of the n umber of no des it is di- rectly connected to, but also in terms the n umber of nodes it is indirectly connected to. This formulation is mathemat- ically similar to the weigh ts b et ween vertices used in the hi- erarc hical clustering algorithm of Girv an and Newman [6], where the w eights dep ended on the total num b er of paths b et ween no des. Rather than using influence to measure sim- ilarit y b et ween no des, as done in that work, we will use it to find groups of nodes that exert higher than expected in- fluence on eac h other. 3. COMMUNITIES AND INFLUENCE The ob jectiv e of the algorithms proposed b y Newman and coauthors was to disco ver “communit y structure in net w orks — natural divisions of net w ork no des in to densely c onne cted subgroups” [15]. They proposed mo dularity as a measure for ev aluating the strength of the disco vered communit y struc- ture. Algorithmically , their approac h to disco v ering net w ork structure is based on finding groups with higher than ex- p ected edges within them and low er than exp ected edges b et ween them [12, 11, 14, 13]. The mo dularit y Q , which is optimized by the algorithm is giv en b y: Q =(fraction of edges within comm unity)-(expected fraction of such edges). Th us, they use Q as a n umerical index to ev aluate a partic- ular division of the net work. The underlying idea, therefore, is that connectivity of no des b elonging to the same commu- nit y is greater than that of nodes belonging to differen t com- m unities, and they tak e the num b er of edges as the measure of connectivit y . But is edge connectivity the true measure of connectivity on the netw ork? Consider again the graph in Figure 1, where there exists an edge b et ween a and c but not b et ween b and c . How ev er, clearly c is not unconnected from b , as there exist several dis- tinct channels for b to send information to, or influence, c . The influence matrix that we defined ab o ve, gives a math- ematical mo del of the global connectivity of the netw ork. W e will use this connectivit y to identify comm unities in the net work. 3.1 Influence-based Modularity W e redefine modularity Q that as Q =(connectivity within the communit y) - ( exp ected con- nectivit y within the comm unity) and adopt the influence matrix P as the measure of con- nectivit y . This definition of mo dularit y implies that in the b est division of the netw ork, the influence of no des within their communit y is more than their influence outside their comm unity . A division of the netw ork into comm unities, therefore, maximizes the difference b et w een the actual in- fluence and the exp ected influence within the communit y , giv en by the influence in an equiv alent random graph. Let us denote the exp ected influence b y a N × N matrix ¯ P . Mo dularit y Q then can b e expressed as Q = X ij [ P ij − ¯ P ij ] δ ( s i , s j ) (4) where s i is the index of the communit y i b elongs to and δ ( s i , s j ) = 1 s i = s j ; 0 otherwise . When all the vertices are placed in a single group, then it is axiomatically assumed that Q = 0. Thus w e hav e P ij [ P ij − ¯ P ij ] = 0. Hence, the total influence W is W = X ij ¯ P ij = X ij P ij (5) Hence the null mo del against whic h w e compare our net work has the same num b er of vertices N as the original mo del, and in it the exp ected influence of the entire net work equals to the actual influence of the original netw ork. W e further restrict the choice of n ull mo del to that where the expected influence W in j on a giv en v ertex j from all other v ertices is equal to the actual influence on the corresponding v ertex in the real netw ork. W in j = X i ¯ P ij = X i P ij (6) Similarly , we also assume that in the n ull mo del, the ex- p ected influence W out i of a given vertex i on all other ver- tices is equal to the actual influence of the corresp onding v ertex in the real netw ork W out i = X j ¯ P ij = X j P ij (7) The null model of this class that we then consider has paths that are placed at random b et ween vertices sub ject to the constrain ts of Equation(6) and Equation (7). This implies then that the expected influence ¯ P ij of v ertex i on v ertex j can b e written as ¯ P ij = f 1 ( W out i ) f 2 ( W in j ) , (8) where f 1 and f 2 are some functions. W e rewrite Equation(7) as W out i = X j f 1 ( W out i ) f 2 ( W in j ) = f 1 ( W out i ) X j f 2 ( W in j ) (9) for all i , and hence f 1 ( W out i ) = C 1 W out i (10) for some constan t C 1 . Along the same lines w e ha ve W in j = X i f 1 ( W out i ) f 2 ( W in j ) = f 2 ( W in j ) X i f 1 ( W out i ) (11) for all j , and hence f 2 ( W in j ) = C 2 W in j (12) for some constan t C 2 . Therefore, exp ected influence is X ij ¯ P ij = X ij ( C 1 C 2 W out i W in j ) = C 1 C 2 X ij ( W out i W in j ) = C 1 C 2 ( X ij P ij ) 2 = C 1 C 2 W 2 No w using Equation(5) w e ha ve W = X ij P ij = X ij ¯ P ij = C 1 C 2 W 2 , (13) whic h w e can solv e for C 1 C 2 . Using Equations 8–12 we can write exp ected influence as ¯ P ij = W out i W in j W , (14) and the influence-based mo dularit y as Q = X ij ˆ P ij − W out i W in j W ˜ δ ( s i , s j ) (15) 3.2 Detecting Community Structure Once we ha ve deriv ed Q , we ha v e to select an algorithm to divide the netw ork into communities that optimize Q . Lik e others [13, 14, 9], we use the matrix-based approach analogous to sp ectral partitioning. The p ossible approaches that could b e then used for communit y detection include leading eigen vector metho d, v ector partitioning metho d and so on. W e implemen ted the leading eigen vector method [13]. W e summarize the approach in the App endix. 4. EV ALU A TION ON REAL NETWORKS W e ev aluated our approach b y using it to find communi- ties on real netw orks that can be found in literature. 4.1 Zachary’ s Karate Club W e applied this metho d on the friendship netw ork of Zachary’s k arate club [19]. In this study , Zachary studied the friend- ship net work of a k arate club for tw o y ears. During the course of the study , a disagreement developed b et w een the administrator of the club and the club’s instructor, resulting in the division of the club in to tw o factions, represen ted b y circles and squares in Figure 2. The natural communities ex- isting in the club has b een predicted b y v arious communit y detection and graph partitioning algorithms. W e used the friendship netw ork of Zachary’s k arate club [19] to compare the p erformance of the algorithm prop osed in this pap er to Newman’s communit y-finding algorithms. Figure 2 presents results of different communit y-finding approac hes. Figure 2(a) shows results of the mo dularit y maximization-based approach prop osed by Newman [11] when the netw ork is bisected into tw o communities only . Fig- ure 2(b) shows results of a similar bisection done by our algorithm with β = 1 / N and α = 1 / N , where N = 34 is the n umber of no des. Both metho ds result in the correct as- signmen t of individuals to communities and are better than those pro duced b y the sp ectral bisection algorithm and hi- erarc hical clustering, whic h do es not assign all no des to the principal communities [13]. How ever, finding natural com- m unities in the k arate club netw ork by iterating eac h algo- rithm until a stopping condition is reac hed, leads to differ- en t results. Newman’s metho d divides the net work in to four comm unities (Figure 2(c)), while our metho d divides it in to three comm unities (Figure 2(d)). Two of the communities generated b y Newman’s algorithm (sho wn in pink and red in Figure 2(c)) are similar to the tw o of the three communities found b y our algorithm. How ever, it further sub divides the circle no des into putting no de 1 into the same communit y as five of its immediate contacts, but a different comm unity than nine of its immediate contacts. Our algorithm app ears to give a more realistic division of the k arate club netw ork in to natural communities. 4.2 College F ootball W e also ran our approach on the US College fo otball data from Girv an et al. [6] 1 The netw ork represents the sched- ule of Division 1 games for the 2000 season where the ver- tices represen t teams (colleges) and the edges represent the regular season game b et ween the tw o teams they connect. The teams are divided into “conferences” containing 8 to 12 teams eac h. Games are more frequent b et ween members of the same conference than members of different confer- ences leading to a comm unit y structure with greater connec- tivit y within the comm unities (represented b y conferences) than b et ween them. Inter-conference games how ever are not uniformly distributed, with teams that are geographi- cally closer likely to pla y more games with one another than teams separated by geographic distances. Ho wev er the as the authors state [6] there are some conferences like Sun b elt ha ving teams playing nearly as many games against teams in other conferences (W estern Athletic in case of Sunbelt) as they did against teams within their own conference. This leads to the intuition, that the conferences then ma y not b e the natural comm unities present in given data, but the nat- ural communities may actually b e bigger than the the size 1 The college fo otball data is a v ailable at http://www-personal.umich.edu/ ∼ mejn/netdata/ . (a) (b) (c) (d) Figure 2: Results of applying differen t comm unit y finding algorithms to Zachary’s k arate club net work. The n umbered v ertices represen t the members of the club and edges represen t friendships. The factions in which the clubs split up during the course of study are shown by squares and circles. (a & b) Communities found after running a single iteration (graph bisection) using (a) Newman’s and (b) the prop osed algorithms. (c & d) Natural comm unities found by running (c) Newman’s algorithm and (d) the prop osed algorith until termination condition is reached. of the conferences, with conferences pla ying as many games within them as b et ween them b eing clubbed into the same comm unity . Ho w then can ev aluate the purity of the natural comm unities detected? W e define purity as the total pair-wise similarity b et w een teams that actually b elong to the same conference. Th us, the similarity b et ween tw o teams in a predicted comm unity is 1 if they b elong to the same actual conference, and it is 0 it the t wo teams b elong to differen t conferences. The max- im um total similarity would then b e obtained if all teams b elonging to same conferences end up in the same commu- nit y . The purity of a prediction is then ev aluated by the total similarit y when teams are group ed in accordance to the com- m unities predicted by the algorithm divided the maximum total similarity . W e v ary β (keeping α constant) and see its change in purity of the predicted communities Figure 3. The graph (Figure 3(a)) that for a given v alue of α , purit y is constant irrespective of the v alue of β , and hence purity is dep enden t primarily on the v alue of α . W e next v ary α k eeping β constan t ( β = 1) and compute the corresponding c hange in purity . Figure 3(b) sho ws that comm unit y purity increases with the increase of α , reac hing to almost 90% near α = 0 . 1 (the upp er b ound to α is determined by the recipro- cal of the largest eigenv alue of the adjacency matrix). This sho ws that as we increase the atten uated effect of links not directly connected to the no des, the groups b ecome purer and it is indep enden t of the attenuated effect of the direct links. When α = 0 and β = 1, we get influence dep enden t only on direct contacts. Hence mo dularit y in this case re- duced to one studied b y Newman [13], and gives around 72% purit y on the football data. The num b er of groups predicted c hanges from 8 at α = 0 to four when α nears 0.1. 4.3 Political Books Next we ev aluated the approach on the p olitical b ooks data compiled by V. Krebs. 2 In this netw ork the no des rep- resen t b ooks ab out US p olitics sold b y the online b ookseller Amazon. Edges represent frequent co-purchasing of b ooks b y the same buyers, as indicated by the “customers who b ough t this b ook also b ough t these other b ooks” feature on Amazon. The no des where given lab els lib er al , neutr al , or c onservative by Mark Newman on a reading of the de- 2 http://www.orgnet.com/ (a) (b) Figure 3: The graph showing the purity of commu- nities predicted with different v alues of α and β . (a) Case when β is v aried while keeping α constan t. W e see that purity is dep enden t primarily on the v alue of α . (b) Case when α is v aried and β = 1 . W e see that as α increases the purity increases reach- ing to almost 90% near α = 0 . 1 . This sho ws that as w e increase the atten uated effect of links that are not directly connected to the no des, the groups b e- come purer. When α = 0 , the metho d reduces to eigen vector based modularity maximization metho d p ostulated b y Newman [13]. Figure 4: The graph shows the purit y of the com- m unities predicted as α is v aried ( β is kept constan t at 1) from α = 0 to α = 0 . 08 (the recipro cal of the largest eigenv alue b eing taken as the upp er b ound for the v alue of α .) scriptions and reviews of the b ooks p osted on Amazon. 3 . 49 of the b o oks were marked as c onservative , 43 b ooks were mark ed as lib er al and 13 b o oks were marked as neutr al . W e use our algorithm to find the existing comm unity structure in the net work by v arying the parameter α , as shown in Fig- ure 4. W e see that as the v alue of α increases, the n umber of comm unities formed decreases (changing from four at α = 0 to t wo at α = 0 . 08 and keeping β constan t). Again the re- cipro cal of the largest eigenv alue b eing tak en as the upp er b ound for the v alue of α . Also the purity of the comm unities detected increases from 60% at α = 0 to as high as 92% at α = 0 . 08. Again note that at α = 0 the metho d reduces to Newman’s mo dularit y maximization metho d. Another in teresting observ ation is that when α was taken as 0 . 08, leading to the formation of tw o groups, six of the neutr al b ooks were in one group whic h consisted en tirely of c onser- vative bo oks (52 b ooks of which 46 were those labeled as c onservative and six as neutr al ) and seven we re in the other group (consisting of 53 b ooks of which 43 w ere lab eled lib- er al , sev en w ere neutr al and three w ere c onservative ). This indicates the p ossibilit y that of the 13 b ooks lab eled as neu- tr al six were conserv ativ ely inclined and sev en were liberally inclined. 5. RELA TED RESEARCH Our w ork is a generalization of the eigenv ector based mod- ularit y maximization metho d proposed by Newman [13]. T aking β = 1 and α = 0 reduces the influence matrix to the adjacency matrix, and the mo dularit y that our algorithm maximizes effectively reduces to the mo dularit y defined by Newman [13]. The Random W alk mo dels [18] and the PageRank algo- rithm [16] hav e b een some of the more p opular wa ys of ana- lyzing the relev ance of no des in a netw ork, and may be used for communit y finding. One wa y to lo ok at Random W alk mo dels in graph G ( N, E ) is to start from a v ertex u and take random steps along the edges of the graph. The probability of mov ement from v ertex u to v is giv en b y T ( u, v ) = 1 d u if ∃ an edge from vertex u to v in G ; 0 otherwise . 3 This data is a v ailable at http://www-personal.umich.edu/ ∼ mejn/netdata/ where d u is the degree of vertex u . This defines a walk using transition probability matrix T . The second wa y to lo ok at random w alks is to lo ok at probabilit y distribution π t of vertices reached after t steps on trav ersing the graph G . This can b e viewed as a probability of b eing at a v ertex v ∈ N after time t . Let us assume w e start from v ertex v 0 , hence the initial probabilit y distribution of the vertex w e are at is π 0 ( v ) = 1 if v = v 0 ; 0 otherwise . The probability distribution of the vertex that we are at after time t is given b y the probability distribution π t and hence π t ( v ) = X u ∈ N π t − 1 ( u ) T ( u, v ) (16) This can be represen ted using π t = π t − 1 T ; therefore, π t = π 0 T t . (17) Ho wev er, for this tool to b e useful sev eral factors hav e to b e tak en under consideration, including the conv ergence of the sequence, the stationarity and stabilit y of the distribu- tion, its uniqueness, and so on. If there exists a unique, stable, stationary distribution π , then this would lead us to π = π T (18) Computing the eigen vector of the matrix T with eigen v alue 1 gives us the v alue of π which is how Naive PageRank algorithm ev aluates the relev ance of the no des of the net- w ork. Along with the prop ert y of the existence of a unique, stationary , stable distribution, Random W alk with Restart considers an additiona l probability that we can return bac k to our initial state and asso ciates some probability with it. If w e tak e β as the probability to mo ve at random, and 1 − β as the probability of jumping back to its initial state, the Random W alk with restart can b e formulated as: π i = β T π i + (1 − β ) e i , (19) where e i = [ e ij ] and e ij = 1 if j = i ; 0 otherwise . Hence vector π i = [ π ij ] gives the relev ance score of all nodes j ∈ N with resp ect to node i . Similarly , along with the prop- ert y of the distribution b eing stationary , PageRank with restarts considers at each time step t , probability β to mov e at random, probability of 1 − β to jump to some sp ecific state, uniformly at random. Hence the transition matrix in this case is mo dified to T 0 where each element T 0 ij is given b y T 0 ij = β T ij + (1 − β ) / N (20) and then as in Equation 18 pagerank π w ould then be given b y principal eigenv ector of this matrix and hence π would similarly b e π = π T 0 (21) In effect existence of a unique, stable stationary distri- bution is the fundamental concept b ehind most v ariations of random walk mo dels and page rank algorithms [18, 16]. Though widely used esp ecially in the determination of rel- ev ance scores, they do hav e certain limitations. The non- symmetric nature of a directed graph can lead to problems in the determination of the unique stable stationary distri- bution. W e hav e T = D − 1 A where D is the diagonal matrix of outdegrees. When G is undirected, the adjacency ma- trix A is symmetric, so the corresp onding Laplacian is also symmetric, guaranteeing fav orable prop erties of the sp ec- trum like the orthonormal basis of real eigenv ectors. W e can symmetrize T by considering a spectrum of T + T T or T · T T (where T T is the transp ose of matrix T ), but the problem then lies in the graphical interpretation eigen v alues without whic h these approaches are not really useful. In real life, and in so cial netw orks, there do exist directed graphs and as illustrated ab o ve it is difficult to apply the random w alk and page rank mo dels on them. If we think of vertices of the random w alk graph as states of a Marko v c hain, then the prop ert y that gov erns the lim- iting b eha vior of π 0 T t is ergo cit y and we say that the cor- resp onding Marko v c hain is ergodic if there exists a unique stationary distribution π to whic h π 0 T t con verges. The nec- essary and sufficient conditions of ergo dicit y of a Marko v c hain are irreducibilit y and ap eriodicity . The Random W alk mo dels can b e used as a measure of mutual relev ance and P ageRank for relev ance scores of individuals. How ever when w e consider graphs in real life, esp ecially so cial netw orks, these conditions are not necessarily satisfied (e.g., isolated comm unities). These algorithms are basically concerned with the flow of information on a netw ork. So, if we start from a no de with, sa y a unit of information, which it spreads via the c hannels it has (outgoing links), the Random W alk mo del describ es the spread of this information in the netw ork when the in- formation flow attains equilibrium, and further exc hange of information among the no des do es not c hange the distribu- tion of information. When we are thinking of the division of no des in to comm unities, we are not in terested in the amoun t of information they finally hav e from each other, but in how this information reac hes them, i.e., the channels of the flow of information. The more the c hannels for information flow a node has, the greater the tendency for the information it sends to reach its recipients. In other words, Random W alk mo dels and PageRank algorithms are concerned with the equilibrium distribution of the flow of information, and we, on the other hand, are interested in the channels of infor- mation flow and their capacity to spread the information. Mathematically the difference b et ween the tw o approaches can b e stated as follows. Equation(17) gives us π t = π 0 T t . Let π 0 ( v i ) be the vector represen ting the initial probability distribution of b eing there at a particular vertex when we initially start the random w alk from v ertex i . Obviously in this case we know that we are at i and hence the v alue of π 0 ( v i ) is given b y the unit vector e i (defined ab o ve). Hence, [ π 0 ( v 1 ) , π 0 ( v 2 ) , · · · , π 0 ( v N )] = [ e 1 , e 2 , · · · , e N ] = I , where I is the iden tity matrix. Hence, if we take P 0 t = [ π t ( v 1 ) , π t ( v 2 ) , · · · , π t ( v N )], where π t ( v i ) b e the vec- tor representing the probabilit y distribution of reac hing the v ertices in t steps, when w e initially start the random walk from vertex i w e ha ve P 0 t = I T t (22) = ( D − 1 A ) t (23) The relev ance matrix P 0 giv en by the basic Random W alk mo del then is Equation(22) at time t n suc h that P 0 = P t n 0 = P t n − 1 0 D − 1 A (24) On the other hand, we compute the influence matrix P as w e ha ve shown ab o ve is giv en b y P = β A ( I − αA ) − 1 . W e can compute the influence score of the nodes relativ e the netw ork using the influence matrix as done by Katz [7]. T aking p ij as the influence scores of the nodes with resp ect to each other, i.e., P ij = p ij , we hav e p i = P j p ij . Hence, the column vector p whose elements are p i giv es the influence score of the no des relative to the netw ork. Recen tly researchers hav e applied probabilistic mo dels, suc h as mixture mo dels, to the comm unity discov ery task. The adv antage of these models is that can probabilistically assign a no de to more than one communit y , b ecause, as it has been observed “ob jects can exhibit sev eral distinct iden- tities in their relational patterns” [1, 8]. This indeed maybe true, but whether the nodes in the net work is to b e divided in to distinct communities or probabilities with which each no de b elongs to comm unity is to b e discov ered, really de- p ends on the specific application. 6. CONCLUSION AND FUTURE WORK W e hav e prop osed a new definition of a communit y in terms of the influence that no des hav e on eac h other. W e ga ve a mathematical formulation of influence in terms of the num b er of paths of any length that link tw o nodes, and redefined mo dularit y in terms of the influence metric. W e use the new definition of modularity to partition a net work in to communities. W e applied this framework to netw orks w ell-studied in literature and found that it pro duces results at least as go od as the edge-based mo dularit y approac h. Although the formulation developed in this pap er applies equally well to directed graphs, we ha v e only implemented the algorithm on undirected ones. Hence future work in- cludes implementation of the of the algorithm on directed graphs that are common on so cial netw orking sites, as w ell applying it to bigger net works. Lesk ov ec et al. [10] state that they “observ e tigh t but al- most trivial comm unities at very small scales, the b est p os- sible comm unities gradually ‘blend in’ with rest of the net- w ork and thus b ecome less ‘comm unity-lik e’.” How ever the h yp othesis that they employ to detect communities is that comm unities hav e “more and/or b etter-connected ‘internal edges’ connecting mem b ers of the set than ‘cut edges’ con- necting to the rest of the world.” Hence, like most graph partitioning and mo dularit y based approaches to commu- nit y detection, their pro cess dep ends on the lo cal property of connectivity of no des to neighbors via edges and is not dep enden t on the structure of the netw ork on the whole. Besides, it also do es not take into accoun t the heterogeneity of no de types, that is ‘who’ are the no des that a no de is connected to and how influential these no des are. There- fore, we argue that a global prop ert y , such as the measure of influence, is a b etter approach to communit y detection. It remains to b e seen whether communities will similarly ‘blend in’ with the larger netw ork if one uses the influence metric to discriminate them. Acknowledgements This research is based on w ork supp orted in part b y the Na- tional Science F oundation under Award Nos. I IS-0535182, BCS-0527725 and IIS-0413321. 7. REFERENCES [1] E. Airoldi, D. Blei, E. Xing, and S. Fienberg. A latent mixed membership model for relational data. In LinkKDD ’05: Pr o c e edings of the 3r d international workshop on Link disc overy , pages 82–89, New Y ork, NY, USA, 2005. ACM. [2] A. Clauset. Finding local comm unity structure in net works. Physic al R eview E (Statistic al, Nonline ar, and Soft Matter Physics) , 72(2), 2005. [3] I. de Sola P o ol and M. Ko c hen. Con tacts and influence. Social Networks , 1(1):39–40, 1978–1979. [4] W. L. F errar. Finite Matric es . Oxford Univ. Press, 1951. [5] M. Fiedler. Algebraic connectivit y of graphs. Cze ch. Math. J. , 23:298–305, 1973. [6] M. Girv an and M. E. J. Newman. Comm unity structure in social and biological net works. PROC.NA TL.ACAD.SCI.USA , 99:7821, 2002. [7] L. Katz. A new status index derived from sociometric analysis. Psychometrika , 18:39–40, 1953. [8] P .S. Koutsourelakis and Tina Eliassi-Rad. Finding mixed-mem b erships in social net w orks. Pap ers fr om the 2008 AAAI Spring Symp osium So cial Information Pr o c essing, Stanfor d, CA , 2008. [9] E. A. Leich t and M. E. J. Newman. Communit y structure in directed netw orks. Physic al R eview L etters , 100:118703, 2008. [10] J. Lesk ov ec, K. J. Lang, A. Dasgupta, and M. W. Mahoney . Statistical properties of communit y structure in large so cial and information netw orks. In Pr o c e e dings of the World Wide Web Confer enc e , 2008. [11] M. E. J. Newman. ”detecting comm unity structure in net works.”. The Eur ope an Physic al Journal B , 38:321–330, 2004. [12] M. E. J. Newman. F ast algorithm for detecting comm unity structure in netw orks. Physic al R eview E , 69:066133, 2004. [13] M. E. J. Newman. Finding comm unity structure in net works using the eigenv ectors of matrices. Physic al R eview E , 74:036104, 2006. [14] M. E. J. Newman. Mo dularit y and communit y structure in net works. PROC.NA TL.A CAD.SCI.USA , 103:8577, 2006. [15] M. E. J. Newman and M. Girv an. Finding and ev aluating comm unit y structure in net works. Physic al R eview E , 69:026113, 2004. [16] L. P age, S. Brin, R. Motw ani, and T. Winograd. The pagerank citation ranking: Bringing order to the web. T ec hnical rep ort, Stanford Digital Library T ec hnologies Pro ject, 1998. [17] A. P othen, H. Simon, and K.P . Liou. Partitioning sparse matrices with eigenv ectors of graphs. SIAM J. Matrix A nal. Appl. , 11:430–452, 1990. [18] H. T ong, C. F aloutsos, and J. P an. F ast random w alk with restart and its applications. Data Mining, 2006. ICDM ’06. Sixth International Confer enc e on , pages 613–622, Dec. 2006. [19] W. W. Zachary . An information o w model for conict and ssion in small groups. Journal of Anthr op olo gic al R ese ar ch , 33:452–473, 1977. APPENDIX Belo w w e summarize the application of the leading eigen vec- tor metho d of Newman [13] to influence-based mo dularit y . If w e consider the division of the netw ork in to t w o comm u- nities, then w e could write Q as : Q = X ij ( P ij − W out i W in j W )( s i s j + 1 2 ) = 1 2 ` s T C s + X ij C ij ´ (25) where s i = 1 if vertex i ∈ group 1; − 1 if v ertex i ∈ group 2 . and s is a vector whose elements are s i and matrix C com- prises of elemen ts C ij suc h that C ij = P ij − W out i W in j W . W e symmetrize matrix C to get matrix B = C + C T . B is no w called the mo dularity matrix , and we approximate modular- it y as Q = 1 2 ` s T B s + X ij B ij ´ (26) Hence if w e wan t to divide the netw ork in such a w ay that there is more than expected influence within the comm uni- ties, we w ould hav e to maximize the change in mo dularit y due to sub division. W e note that b efore the initial divi- sion, i.e., taking the entire netw ork, since all the elements b elong to the same communit y or group the mo dularit y is Q = P ij B ij . Therefore, additional contribution ∆ Q to mo dularit y upon dividing subgroup g is: ∆ Q = [( X i,j ∈ g B i j ( s i s j + 1 2 )) − ( X i,j ∈ g B i j )] (27) ∆ Q = 1 2 [( X i,j ∈ g B i j ( s i s j ) − ( X i,j ∈ g B i j )] (28) ∆ Q = 1 2 X i,j ∈ g [ B ij − δ ij X k ∈ g B i,k ] s i s j (29) ∆ Q = 1 2 s T B ( g ) s (30) where B ( g ) ij = B ij − δ ij P k ∈ g B ik and g is the en tire netw ork for the first division of the directed graph into tw o comm u- nities C 1 and C 2 . W e can iteratively sub divide the resulting comm unities C 1 and C 2 . ∆ Q reflects the additional contri- bution to mo dularit y of the entire netw ork as the result of these sub divisions. If no further division increases mo dular- it y , we stop the pro cess. The communities thus found are the optimal, or natural, comm unities within the net work. Next we show that maximizing the mo dularit y can be appro ximated using eigen v alue decomp osition. W e can write s as a linear com bination of the normalized eigenv ectors u i of B ( g ) . Hence s = X i a i u i (31) Hence a i = u T i .s therefore ∆ Q = 1 2 s T B ( g ) s (32) ∆ Q = 1 2 ( X i a i u i ) T B ( g ) ( X i a i u i ) (33) ∆ Q = 1 2 X i a 2 i u T i B ( g ) u i (34) ∆ Q = 1 2 X i a 2 i λ i (35) ∆ Q = 1 2 X i ( u T i .s ) 2 λ i (36) where λ i is the eigenv alue of B ( g ) corresp onding to eigen v ectors u i .The eigenv alues (and their corresp onding eigen- v ectors) are lab eled in decreasing order of their magnitude i.e. λ 1 ≥ λ 2 ≥ λ 3 ≥ λ 4 ≥ · · · Since we wish to maximize ∆ Q hence we would like to c ho ose the v alue of s such that maxim um weigh t is concen- trated on the largest eigen v alues. The optimized solution w ould then b e to c ho ose s proportional to u 1 . How ever the constrain t in choosing s in this manner is that s has an ad- ditional constraint that it can only b e eiher 1 or -1. The appro ximation then used is similar to the one used spectral partitioning where all no des whose corresp onding elemen ts in u 1 are p ositiv e put in one group and the rest in the other group.
Original Paper
Loading high-quality paper...
Comments & Academic Discussion
Loading comments...
Leave a Comment