From Data Topology to a Modular Classifier
This article describes an approach to designing a distributed and modular neural classifier. This approach introduces a new hierarchical clustering that enables one to determine reliable regions in the representation space by exploiting supervised in…
Authors: ** - Abdellatif ENNAJI (Université de Rouen, 프랑스) - Arnaud RIBERT (Université de Rouen, 프랑스) - Yves LECOURTIER (Université de Rouen
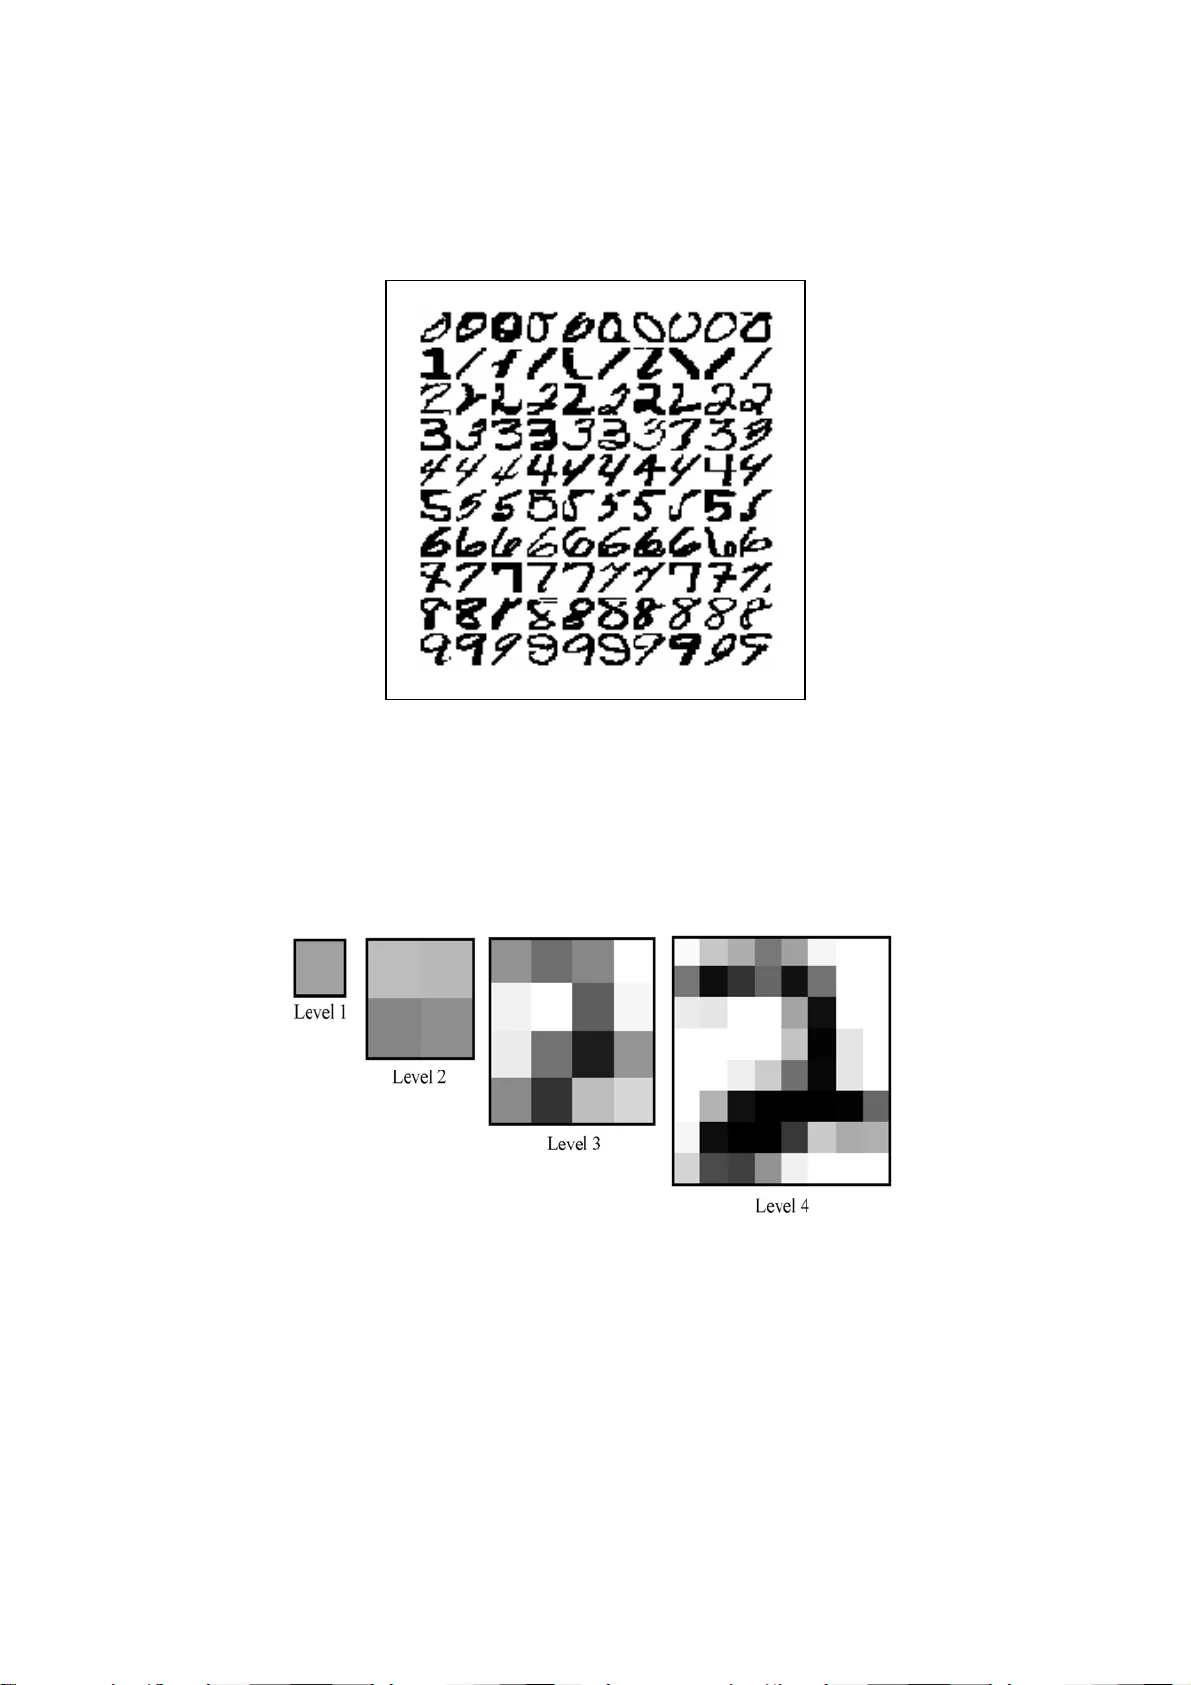
From Data To pology to a Modular Classifier Abdellatif ENNAJI, Arnaud RIBERT, Yves LECOURTIER P.S. I :. Perception, System, Information Laboratory University of Rouen, F-76821 Mont Saint Aignan cedex, France Phone : (33).2.35.14.67.65, Fax : (33).2.35.14.66.18 Contact author : Abdellatif Ennaji Email : Abdel.Ennaji@univ-rouen.fr Author's Biography Abdellatif ENNAJI has been an Associate Professor at the University of Rouen since 1993. He received a PhD degree from the Universi ty of Rouen in 1993 in the field of the cooperation in classification an d neural networks for pattern recognition applications. His current research domain concerns problems with Learning, Classification, Data Analysis, and in particular, the proble m of data increm ental learning of neural networ ks. These activities are especially applied to pattern recogn ition pr oblems and decision-m aking aid in information systems. Arnaud RIBERT received a PhD degree from the Univ ersity of Rouen in 1998. His major interest was data analysis and neural netw orks and essentially to a distribution of classification task methodologies. He currently carries out his professional activ ities in an industrial company. Yves LECOURTIER was born in 1950 in Marseilles. He received a PhD degree in signal processing in 1978, and a second one in Automatic in 1985 from the University of Paris. He was an Associate Professor from 1974 and joined the University of Rouen as a Professor in 1987. His research domain is now in pattern recognition and neural netw orks. Pr. Lecourtier is a member of AFRIF, ASTI, IAPR. From 1994 to 2000, he was the chairman of the GRCE, a French society which gathers most of the Fr ench researchers working in these fields. 2 Abstract : This article describes an approach to designing a distributed and modular neural classifier. This approach introduces a new hi erarchical clustering which enables one to determine reliable region s in the representa tion space by exploiting supervised information. A Multi-Layer Perceptron is then associated to ea ch of these detected clusters and is charged with recognizing elements of the associated c luster while rejecting all others. The obtained global classifier is constituted of a set of cooperating neural networks and is com pleted by a k-nearest neighbour classifier wh ich is charged with treating elements rejected by all the neural networks. Experimental results for the handwritten digit recognition problem and comparison with neural and statistic al non modular classifiers are given. Keywords : Neural networks, Clustering, Distributed and modular Classification system s, Learning, Pattern recognition. 3 1. Introduction Supervised classification task solving in the field of pattern recognition is currently well performed both by neural an d statistical algorithm s [11]. Neural networks, and more particularly Multi-Layer Perceptrons (MLP ) [8,15,33,34] have received a great deal of attention. The reasons for this success essentia lly come from their universal approximation property [17] and, above all, th eir good generalisation capabilities, which has been proved for many simple applications in recent years. Comparison of various ne ural and statis tical algorithms have shown that the superiority of one algorithm over another cannot be claimed [11,35]. Performances strongly depend on the ch aracteristics of the problem (number of classes, size of learning set, dimension of th e representatio n space, etc) and on the efforts devoted to the "design phase" of the algorithm s (i.e., classifier architecture determ ination, tuning of learning parameters, etc). Authors in [11] noticed also that a sufficient level of classification accuracy m ay be reached through a reasonable design effort, and further improvements often requires increasingly expe nsive design phase [7,11,22]. So, obtaining good generalisation behaviour with an MLP is not a trivial task when dealing with complex problems, since there is no reliab le and generic rule curren tly available to determ ine a suitable neural network architecture a nd this can require long trial and error research [2,3,4,6,15]. Moreover, neural networks also have many other defects that are w ell known and documented [2,3,4,6,10,15,16]. In particular, it has been shown in [13] that the MLP tends to draw open separation surfaces in the input data space, and thus cannot reliably reject patterns. Another drawback of the MLP is the so-cal led moving target problem : since there is no communication between neurones on a layer, each neurone decide inde pendently which part of the classification problem it will tackle [10]. To overcome these problems, several authors proposed th e idea to develop multi- experts decision systems [1,30,37,39,40]. This idea is mainly justified by the need to take into 4 account several sources of information -which can be complementary- in order to reach high classification accuracy and to make the d ecisions more reliable, and/or to facilitate the classifier design. In this way, several strategies covering most aspects including nature of experts, methods or topologies of decision combination, etc, have been reported in the literature these la st years [1,11,30,31,37,39,40]. The approach proposed in this paper redefine s the learning task of a neural network so that a simple network building rule can lead to good generalization capabil ities with an easy design phase. This redefinition follows a "divid e and conquer" strategy with the objective to split the classification problem into several simpler sub-tasks. This class ification task distribution is achieved while ensuring a c oherency with the data topology in the representation space. The m ain idea behind this process is to use a "supervised hierarchical clustering" which enables one to determine reli able regions in the representation space. A specialized MLP is then associated to each detected region, and a k-Nearest Neighbour classifier is charged to treat the remaining part of the learning set (non reliable regions). Thus, the whole classifier is a set of cooperative one class neural networks (experts), and it is expected to reach a high accu racy value with simplest learnin g and designing phases. Section 2 introduces the basic ideas and general principles used to design a modular and distributed classifier. The me thod investigated in section 3 ach ieves the first step of this objective by determining the clusters in the le ar ning set: this clusteri ng provides a « natural » decomposition of the problem. Reliable regions ar e then obtained through the exploitation of both supervised information (Learning data labe ls) and unsupervised result of the clustering phase, and will be presented in section 4. The pr inciples of the cooperation schem e into the distributed and modular neural cl assifier are also presented in section 4. Finally, Section 5 shows experimental results for a handwritten digit recognition problem on the NIST database. 2. Distributing a classification problem 5 Distributing a classification pr oblem presents two main point s of interest. The first one is to simplify both the design and the training of a neural network (or any other classifier) by dividing up a given task into several simpler sub- tasks. Such a sim plification is expected to lead to an improvement of the generalisation cap abilities and accuracy rejection trade-off over those allowed by a single classifier. The se cond advantage of the classification task distribution is to engineer an easy-to-update modular classifier : when new data are added in the training database, it can be expected that some modules remain unchanged, while som e others will just have to be retrained or modified. Moreover, when a new sub-class appears, a new module can easily be added avoiding a complete rebuilt of the classifier. On the other hand, sub-solutions provided by a modular classifier are usually integrated via a multi-ex pert decision m aking strategy. The multi-expert approaches based on experts cooperating differ widely (especially) both with respect to the com bination decision strategy [30] and also in the way the problem is approached. In other words, the choice of experts which correspond to the way of splitting the initial task, and/o r the context definition of each expert must be considered. The ex pert context definition includ e the data representation (set of features) used by each expe rt, the type of classifier output ... etc. The designer should take into accoun t all these parameters in the c ombination scheme [11,30,31,36,37,39,40] in order to obtain an optimal be haviour in regards of the classification performances. In order to obtain high performances wit hout significantly inc reasing the system complexity, two ways of Multiple Classifier Sys tems design may be f ollowed. First, one can consider that the chosen set of classifiers pr oviding reasonable accuracy generates a sufficient number of uncorrelated errors. In this cas e, high accuracy could be r eached if an efficient combination strategy is used to exploit this "c omplementary" behaviour. It m ust be noticed that such a behaviour is not easy to obtain in the case of a real problem. The second way 6 which can be followed in the design of Multiple Classifier System s is the above mentioned approach and it consists in decomposing the cl assification task into simpler sub-tasks, each one being handled by a separate expert. This approach d iffers from the f irst one mainly in the sense that no potential and explicit "complemen tary behaviour" between experts is expected, the main goal of such a method being to specia lise each expert in a particular sub-task. The task decomposition should produce sub-tasks as simple as possible allowing a simple and robust classification modules. The multi-expe rt s decision-making module, even sim pler, usually has enough information to m ake an accurate global decision. In this paper, a cooperative modular Neural Network, in combinati on w ith a statistical classifier, is introduced with th e objective to improve the performances in term s of robustness, adaptability and accuracy-rejecti on trade-off over those allo wed by a single classifier. In light of the above, the proposed approach tends to reach this objective by splitting the initial classification task into a simpler sub-tasks obta ined by extracting the t opology of the learning data set in the feature space. Thus, we propose an unsupervised procedur e which provides an automated task decomposition without any a priori knowledge. The simplest problem to be given to a neural network is probably a linearly separable one. Un fortunately, few real problems are as sim ple as this. A second type of simple classification problem - although m ore complex than the previous one - may be encountered for a two class problem such th at at least one of them is constituted by an homogeneous region (i.e. a uni que pure cluster containing elements of the same class only). The proposed “divide and conque r” strategy aims to identify this kind of cluster - called an "islet" - in order to provide as many tasks as islets. If N islets are detected, the classifier will thus be constituted from N cooperative neural networks, each of the m being quite simple to configure and being expected to present go od decision boundaries. In other words, the partial goal of this approach remain s to obtain a class ifier capable of defining a 7 closed separation surfaces in th e feature space allowing a reliable rejection behaviour. Such a behaviour is required in applicatio ns like pattern recognition [13]. This approach can be compared with Jacobs and Jordan’s work [18]. However, their approach is based upon a comp letely superv ised learning. Consequently, the number of experts has to be define d by the user. In the same way, this approach is close to the work presented in [16] where an unsupervised self-organ ised network is used to clusterize a MLP in order to avoid the "moving targ et" problem. This work does not allow any cooperation scheme nor a modular system but seems able to perform an incremental learning. So, the most important and common lim itation of these works is to require to know the number of clusters in learning data which is not easy when dealin g with a real and complex problem . Note that designing a distribution scheme according only to the supervised information is n ot always appropriate in regards with the ob jective to make decision s reliable, it seem s intuitive and important to take into account the real distri butio n of the learning data in the feature space. 3. Multi-Level Hierarchical Clustering As mentioned above, the first stage towards th e classification task distribution consists in capturing the data structure in the f eature space. To achieve this, the problem decomposition starts with a clustering phase in order to extract reliable clusters or regions. Thus, it implies to dete rmine the number and th e constitution of the clusters in the learning data set. The most commonly used techniques are certainly Self-Organizing Maps [23] and partitional clustering methods (lik e k-means [25]). The term « pa rtitional clu stering » is used in contrast to hierarchical clus tering, where hierarchical is in fact based on a nested sequence of partitions (in the same way as Jain & Dubes [19]). The main problem with th ese methods is that in practice, the num ber of clusters is required in a dvance to obtain a good representation of the data. Moreover, in the cas e of partitional methods, the us ually used quadratic criterion of cluster compactness leads to hyper-spherical groups, which does not necessarily match the 8 reality. Consequently, when clusters do not e xhibit compact spherical shapes, p artitional methods often provide a low quality clus tering. However, well known methods like Hierarchical clustering have been known for long time, which explore the hierarchical structure of a feature space. As th e first st ep of our approach, we will introduce a new algorithm of cluster detection from a hierarchical tree. 3.1- Hierarchical Clustering Hierarchical clustering methods give a gr aphical data represen tation without any assumption on a priori distribution nor on the number of clusters. An example of the corresponding graphical represen tation, called a dendrogram, is shown on Fig. 1. It is important to note that the height of a node represents th e distance between the groups it links. This explains why the shape of a dendrogram gi ves inform ation on the number of clusters in a data-set. Hierarchical clustering algo rithms generally proceed by sequential agglom erations of clusters. A hierarchical clustering can be bu ilt using the following algorithm , where initial points are considered as individual clusters [19]. Compute the Euclidean distance be tween every pair of points; Merge into a single cluster the two closest points; While ( There are more than one group ) Do Compute the distance betw een the new cluster and every existing o ne; Merge into a si ngle cluster the tw o closest ones; EndWhile Fig.1 It can be noticed that the Euclidean distan ce can be replaced by a ny other dissimilarity function. Moreover, an additional metric has to be introduced to measure the distance between two clusters C 1 and C 2 . One of the most commonly used me trics, called si ngle link algorithm, consists of computing the minimum distance between two points X 1 ∈ C 1 and X 2 ∈ C 2 . The maximum and average links are also often encount ered but an infinite number of metrics can 9 be obtained using Lance-W illiams' form ulae [24] and its generalisa tion [20]. It is therefore possible to adapt the metric to a particula r pr oblem. This choice has a g reat influence on the representation capabilities of the hierarchy, and then, on the possibilities of clusters extraction. Indeed, authors in [36] introduce a new technique of agglomerative hierarchical clustering in order to avoid this problem and introduce a criterion of cluster merging which makes it possible to generate n-ar y hierarchies more adapted and easy to interpret for ce rtain problems. In order to optimise the building p rocess, and to work with a well-suited metric, the Lance- Williams’ form ula has been used here, so that th e resulting m etric is close to the single link, but avoids the associated chaining effect (data te nd to be merged into a single clu ster). It is then possible to obtain large clusters whose shape is not necessari ly hyper-spherical [32]. 3.2- Clusters Detection Once the hierarchy is built, commonly used methods to determine a clustering from a dendrogram consists of cutting it horizontall y. As stated by Mil ligan and Cooper [26], numerous methods have been proposed to fi nd the best cutting point, most of them use statistical criterions such as the maxim isation/minimisation of the varianc e inter/intra-clusters. Although most of them will detect 5 clusters in the (simple) exam ple of Fig. 1, unique cutting point methods cannot efficiently trea t real data in the general case. Indeed, when dealing with a great amount of real data, the built dendrogram s are rarely as easy to interpret a s the previous one . One of the problems that can arise is a large variation of the node heights due to important variations of the density in the data. Fig. 2 gives a synthetic example of such a configur ation which cannot be efficiently treated by a unique cutting in the dendrogram. Roughly, three s ituations may occur. Mo st of the tim e, the clustering method will detect four clusters, thus ignoring the structure of the densest groups. It can also be considered that th e number of clusters is known (alt hough this is rarely verified in 10 practice). At this time, a unique cutting in the dendrogram will not lead to dete ct the three dense clusters, but will split the thre e least dense clusters. Finally, to detect the three densest clusters by a unique cutting, 17 clusters will appear, which is far from reality. This phenomena appears also on the real problem (Handw ritten digit recogniti on) as shown in [32]. Consequently, it can be said that classical methods should only be used when the data density is almost constant in the representation space. Fig. 2 The problem of density variations leads to introduce several cutting points in a dendrogram. The configuration in Fig.2 shows that (i) the data have first to be considered from a global point of view and (ii) that cert ain dense (and well structured) parts have to be detailed to obtain a reliable representation of the reality. This is why a Multi-level Hierarchical Clustering [32] is proposed in this paper. It is based upon the detection of a single cluster on a given sub-tree. Thus, if during the descendant exploration, the current sub- tree corresponds to a single cluster, no further i nvestig ation is necessary in this sub-tree. On the contrary, the exploration goes on. Identifying a single cluster in a sub-tree is know n in the literature as a "cluster validation" problem. Different bibliographica l studies [12,19,20] show that mo st of the techniques require a strong assumption upon the statistical distributi on of the expected clusters. This condition being intractable in the general case, we propose an original t echnique. Moreover, in order to have a fast procedure, all the allowed computations exclusivel y involve the hierarchy itself. Consequently, no direct use of original data will occur. From these requirements, one needs a crit erion to m easure the shape of a dendrogram, i.e. the distribution of the nodes inside the tree. This is done by com puti ng an histogram of the heights of the nodes. A typical histogram for a binary hierarchy repres enting a single cluster appears in bold lines in Fig. 3.b. If the treated data formed two clusters, the main changing in 11 the hierarchy would concern its top (in dash lines in Fig. 3.a), which would be higher than for a single cluster. Fig. 3.a illustrates an idea l situ ation where a ll the levels but the top are equa l (this assumption is only made in a sim plificat ion purpose, without any loss of generality). Then, it can be stated that ( ) is superior to ( ). Consequently, the histogram bin-widths are wider for H Level Level Max Cl Min Cl 2 − 2 Level Level Max Cl Min Cl 11 − 1 (1 cluster) than for H 2 (2 clusters). Since the levels of both hierarchie s are equal, except for the highest one, it can be s aid that the very first bars of H 2 will be taller than their equivalents in H 1 . Conversely, some of H 2 intervals will contain no elem ent (see Fig. 3.b). At last, H 2 will present a last interval with 1 element (the top of the corresponding hierarchy) . As a conclusion, it ca n be said that an histogram is sensitive to the number of clusters in the data set. This sensitivity has been measured by the standard deviation of the talln ess of an histogram bars, s, divided by their average, m. This criterion, called va riation coefficient in the literature [38] is em ployed as a measure of the homogeneity of a pop ulation. It can be noticed that in our case , this criterion is particularly interesting since it increases with the number of clus ters in a sub-tree. Fig. 3 This measure is employed in an algorithm whose principle is to explore the hierarchy in depth in order to detect a relevant changi ng in the number of clusters. At a given node, the method consists of assuming an horizon tal cutting in the hierarchy (following a simple technique which is detailed further). This cu tting reveals a certain number of sub-trees. This assumption is validated if the number of clusters detected in each sub-tree is not to o high in comparison to the num ber of clusters in the tree. Indeed, theoretically, when performing an in depth exploration, the number of clusters in a sub-tree has to be inferior to the number of clusters represented by its father. Consequently, if the detected number of clusters increases, it can be stated that the cutting was abusive. W hen dealing with real data, this princip le is not always strictly respected, and a to lerance margin has to be introduced. 12 Globally, it can be said that the method described in this paper replaces a uniq ue horizontal cutting by several well chosen ones. The horizontal cutting method that has been employed consists in sorting the values of th e hierarchy and then in computing the highest difference between two consecutive valu es (V n+1 - V n ). The cutting is then perf ormed just below the level n+1. This method has been pr eferred to a simple dichotom ic exploration because at the end of the process, it leads to system atically deci de whether there is one or two clusters in a given sub-tree, which is the mo st difficult for our criterion (which can more easily detect the pr esence of multiple cl us ters). Eventually, the em ployed algorithm is described below: Begin CurrentFatherNode = Root of the hierarchy; Make the assumption of a unique horizonta l cutting in the tree of roo t CurrentFatherNode; For Each discovered sub-tree Do CurrentNode = Root of the Current Sub-Tree; If ( s/m(CurrentNode) > α .s/m(CurrentFatherNode) ) Then Invalidate the horiz. cutting : elts of CurrentFatherNode belong to the same cluster; Stop the recu rsive exploration of CurrentFatherNode; Else CurrentFatherNode = CurrentNode; Recursively ex plore the tree of root CurrentFatherNode; End If End For End As can be seen, this algorithm only require s the determ ination of a single parameter, α ,which defines the suitable tolerance in order to deal with noisy data. This process is carried out using a small fraction of the database as a learning set. Since the number of clusters increases with α , a dichotomic research is par ticularly fast and efficient: α is initiated with a high value (e.g. 10), and quickly converges towa rds a suitable value. The function to be 13 optimised may be given by any statistic criterio n. An example of such function is given in [32] and allow us to evaluate the clustering quality in the supervised meaning. More details and discussions of this method are also given in [32], and Fi g.4 gives the obtained result of the example of Fig.2 without any parameter estim ation ( α is fixed arbitrarily to 1). Fig. 4 4. Construction of Coopera tive Modular Classifier The second step of the modular and cooperati ve classifier design consists in exploiting the clustering result in order to extract the da ta topology. This extraction is made by labelling the vectors according to their cl ass in the supervised meaning. In this way, it is possible to compare the supervised and unsupervised inform ation provided respectively by a vector label and the dendrogram. Afterwards, an analysis of the com position of the sub-trees reveals the presence of islets (i.e. clusters comprising at least P elem ents from the same class, P being user-defined and corresp ond to the minimum allowed size of an islet). Fig. 5 illustrates the resulting distribution after applying such a technique. Each islet is then learnt by an MLP which has to solve a two class problem: recognize its associated islet while rejecting all other elements. Since th e elements of an islet are close to one another, it can be expected that the problem is si mple enough to allow a basic MLP building rule to be efficient. Fig. 5 Another appropriate solution could be th e use of Radial Basis Functions (RBF) networks [27,28] rather than MLP for cluster id entification. Because of their local learning properties, the RBF-like networks seem a priori better ad apted to achieve this task. However, they also have significant defects which make th em less attractive. In particular, they usually require a very large number of neurones in order to learn a smooth transformation between input-output space [15] (mainly in the case of high dimension input space), and more training 14 data are required to achieve sim ilar precision to that of the MLP network [14]. In spite of tha t, it seems an interesting w ay to explore in future w ork. As might be expected, all elements will not be associated with som e islet. Indeed, some of the elements are located near the boun daries, so they will not appear in a pure sub- tree. Moreover, depending on P, the minimum allo wed size of an islet, large fluctuations on their number may arise. The percentage of the el ements of the learning database associated with an islet may therefore va ry in a large scale too. Consequen tly, the neural networks do not learn the whole database but only its most reliable parts. A suppl em entary classifier has thus been used to obtain high rec ognition performances. Non-parametr ic methods seem to be best- suited, since they do not requir e any real learning stage and their computing cost can be widely reduced by the cooperation process. Furthe rmore, this rem aining part of the learning set seems to belong to non reliable regions ( non hom ogenous clusters, ov erlap regions...). In practice, a K-nearest neighbour (K-NN) cla ssifier has been used for this task. Cooperation with neural networks has been implemented as follo ws : apply all the neural networks for the unknown pa ttern; if only one of them rec ognises the element, take this decision, otherwise take the decision of the K- NN. This combination strategy is basically simple knowing that many other and often m o re sophisticated methods are available [30,31,37,39,40]. Indeed, such an option was made in order to emphasize the consequent influence in the performances improvem ent and in the simplification d esign phase by the fact that the data topology was taken into account in the distribution task. Other m ore sophisticated and complex combination methods could be used and there remains opportunities for future developments and improvem ents of this work. This hierarchical ar chitecture of the neural classifier is, in its principle, close to a decision tree [9,29]. In fact, it can be seen as a particular decision tree where the nodes and leaves are neural networks. This architectu re can also been compared with nested neural 15 networks [21]. The main difference with this last, resides in the fact that in our case, the task assignation of the different modules (neural networks) is based upon a cluster analysis. 5. Experimental results : a hand written digit recognition problem Tests have been performed for a handwritt en digit recognition problem over the NIST database 3. The feature vector considered is constitu ted by the 85 (1+4+16+64) grey levels of a 4 level resolution pyramid [5]. Fig.6a gives an example of dig its from NIST database when Fig.6b shows an example of the retained representation. Fig. 6a Fig. 6b In order to test the generalisa tion capabilities of the distri buted neural cl assifier, it has been compared to two reference classifiers : a classical K nearest neighbours (KNN) and a single MLP whose architecture and parameters have been determ ined by a trial and error procedure. Training and test databases c onsisted of respectively 20,000 and 61,000 elements. Neural networks involved in th e distributed clas sifier were trained using the classical back- propagation algorithm while th eir structure was found applyi ng a simple rule : several architectures were considered (comprisin g 2, 5, 10, 15, 20, 25, 30, 35, 40, 45, 50, 100 hidden units, and 2 hidden layers of 50-20 units) ; when the speed of convergence of a given architecture was too low, the next configuratio n was tested. The first architecture to achieve success in learning all the elem ents was retained. The curves in Fig.7 represent th e average error rate (i.e. Numb er of bad decisions / Total Number of presented digits) according to the r ecognition (i.e. Number of recognized digits/Total Number of presente d digits), over 5 different traini ng and test databases following a cross-validation procedure. Reje ction rate is thus given b y 100-(error+recognitio n). These curves have been obtained following two di fferent ways, depending on the considered classifier. The K-NN curve is obtained in de creasing k, w hile requiring that the k nearest neighbours are of the same class (the maximum recognition rate is obtained when k = 1). The 16 neural network curves are obtained in increas ing the minimum value of the maximum output of the network: high thresholds will generate low error rates. Fig. 7 An average of 120 islets of more than P= 15 elements were detected, and 76% of the training set was assigned to an is let. Most of the neur al nets (88%) presente d a single layer of 10 hidden units, while two had 2 hi dden layers (of 50-20 units). It can thus be said that, as expected, learning an islet is a rather simple problem. These statistics show that the modular clas sifier always present better perform ances than the single MLP. The perform ance curve of th e distributed classifier is close to the K-NN one, except for low error-rates. Thus, for a 0% error rate, the recognition rate of the distributed classifier is 14% higher than the K-NN one, whereas in th is configuration only 41% of the decisions are taken by the netw orks. This difference shows a fundam ental dissimilarity between built boundaries (which are im plicit in the case of the K-NN algorithm). Training neural networks on islets enables them to recognize an element from a given class, whereas its 50 or 55 nearest ne ighbours are from another class. Boundaries generated by the learning of islets (even f ollowing a simple netw ork building rule) are th erefore p articularly efficient. It can be noticed that single neural networks rarely implem ent such boundaries since no explicit learning rule exist to find them. 6. Conclusion This article deals with t he problem of finding a well-suited modul ar classifier architecture for a given problem . The proposed solution consists in splitting the classification problem in several simpler sub-problem s which are determined by a supervised hiera rchical clustering procedure. The first experimental resu lts for a real classification task are prom ising, since they show that training a neural network to solve such a sub-problem leads it to define efficient decision boundaries, sp ecially when low error rates are required. Indeed, a simple 17 network building strategy perm itted the recognition of difficult patterns for the K-NN classifier, and produced better results than a pur pose-designed MLP. The reliability of neural network decisions for low erro r rates is thus significantly improved. Further experim ents should lead to a better charac terisation of these boundaries to provide explicit rules for high- performance network building. References [1] Alimoglu F., alpaydin E., Combining Multiple R epresenta tions and Classifiers for Pen- Based Handwritten Digit Recognition , In Proceedings of ICDAR' 1997, the IAPR- International Conference on Document Analysis and Recognition, IEEE Computer Society, pp 637-640, 1997. [2] Alpaydin E. GAL : Networks that grow when they learn a nd shrink when they for get . International Journal of Pattern Rec ognition and Artificial Inte lligence. n° 8, pp 391- 414,1994. [3] Ash T. Dynamic node creation in backpropagation networks . Connection Science. n° 1, pp 365-375, 1989. [4] Autere A. Comparison of genetic and other unconstrained optimisation methods . In : D.W. Pearson, N.C. Steele, R.F. Albrech t, Artificial neural nets and genetic algorithms, Springer-Verlag, Berlin, pp 348-351, 1995. [5] Ballard D.H. and Brown C.M. Computer Vision . Prentice Hall. 1982. [6] Belew R.K. et al. Evolving network : using the geneti c algorithm with connectionist learning . In : Langton C.G., Artificial lif e II, SFI studies in the sciences o f complexity Vol X. Addison-Wesley, Reading, MA, pp 511-547, 1991. [7] Beyer U., Smieja F, Learning from examples, agents teams and the concept of reflection , International Journal of Patte rn Recognition and Artificial Intellig ence 10 (3), 251-272, 1996. 18 [8] Bishop C.M. Neural networks for pattern recognition . Clarendon Press, Oxford, 95. [9] Breiman L., Friedman J.H. Olshen R.A. and C.J. Stone. Classification and regression trees . Wadsworth & Brooks/Cole, Pa cific Grove, California, 1983. [10] Fahlman S.E, Lebiere C., The cascade correlation Learning architecture , Advances in Neural Information Processing Systems, D.S. Touretsky Ed., 2, 524-532, San Mateo, CA: Morgan Kauffmann Publishers, 1990. [11] Giancinto G., Roli F., Bruzzone L. Combination of neural and statistical algorithms for supervised classification of remote- sensing images , Pattern Recognition Letters 21, pp 385-397, 2000. [12] Gordon A.D. Hierarchical Classification . I n P . A r a b i e , L . J . H ubert, G. DeSoete, Ed., Clustering and Classification. World Scientif ic Publisher, River Edge, NJ, 65-121, 1996 [13] Gori M., Scarselli F. Are Multilayer Percep trons Adequate for pattern recognition and verification , IEEE Trans. On Pattern Analysis an d Machine Intelligence, 20 (11):1121- 1132, 1998. [14] Hassoun M.H., Fundamentals of Artificial Neural Networks , MIT Press, 1995. [15] Haykin S., Neural Networks – A Comprehensive Foundations , IEEE Press, 1995. [16] Hebert J.F., Pa rizeau M., Ghazzali N., A new hybrid ANN Architecture for Active and incremental learning: the Self Or ganizing Perceptron (SOP) Network . In Proceedings of IJCNN, International Joint Conference On Artifi cial Neural Networks, 1999. [17] Hornik K. Approximation capabilities of multilayer feedforward networks . Neural Networks 4, pp 251-257, 1991. [18] Jacobs R.A., Jordan M.J ., Nowlan S.J. and G.E. Hinton. Adaptive mixtures of local experts. Neural Computation . Vol. 3, N° 1, pp 79-87, 1991. [19] Jain A.K. and Dubes R.C. Algorithms for Clustering Data . Prentice Hall, Englew ood Cliffs, New Jersey, 1988. 19 [20] Jambu M. Exploratory and Multiv ariate Data Analysis . Academic Press, Boston, 91. [21] Jansen A. Van Der Smagt P.and Groen F. Nested networks for robot control . In Murray A.F. eds. Applications of Neural Networks. Kluwer Academic Publishers, Dordrecht, the Netherlands, pp 221-239,1995. [22] Kanellopoulos I., Wilkinson G., Roli F., Austin J., (Eds). Neurocomputing in Remote Sensing Data Analysis , Springer, Berlin, 1997. [23] Kohonen T., Kangas J.A. and Laaksonen J.T. Variants of self-Organizing maps . IEEE. Trans. on Neural Networks 1, pp 93-99, 1990. [24] Lance G.N. and Williams W .T. A general theory of classifica tory sorting strategies 1. Hierarchical systems . Computer Journal 9, pp 373-380, 1967. [25] MacQueen J.B. Some methods for classification and analysis of multivariate observations . In Proceedings of the 5 th Berkeley Symposium on Mathematics Statis tics and Probability, Vol. 1, pp 281-297, 1967. [26] Milligan G.W., M.C. Cooper. An examination of procedur es for determining the number of clusters in a data set . Psychometrika 50, Iss. 2, pp 159-179, 1985. [27] Moody J., Darken C., Learning with Localized Receptive Fields , Proc. of the 1988 Connectionnist Models Summer School, pp 133-143, Morgan Kauffman Publishers, San Mateo, 1989. [28] Poggio T., Giros F., Networks for Approximation and Learning , Proc. of the IEEE, Vol. 78, n° 9, pp 1481-1497, 1990. [29] Quinlan J.R. C4.5 : Programs for Machine Learning . Morgan Kauffman, 1993. [30] Rahman A.F.R, Fairhurst M.C. Introducing new multiple expert decision combination topologies: a case study using recognition of handwritten characters . in Proceedings of ICDAR’97, 4th International Conference on Document Analysis and Recognition, vol. 2, pp 886-891, 1997. 20 [31] Rahman A.F.R, Fairhurst M.C. Multiple expert classifica tion: a new methodology for parallel decision fusion . International Journal on Docume nt Analysis and Recognition, IJDAR, Vol: 3, N°: 1, pp 40-55, 2000. [32] Ribert A., Ennaji A. and Lecourtier Y. Clustering Data : Dealing with High Density Variations . In Proceedings of ICPR'2000, the IAPR-International Conference on Pattern Recognition, vol. 2. IEEE Computer Society, 2000, pp 740-744. [33] Ripley B.D., Pattern Recognition and Neural Networks , Cambridge University Press, Cambridge, U.K., 1996. [34] Rumelhart D. and McClelland J. Parallel distributed proce ssing, explorations in the microstructure of cognition . Vol 1. MIT Press, Cambridge, MA, 1986. [35] Serpico S.B., Bruzzone L., Roli F., An exper imental compar ison of neural and statistical non-parametric algorithms for supe rvised classification of remote-sensing images , Pattern Recognition Letters 17,1996, pp 1331-1341. [36] Vuurpijl L., Schomaker L., Findin g structure in diversity : a hierarchical clustering method for the categorization of allo graphs in handwriting , Proceedings of ICDAR’97, 4th International Conference on Document Analysis and Recognition, vol. 1, pp 387- 393, 1997. [37] Vuurpijl L., Schomaker L. Two-stage character classification: A combined approach of clustering and Support Vector Classifiers . IWFHR’2000, 7th Internationa l Workshop on Frontiers in Handwriti ng Recognition, Amsterdam . 423-432, 2000. [38] Weisstein E.W. CRC Concise Encyclopedia of Mathematics . CRC Press, 1998. [39] Wu Y., Ianakiev K., Govindaraju V. Confidence combination methods in multi expert systems , Lecture Notes in Computer Scien ce, N° 1876, Advances in Pattern Recognition, Proceedings of joint international w orkshops SSPR’2000, 641-649, 2000. 21 [40] Xu L., Suen C.Y. Methods for combining multiple classifiers and their application to handwriting recognition . IEEE Transactions on Systems Man and Cybernetics 22, pp 418-435, 1992. 22 List of figures and tables Fig. 1 : An example of hierarchical clustering Fig. 2 : Dealing with high density differences with a classical hi erarchical clustering Fig. 3 : Histograms for 1 and 2 clusters Fig. 4 : A Multi-level Hierarchical Clustering Fig. 5 : An example of determ ination of islets and meta-is lets Fig. 6a: Examples of digits from NIST database Fig. 6b: Representation of a digit 2 using a 4 level resolution pyramid Fig. 7 : Performances of 3 classifiers : 20,000 instances on training set; 61,000 on test set 23 Fig. 1 24 Fig. 2 25 Fig. 3 26 Fig. 4 27 9 9 9 9 8 5 8 8 8 5 5 5 5 5 0 0 0 0 0 0 0 7 6 6 1 7 8 0 5 9 8 5,8, 1,7, 9,0, 6 5,8, 1,7, 9 5,8 Me t a - i s l e t s Islets Fig. 5 28 Fig. 6a Fig. 6b 29 Error Ref. K-NN Ref. MLP 50-20 h.u. Distributed classifier Max. 98.8 97.9 98.8 0.5% 97.5 93.5 97.6 0.4% 96.9 92.3 97.0 0.3% 96.0 90.1 96.1 0.2% 94.1 85.5 94.3 0.1% 89.9 69.0 90.6 0.0% 41.0 15.1 54.8 0 0,5 1 1,5 2 0 20 40 60 80 100 120 Recognition (% ) Error (%) Reference MLP Reference K- NN Distributed Classifier Fig. 7 30
Original Paper
Loading high-quality paper...
Comments & Academic Discussion
Loading comments...
Leave a Comment