Multiple testing procedures under confounding
While multiple testing procedures have been the focus of much statistical research, an important facet of the problem is how to deal with possible confounding. Procedures have been developed by authors in genetics and statistics. In this chapter, we …
Authors: Debashis Ghosh
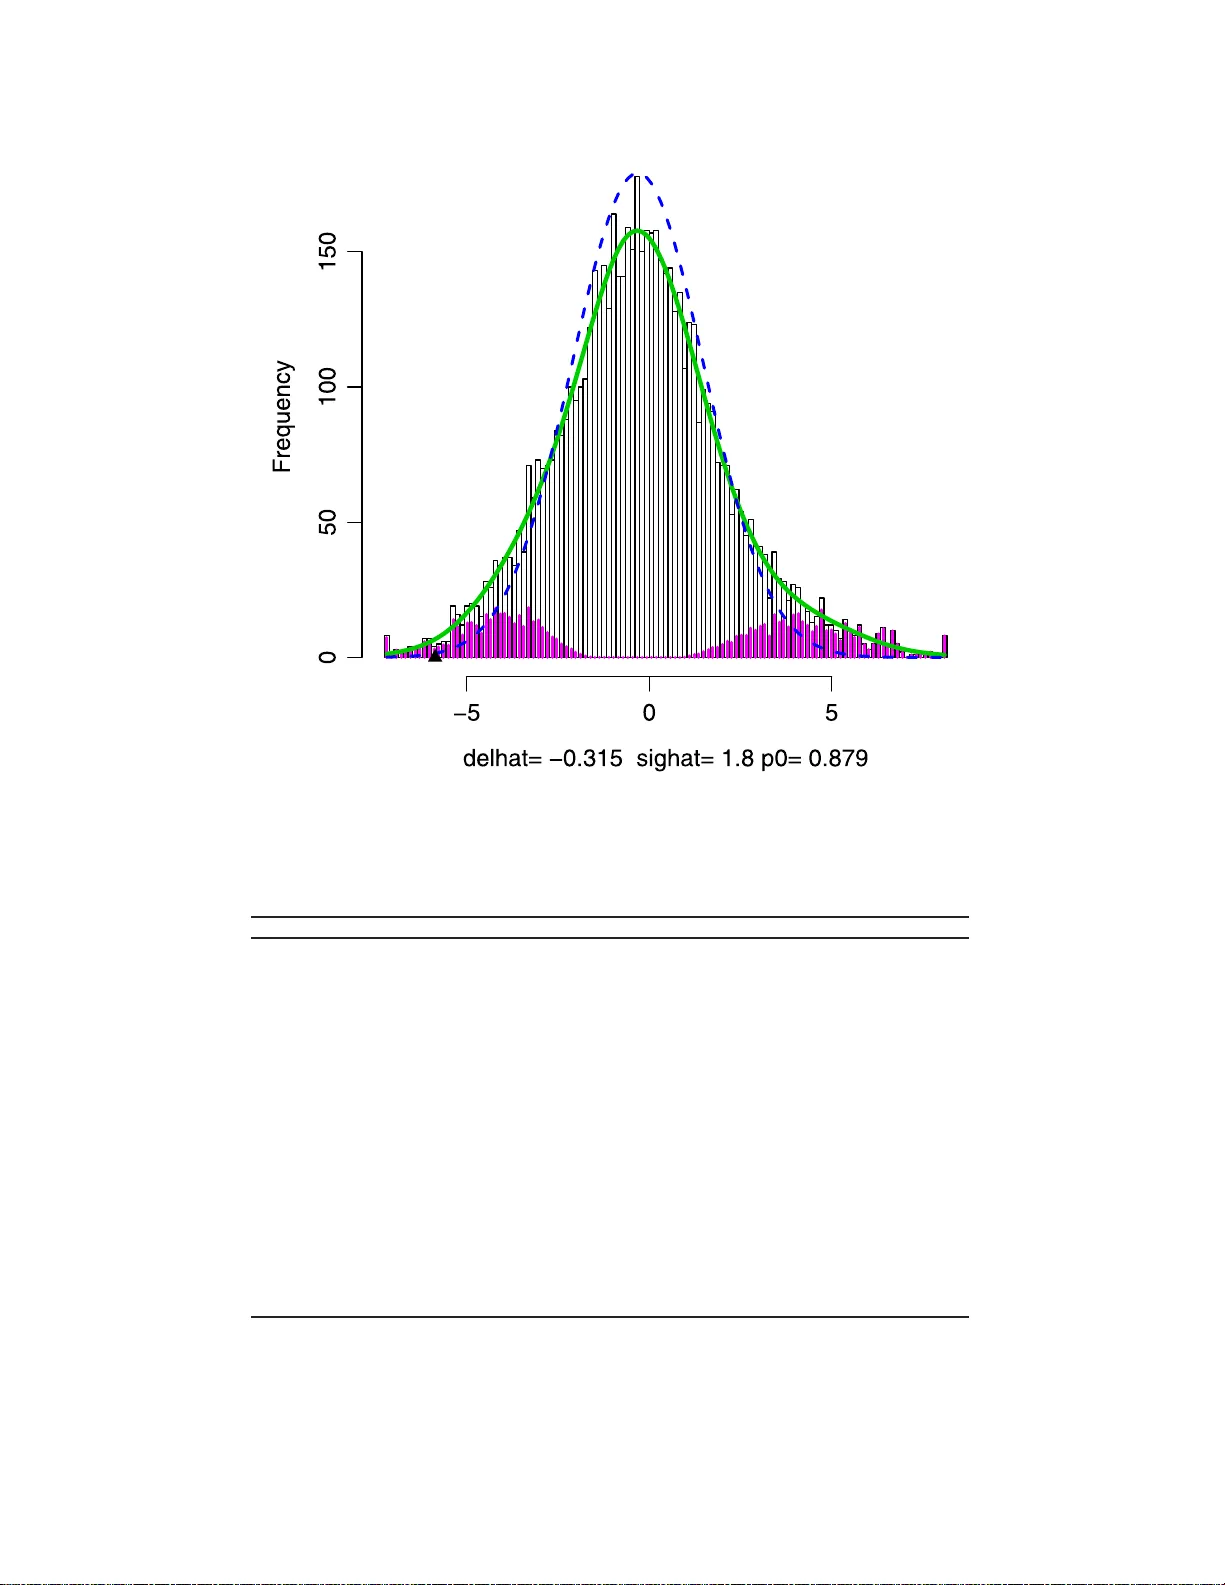
IMS Collectio ns Beyond P arametr ics in Interdisciplinary Resear c h: F estsc hrift in Honor of Pro fessor Pranab K. Sen V ol. 1 (2008) 243–25 6 c Institute of Mathemat ical Statistics , 2008 DOI: 10.1214/ 193940307 000000176 Multiple testing pro cedures under confound ing Debashis Ghosh ∗ 1 Pennsylvania State University Abstract: While m ultiple testing pro cedures ha v e b een the fo cus of muc h statistical research, an i mpor tan t facet of the problem is how to deal with possi ble confounding. Pro cedures hav e b een developed b y authors in genetics and statistics. In this chapt er, we relate these prop osals. W e prop ose tw o new multiple testing approac hes within this framework. The fir s t com bines sensi- tivit y analysis metho ds wi th false discov ery rate estimation procedures. The second inv olv es construction of s hr ink age estimators that utilize the mixture model for multiple testing. The pr ocedures are illustrated with applications to a gene expression profiling experim ent i n prostate cancer. 1. In tro duction In the study of complex dis eases such as cancer , inv estigators have sought to impli- cate candidate gene p olymo r phisms with disease. Candidate gene p olymor phisms hav e bee n t y pic a lly identified in case-control studies, wher e their frequencies in cases a nd co nt rols ar e typically compa r ed. Such studies are quite c ommonplace in the scientific literature. F or this c ontext, w e fo cus o n the problem of m ultiple tes ting . A useful quantit y to consider in m ultiple testing situations is the false disc overy rate (FDR) (Benjamini and Hoch ber g [ 2 ]). Sabatti et al. [ 24 ] a nd Ab ecas is et al. [ 1 ] hav e advocated its use in genetic asso cia tion studies. There has b e en a lot of work on sta tistical pro cedures inv o lving the fals e discov ery rate, which we review in Section 2. While muc h work has b een done on m ultiple testing pro cedures, very little work to date has be e n done on estimation for this setting. Recently , E fron [ 11 ] has ar gued that these metho ds presume theo r etical null dis- tributions, which migh t b e incorr ect, and has instead argued for use of a n empirical nu ll distribution. A parallel developmen t of this problem has o c c urred in g enetic asso ciatio n studies (Cardon and Bell [ 7 ]), in which statistica l geneticists lo ok a t frequencies of alleles in affected (cas e) and unaffected (control) po pulations to de- termine asso ciations b etw een genes and disea se. W right [ 36 ] a r gued that a v ariety of p opulation genetic forces, such as nonra ndom ma ting and g enetic dr ift, mig ht induce genetically similar s ubgroups within p o pula tions. This is r eferred to as p op- ulation str ucture in the genetic literatur e . Prop osa ls for addressing this problem hav e be en developed b y Devlin and Roeder [ 10 ] and Ro senberg and Pritchard [ 23 ]. ∗ Supported by the National Institutes of Health and the National Science F oundation. 1 Departmen t of Statistics, T he P ennsylv ania State Unive rsity , 326 Thomas Building, Ann Arb or, M I 48109-2029, USA, e-mail: debashis orama@gma il.com AMS 2000 subje ct classific ations: Primary 62P10; secondary 92D10. Keywor ds and phr ases: asso ciation studies, empirical null h ypothesis, multiple comparisons, statistical genomics. 243 244 D. Ghosh In this article, w e seek to unify these pr op osals in a f ramework for m ultiple testing in which we adjust for confounding. The p opulation structure that must be a ccounted for in genetic asso ciation studies re pr esents one t ype of confo und- ing. There has also b een mention on the r ole of other confounders in differential expression analyses for micro a rray da ta (Bhattacharya et al. [ 6 ] and Ghos h and Chinnaiyan [ 17 ]). Co nfounding is a pro blem in tha t it biases the asso ciations that are o bserved in the da ta. In other words, because of co nfounding, under the null hypothesis of no asso cia tion, the usual test statistic do es no t ha ve the corre c t mean. The str ucture of this pap er is as follows. In Section 2, we define the false dis- cov ery rate and r eview the standard mixture mo del for m ultiple h ypo thesis testing that has b een used in the literature . W e then slightly generalize the mode l to al- low for confo unding and then rela te three propo sals for m ultiple testing (Devlin and Ro eder [ 10 ], Pritchard and Rosenberg [ 23 ] and Efron [ 1 1 ]) to this model. W e then pr op ose tw o analy tical schemes for m ultiple testing in the presence of con- founding. The first inv o lves utilization of s ensitivity analysis metho ds to adjust for confounding (Lin et a l. [ 19 ]), followed by q-v a lue estimation (Storey [ 28 ]) o r a false discov ery ra te controlling pro cedure. This , a long with the link to related shrink age estimation pro cedur es (James and Stein [ 18 ], Sen and Sale h [ 2 6 , 27 ] and George [ 15 ]), is discussed in Section 3. In Section 4, we dis cuss estimation of asso cia tion, along with confidence in terv als in the m ultiple testing situation in the presence of confounding. W e highlight the pro cedure s with applications to a gene e x pression data from a pro state ca ncer s tudy in Section 5. Fina lly , we conclude with some discussion in Section 6. 2. Data structures, bac kground and prelim i naries Suppo se there ar e g ge nes that we wish to make gene-s pec ific hypotheses ab o ut. W e ca n cr oss-cla ssify the corr esp onding g h ypothes es into their true status (i.e. null is true or alter native is true) and also based on whether or not w e decide to r eject the null h ypothes is . Suc h a table is g iven in T able 1 . The c la ssical quan tit y that ha s been controlled in multiple testing problems has bee n the familywise type I e rror rate (FWER). Based on T able 1 , the FWER is defined as P ( V ≥ 1 ). By cont rast, the definition of false discov ery rate (FDR) as put forward by Benjamini and Ho ch ber g [ 2 ] is F DR ≡ E V Q | Q > 0 P ( Q > 0 ) . The conditioning on the even t [ Q > 0] is needed becaus e the fraction V /Q is not well-defined when Q = 0. If all the null hypotheses are true (i.e., g 0 = g ), then control of the false dis cov ery also provides control of the fa milywise t yp e I error rate. In general, howev er, co n trol of the tw o quant ities ar e not equiv alent, and the control of the false dis c ov ery r ate is less conserv ative than that o f FWER. T able 1 Outc omes of G t ests of hyp otheses Accept Reject T otal T rue null U V G 0 T rue alternative T S G 1 W Q G Multiple co mp arisons 245 FDR-related pro cedur es fa ll int o tw o clas s es: (1) methods that aim to control FDR; (2 ) methods for direct estimation of FDR based on a fixed r e jection regio n. The first class o f proce dur es ha s been prop osed by many author s, such a s Benjamini and Ho ch berg [ 2 ], Benjamini a nd Liu [ 3 ], Benjamini and Y ekutieli [ 4 ] and Sa rk ar [ 25 ]. E fron et al. [ 12 ], Storey [ 28 , 29 ] and Genovese and W asser ma n [ 13 ], 2005 hav e developed the s econd class of pro ce dures. The tw o classes of metho ds ha ve been unified by Storey et al. [ 30 ] and Genov ese and W asser man (2005). The FDR is a lso linked intimately to the q-v alue (Storey [ 28 ]), the smallest FDR at which a null hypothesis can b e rejected. 2.1. Mixtur e mo del fr amework for multiple testing F o r false discov ery rate estimatio n proce dur es, many authors hav e studied a mixture mo del for mult iple tes ting. T o test each n ull hypo thesis, let T g denote t he tes t statistic for the g th gene. Define indicator v ariable s H 1 , . . . , H G corres p o nding to T 1 , . . . , T G , wher e H i = 0 if the null hypothesis is true and H i = 1 if the alternative hypothesis is tr ue . Assume that H 1 , . . . , H G are a random sample fro m a Bernoulli distribution where P ( H i = 0) = π 0 , i = 1 , . . . , G . W e define the densities f 0 and f 1 corres p o nding to T i | H i = 0 and T i | H i = 1, ( i = 1 , . . . , m ). The marg inal density of the test statistics T 1 , . . . , T m is given by (2.1) f ( t ) ≡ π 0 f 0 ( t ) + (1 − π 0 ) f 1 ( t ) . The mixture mo del framework repr esented in ( 2.1 ) has b een used by several authors to study the false discovery rate (e.g., E fr on et al. [ 12 ], Storey [ 28 ] and Genov ese and W asser man [ 14 ]). Given an estimate of π 0 , methods for false discov ery rate estimation ha ve b een developed by several author s (Efro n et al. [ 12 ] and Stor ey [ 28 ]). There are several methods f or es timating π 0 in the liter ature, mo s t of which are based o n the defintion of π 0 as the deriv ative of the density of test statistics corres p o nding to the null hypothesis ev a lua ted at one. The latter definition ca n be found in Stor ey and Tibshira ni [ 31 ]; methods of estimatio n of π 0 can be found in Storey [ 28 ], Pounds and Cheng [ 22 ] and Dalmasso et al. [ 8 ]. Intuitiv ely , it is estimated base d on p- v alues that in a reg ion clo se to one; the size of the region will be inevitably linked to a bias-v ariance tradeoff regar ding the estimate of π 0 . 2.2. A djustments for c onfounding In mo del ( 2.1 ), author s hav e usually a s sumed f 0 to b e known. F or e x ample, if the test statistics are p-v alues, then f 0 has b een assumed to be the p df of a Unifor m(0 ,1 ) random v a riable. If the statistics are W ald- t yp e statistics (e.g., t w o sample t-tes ts ), then f 0 is usually tak en to b e a normal distribution with mean zero and v ariance one. There hav e been c ertain pro p o sals in which authors attempted to use permuta- tion metho ds to estimate f 0 (e.g., E fron et al. [ 12 ]). This tec hnique has b een used to account for cor r elation b etw een the h ypo theses, e.g. genes on a micr oarray hav- ing c orrela tio n. Perm utation is o ften ca r ried out b y interchanging labels b etw een independent samples. How ever, a crucial assumption of p ermutation metho d is that under the n ull hypothesis, all assignments of class la b e ls to samples ar e exchange- able. In the pr esence of confounding, this assumption is no long er true . This is wh y Efron [ 11 ] wr ites that “p ermutation metho ds do no a utomatically resolve the issue of the theor e tical versus the empir ical null hypo thesis.” 246 D. Ghosh T o acco unt for confounding, let us assume that under the null hypo thesis, the i th test statistic T i has distr ibution f C 0 i ( t ), where the subscript C denotes confounding. Assume that under the a lternative hypothesis, the distribution is f C 1 i ( t ) for T i , i = 1 , . . . , n . Then we hav e the follo wing mixtur e mo del: (2.2) T i ind ∼ π 0 f C 0 i ( t ) + (1 − π 0 ) f C 1 i ( t ) . Assume further that f C 1 i ( t ) do e s not dep end on i . Suppose there w ere s upplemen tary test statistics U 1 , . . . , U K av ailable for which it w ere known that the null hypothesis was true. The framework o f Devlin and Roeder [ 10 ] works in the following manner. Using a population g enetic mo del and the presence of populatio n stratification, they sho w that f C 0 i ( t ) will b e relatively overdisperse d compared to f 0 i ( t ), whic h they assume not to dep end o n i . T o be sp ecific, f C 0 i ( t ) = σ − 1 i f 0 ( t/σ i ) . While there should also be a mean shift (i.e. bias correction) in f C 0 relative to f 0 , Devlin and Ro eder [ 10 ] argue that the o verdispersio n outw eighs the bias; this has b een supp o rted b y other a uthors using simulation studies (W acholder et a l. [ 34 ]). Making a further assumption that the scale pa rameter σ i is consta nt acro ss the genome so that it no longer dep ends on i , Devlin a nd Roeder [ 10 ] use the s tatistics U 1 , . . . , U K to estimate σ . L e t the resulting estimator b e denoted as ˆ σ ; one can then use in ˆ σ − 1 f 0 ( t/ ˆ σ ) as the reference null hypothesis for multiple testing. Devlin a nd Ro eder [ 10 ] arg ue for the co nstant v ariance ass umption ac ross the genome using po pulation genetic arguments. An a lternative approach to adjusting for co nfounding was put forward b y Pritchard a nd Rosenber g [ 23 ]. They po stulated the existence of a latent v ar iable C such that co nditional on C = c , (2.3) T i | C = c iid ∼ π 0 f 0 ( t ) + (1 − π 0 ) f 1 ( t ) , i.e. within subp opula tions defined by C , the test statistics have the distributio n defined as in ( 2.1 ). In their metho d, wha t is needed are supplementary data that can be used to define C for eac h individual. Just as in the genomic control metho d of Devlin and Roeder [ 10 ], these are data o n genes for whic h the n ull hypo thes is is known to be true. The appr oach o f Pritchard and Rosenber g [ 23 ] is to infer sub- po pulation mem be r ship ( C ) using the supplementary data and then do standar d m ultiple testing within each subpo pulation. Conditional on C (i.e., within subpopu- lations defined by C ), the theoretical null and alter native distributions ca n b e used for the multiple testing problem. F or Pritchard and Rosenberg [ 23 ], they use the supplement al data to infer subpopula tio n mem bers hip and then for those defined by common v alues for the inferr ed cluster member s hip, they ca n p erfor m the standa rd m ultiple testing pr o cedures. The appro a ch of Efron [ 11 ] in volv es the f ollowing model: (2.4) T i iid ∼ π 0 f C 0 ( t ) + (1 − π 0 ) f C 1 ( t ) . Thu s, the densit y of the test statistics corresp onding to the null and alternative hypotheses are left unsp ecified. No relations hip b etw een f C 0 ( t ) to f 0 ( t ) is formulated, making this approach more flexible than that o f Devlin and Roeder [ 10 ]. In addition, no s upplemen tal data are r equired on known true null h ypothese s, in contrast to the Devlin and Roeder [ 10 ] and Pritchard and Ro senberg [ 2 3 ] pro po sals. T o mak e estimation in ( 2.4 ) feasible, E fron [ 11 ] ma kes a zero-matching assumption, namely Multiple co mp arisons 247 that all statistics near zero come from the n ull h ypothesis co mpo nent and relates f 1 to f 0 via an exp onential tilt (Lindsey [ 20 ]). In co mparing the prop osals, we find that b oth the method of Pritchard and Rosenberg [ 23 ] and Devlin and Ro e der [ 10 ] b oth r equire supplemental data , a s well as an assumption that the supplemental data are not asso cia ted with the phenotype in any manner. By contrast, no supplemental data are needed for the metho d of Efron [ 11 ]. How ever, a desirable feature of the fir s t tw o pro p osals mentioned is that they explicitly mo del the confounding in an easily interpretable w a y into the mo del. The Efro n appro ach is more algo rithmic in nature , although he mentions confound- ing a s being one reason to prefer the empirical null r elative to the theoretical null hypothesis. If we think of confounding as manifesting thr ough a bias and v ar iance adjust- men t to the theoretical n ull distribution, then w e find that the genomic control metho d makes a v ar iance a djustmen t to the theoretical n ull, while the approach of Pritchard and Ros e n b erg [ 23 ] prop osal mak es an adjustmen t to b oth through the latent v aria ble C . The Efro n [ 11 ] pro cedure also doe s the same witho ut sp ecifying a probabilis tic mo del for the confounding. T he first a pproach we prop ose in this pap er is to p o stulate confounding in a manner a nalogo us to P ritchard and Rosen- ber g [ 23 ]; how ever, the ac tual m ultiple testing proc e dur es do no t r equire additional data, which mak es it similar to the approa ch of Efron [ 11 ]. An imp orta n t step in application o f the pro p o sed metho dolo gy is the use of sens itivit y ana lysis metho ds, which a re describ ed next. 3. Sensitivity analysis and m ultiple testing metho dologies T o incorp ora te confounding into the analysis, we will ut ilize the framework of Lin et al. [ 19 ]. They ca st se ns itivit y analysis into a regressio n modelling framework in which the confounder w as treated as an unobs erved cov ariate. While they focused primarily on binary and time-to-even t outco mes, the data we consider in Section 5 inv o lves a contin uous resp onse. Also, we have the issue of multiple testing. 3.1. Continuous r esp onse W e observe the data ( X i , D i ), i = 1 , . . . , m , where X i is the n -dimensional cov ari- ate vector and D i the binar y phenotype for the i th individual. W e formulate the following r egress ion mo del r elating X and D : (3.1) E ( X ki | D i , U ) = β 0 k + β 1 k D i + γ C i , where ( β 0 , β 1 ) are regressio n co efficients, C repre sents the confounder and γ is the asso ciated regr ession co efficient. Note that w e assume no interaction b etw een C i and D i in ( 3.1 ). Since C is not o bserved, we fit the reduced model: (3.2) E ( X ki | D i ) = β ∗ 0 k + β ∗ 1 k D i . W e w ant to determine the r elationship betw een β 1 and β ∗ 1 . Note that integrating ( 3.1 ) with res pe c t to the conditional distr ibution of C given D implies the following mo del: (3.3) E [ X ik | D i ] = β 0 k + β 1 k D i + γ E [ C i | D i ] . 248 D. Ghosh W e now assume C | D to b e normal with mean µ D and v ariance one. F or this situa - tion, plugging in the definition and equating regression coefficients for D i in ( 3.3 ) and ( 3.2 ) yields (3.4) β 1 k = β ∗ 1 k − γ ( µ 1 − µ 0 ) . Thu s, after the user sp ecifies γ and the difference ( µ 1 − µ 0 ), the estimate o f β 1 k , ˆ β 1 k , can b e found quite ea s ily by direct computation in to ( 3.4 ) Since the inputs are co nstants, this has no impact on the standard error s of β 1 k . O ne ca n then use ˆ β 1 k / ˆ S E ( ˆ β ∗ 1 k ) a s the W ald statistic whic h when co mpared to a standa rd normal distribution yields a p-v a lue. Ag ain, the standard erro rs a re unaffected by the sensi- tivit y ana lysis para meters, a nd w e can obta in p-v alues bas e d on the W ald statistic. 3.2. Q-value/FDR adjustment for multi ple testing Based on the p-v alues ca lculated in the prev io us section, one c an co ns truct hypothesis-sp ecific q- v alues (Stor ey a nd Tibshira ni [ 31 ]). Q-v alues are defined to be the smallest FDR a t which a test o f h y po thesis is significa nt , a nalogo us to the p-v alue b eing the smallest le vel of significa nc e a t which a test o f hypothesis is deemed to b e significan t. Here is the q-v alue construction algo rithm: 1. Order the G p-v alues as p (1) ≤ p (2) ≤ · · · ≤ p ( G ) . 2. Construct a grid of L λ v alues, λ 1 , . . . , λ L and calcula te ˆ π 0 ( λ l ) = # { p j > λ l } G (1 − λ l ) , l = 1 , . . . , L . 3. Fit a cubic smo othing s pline to the v alues { λ l , ˆ π 0 ( λ l ) } , l = 1 , . . . , L . 4. Estimate π 0 by the in ter p olated v alue at λ = 1. 5. F o r th e gene with the largest p- v alue the q- v alue is given b y q ( p ( G ) ) = min t ≥ p ( G ) ˆ π 0 Gt # { p j ≤ t } = ˆ π 0 p ( G ) , and for i = G − 1 , G − 2 , . . . , 1, q ( p ( i ) ) = min( ˆ π 0 Gp ( i ) /i, ˆ p ( i +1) ). This guar - antees that the q-v alues will b e mo no tonically incr easing as a function of p-v alues. An a lternative approach is to use the p-v alues in the Benjamini-Ho ch b er g [ 2 ] pro cedure for co ntrolling the false discov ery rate: (a) Let p (1) ≤ p (2) ≤ · · · ≤ p ( G ) denote the order e d, o bserved p-v alues. (b) Find ˆ k = max { 1 ≤ k ≤ G : p ( k ) ≤ αk / G } . (c) If ˆ k exists, then reject n ull hypotheses p (1) ≤ · · · ≤ p ( ˆ k ) . Otherwis e, reject nothing. The ma jor adjustmen t in these procedure s is that we are accounting for potential adjustment of co nfo unding , which impacts the p- v alues that get used in the multiple testing pro cedur es. Note that while we ha ve used q-v alues to adjust for the multiple testing problem, the p-v a lue s can be input in to an y single-step algo rithm for mult iple tes ting. If we wished to con trol the fa milywise t ype I err or level instead, we co uld use any of the Multiple co mp arisons 249 pro cedures from W estfall and Y oung (1993) or so me of the more rec ent methods from V an der Laan and Dudoit a nd colleagues (V an der L a an et al. [ 32 , 33 ]). One thing to note a bo ut the sensitivit y ana lysis metho d describ ed in Section 3 .1 and is that it is effectiv ely making an mean-s hift adjustment to the theoretical null distribution. In par ticular, the standa rd er rors of the estima to rs are not affected by the sensitivity analys is metho d of Lin et al. [ 19 ]. The m ultiple testing mo del that adjusts for co nfounding assumed here, in the notation of Section 2, is the following: (3.5) T i | Θ iid ∼ π 0 f 0 ( t − Θ) + (1 − π 0 ) f 1 ( t ) , where Θ denotes the sensitivity analysis inputs and a re fixed consta nt s sp ecified by the user. One adv a nt age of such a model for confounding is that it r e quires minimal user input and is easy to implement. A second adv antage is that what ar e affected in this proc e dur e is the estimate of π 0 and the actual q-v alues themselves. In settings where in vestigators are interested in the selection of hypotheses, these quantities migh t be a ll that is of interest. In comparing this mixture model with ( 2.2 ) and ( 2.3 ), w e find that the s e ns itivit y analysis approa ch models c o nfounding as a shift in the mean for the confounding nu ll density relative to the theoretical null density . W e allo w for nonconstant v ari- ance acr oss the genome, in con trast to the appr oach o f Devlin and Roeder [ 10 ]. In addition, unlik e Dev lin and Ro e der [ 10 ], we mo del the bias due to confounding. By compa rison, the Pritchard a nd Rosenberg [ 23 ] and Efron [ 11 ] appro aches would allow for both a mean and v ar iance adjustmen t for the null h ypothes is density . It appea rs that combining the appro ach here with t hat of g enomic con trol s ho uld provide an answer that is closer to the Pritchard and Ros e n b erg [ 23 ] pro p osal, if supplement al data were av ailable. 3.3. Shrinkage estimation for the q-value W e now heuristically describ e an ar gument, given in more detail in Ghosh [ 16 ], that shows how the q-v a lue can be motiv ated as a shrink ag e estimator in the m ultiple testing pro blem. Consider mo del ( 2.1 ) ag ain, whe r e the test statistics ar e the p- v alues. Then one could construct shrink ag e estimators of the p-v alues where they are shr unk towards the comp onents of the mixture mo del defined b y ( 2.1 ). If w e assume that the densit y o f the n ull hyp o thesis is a point ma ss at one and that of the alter native is zero, then it is shown in Ghos h [ 16 ] that a shr ink age es timator of the p-v alue in th is problem is lo w er bounded by the q-v a lue. Th us, th e q-v a lue approach advocated by Stor ey [ 28 ] enjo ys a nice shrink a ge pro pe rty . How ever, the definition o f the q-v alue given by Storey [ 28 ] is a ppropriate to the situation of 0 / 1 loss (miscla ssification err or). The shr ink age es timation pro cedur e by Ghosh [ 16 ] could generalize e a sily to other loss functions, whic h might b e more appropria te in other scientific cont exts. 4. Estimators of ass o ciation in the pres ence of confounding A limitation o f all these approa ches is tha t they do not pro duce mult iple-testing adjusted e s timates of ass o ciation or confidence in terv als. W e no w discuss the prob- lem o f how to estimate asso ciation mea sures in the m ultiple testing problem in the presence of co nfounding. While the multiple testing problem has b een considered quite int ensively in the statistica l literature, that of estima ting ass o ciations has not. 250 D. Ghosh This w as p ointed out recen tly by P rentice and Qi [ 21 ] in a genomewide study ex- ample. Our approach is based on the idea that we can use ( 2.1 ) to define e stimation targets under the null and alternativ e hypo theses. One then can define Empirical Bay es estimators that shrink the observed test statistic tow a rds each target with appropria te mixing w eight s. F o r estimatio n, J ames-Stein (Ja mes and Stein [ 18 ]) estimators are used. W e now construct the double s hrink ag e estimators using the tes t statistic mo del ( 2.1 ) where F = π 0 F 0 +(1 − π 0 ) F 1 . T o do this, we utilize the densit y estimation metho d pro p osed by E fron [ 11 ]. Note fro m ( 2.1 ) that w e ha v e π 1 f 1 ( t ) = f ( t ) − π 0 f 0 ( t ) . W e ca n estimate f ( t ) by apply ing density estimation metho ds to T 1 , . . . , T G . F or estimation of π 0 f 0 ( t ), the zer o a ssumption in E fron [ 1 1 ] is utilized. What this means is that most test statistics with a v alue near z e r o comes fr om the null distribution comp onent. The assumption, combined with a no rmal-base d mo ment s matching techn ique and density estimatio n pro cedures as describ ed in Efron [ 11 ], allows o ne to obtain an estimate of π 0 and f 0 ( t ). Giv e n them, w e then obtain a n estimate of π 1 and f 1 ( t ) b y simple subtraction. Ba s ed on the estimates of f 0 ( t ), f 1 ( t ) and π 0 , we c an estimate T J S 1 , . . . , T J S n by (4.1) ˆ T J S i = ˆ π 0 ( T i ) ˆ T J S 0 i + { 1 − ˆ π 0 ( T i ) } ˆ T J S 0 i , where ˆ T J S 0 i = T i − " 1 ∧ G − 2 P G i =1 ( T i − ˆ µ 0 ) 2 # ( T i − ˆ µ 0 ) , ˆ T J S 1 i = T i − " 1 ∧ G − 2 P G i =1 ( T i − ˆ µ 1 ) 2 # ( T i − ˆ µ 1 ) , ˆ π k ( t ) = ˆ π k ˆ f k ( t ) ˆ π 0 ˆ f 0 ( t ) + (1 − ˆ π 0 ) ˆ f 1 ( t ) , ˆ µ 0 = R td ˆ F 0 ( t ) and ˆ µ 1 = R td ˆ F 1 ( t ). Before discuss ing the issue o f confidence in terv als, no te that w e are us ing the mo del fr amework of E fron [ 11 ] to dea l with confounding, i.e., model ( 2.4 ). As men- tioned b efore, estimation in this model requires no s upplemen tal data on known nu ll hypotheses. Along with estimators o f the par ameters that a djust for multiple testing, it is useful to hav e confidence in terv als that als o account for the m ultiple testing phe- nomenon. T o calculate the confidence in terv als , we will use the following sim ulation- based algor ithm: 1. Estimate π 0 , f 0 and f 1 using the algo rithm ab ove. 2. Construct the double shrink age estimators of µ 1 , . . . , µ G , ˆ T J S 1 , . . . , ˆ T J S G . 3. Sample with r e placement G observ a tions µ ∗ 1 , . . . , µ ∗ G from the es timated den- sity ˆ π 0 ˆ f 0 ( t ) + (1 − ˆ π 0 ) ˆ f 1 ( t ) and generate T ∗ 1 , 1 , . . . , T ∗ G, 1 , where T ∗ i, 1 ∼ N ( ˆ T J S i , 1 + ˆ σ 2 ∗ ), where ˆ σ 2 ∗ is the empirical v a riance of the µ ∗ ’s sampled in Step 2. 4. Repe a t Step 3 B times. Use the empirical distr ibution o f T ∗ i, 1 , . . . , T ∗ i,B to calculate confidence interv als for µ i , i = 1 , . . . , G . 5. Multiply b y the gene-specific standard devia tions to get confidence interv als on the scale of the par ameter. Multiple co mp arisons 251 Based on the b o otstra p distributions, we can co nstruct confidence interv als for each of the comp onents of µ ≡ ( µ 1 , . . . , µ G ). W e hav e chosen to use equal tail confidence int erv a ls, e.g. a 95% co nfidence int erv a l would b e based on the 2.5 th and 97.5th per centiles of the empirical distribution of T ∗ i . 5. Numerical example: Mi croarra y profiling s tudy in prostate cancer W e no w illustrate the pro p o sed metho dologies using tw o genomic studies. The first comes fro m prostate cancer g e ne expression profiling exp eriment rep orted in V ar ambally et al. [ 35 ]. The inv estigators us e d cDNA micro arrays co ntaining 9984 genes to profile tissue samples from v arious stages of prostate cancer (normal ad- jacent prostate, b enign prostatic hyperpla sia, lo calized prostate cancer , adv anced metastatic pro state cancer). Measurements w ere made on 99 84 genes for 10 1 individuals, of who m 79 have cancers and 22 do not. Before analyzing the data, we filtered out genes that ha d a sample v ariation less than 0.05 across all samples. This left a total o f G ≡ 6 253 genes av ailable for analy s is. First, a q-v alue analysis (St orey [ 28 ]) w a s done using the unpo o led t wo-sample t-test; this is rep o r ted in Figure 1. F or this analy s is, w e assumed a theoretical nu ll distribution of N (0 , 1) for ea ch t-statistic. O ne po int of note from the plot is the estimate of π 0 , the fraction of null h ypothes e s estimated to b e tr ue, is 0.49. As a result, we are finding a large prop o rtion of genes to b e differentially expres sed. Fig 1 . R esults of the q -value analysis (Stor ey [ 28 ]) f or pr ostate c anc er gene e xpr ession data. 252 D. Ghosh T able 2 R esults of sensi t ivity analyses for g ene expr ession data γ ( µ 1 − µ 0 ) ˆ π 0 Num ber q-v alues ≤ 0.05 0 0 0 . 49 2099 1.5 0 . 01 0 . 86 1762 0 . 1 0 . 47 613 0 . 3 0 . 05 6227 0 . 5 0 . 01 6253 1 0 . 006 6253 0.1 0 . 01 0 . 49 2415 0 . 1 0 . 78 1902 0 . 3 0 . 86 1466 0 . 5 0 . 80 1154 1 0 . 69 586 As ar g ued by Ghosh and Chinnaiy an [ 1 7 ], there is a v ariety o f co nfounders that might ca use the apparent o bserved difference betw een the cancer and noncancer samples. The implica tion is that the s tandard normal distribution might not b e the correct r eference null distributio n to use. W e tried adjustments to the t-statistic based o n the s ensitivity analysis appr oach. First, w e assumed a confounder that was co nt inuous and tried v a rious v alues o f ( γ , µ 1 , µ 0 ) to obtain estimates of π 0 and the q-v a lues. Note that what matters is the difference in means µ 1 − µ 0 , so we considered changes of 0 . 01 , 0 . 1 , 0 . 3 , 0 . 5 and 1. W e have aggrega ted the sensitiv ity results into T able 2. What we find is that the estimate of π 0 is extremely sensitive to confounders . In terestingly , as the pr o duct of γ and ( µ 1 − µ 0 ) decr e ases, w e find that the es timate of the prop or tion of true null h yp o theses increa s es, which lea ds to a decrease in the num ber of gene s being called significant if w e use a cutoff of 0 .05, say . How ever, we als o see that there is no simple relationship betw een the amoun t of confounding and the estimate of π 0 . The estimate of n um ber of genes b eing called significant is also sensitive to the estimate of π 0 . F or example, there is very little difference in the estimates of π 0 for the unadjusted and ( γ , µ 1 − µ 0 ) = (0 . 1 , 0 . 01) situation, y et we are calling approximately four h undred more genes sig nificant in the second scenar io. This emphasizes the need to ha v e g o o d estimates of π 0 . Next, w e utilized the E fron [ 11 ] metho d for estimating the lo cal false discovery rates; the results are prese n ted in Figure 2. Ag ain, this pro cedure co rresp onds to a data-driven adjustment to null hypothese s for confounding. Now note that the estimate of π 0 from the Efron [ 11 ] pro cedure is 0 . 88, almos t 80% larg er than the estimate using the method of Storey [ 28 ]. This fits into our intuition that adjusting for confounding s ho uld decrease the num ber of significant genes. W e next calculated the do uble-shrink a ge estimators for the t-statistics using the metho d in Section 3 .1 . W e then com bined an FDR-thresholding pro cedure with the inference pro cedures describ ed in the paper. This was done in the follo wing manner . W e applied the q-v alue pro cedure o f Stor ey [ 28 ] a nd s e le cted the genes with the t w en ty smalles t q- v alues. W e r e po rted the effects and asso ciated 95% co nfidence interv als in T able 3 . Note that the 95% CIs sho uld b e cons erv ative in that we hav e igno r ed the s election pro cess (i.e. taken the tw ent y genes with the sma llest q-v alues ). 6. Discussion In this article, we hav e addr essed the issue of m ultiple testing pro cedur es in the presence of confounding. First, we sought to unify propo s als from the statistical and genetics literature on the problem. Doing so clar ifie s and provides a stronger Multiple co mp arisons 253 Fig 2 . R esults of the t -test statistics fr om the pr ostate c anc er gene expr ession data using the lo c al false disc overy r ate estimation pr o c e dur e of Efr on [ 11 ]. T able 3 R esults for t op 20 genes for pr ostate c anc er gene expr ession data Gene name Estimator S ˆ β 95% CI T ransforming growth factor, b eta 1 6 . 99 0 . 30 (0 . 09 , 0 . 52) F er-1-like 3, my oferlin (C. elegans) 8 . 36 0 . 55 (0 . 14 , 0 . 93) O-linked N-acet ylglucosamine transferase − 9 . 11 − 0 . 51 ( − 0 . 88 , − 0 . 18) Human calmo dulin-I (CALM1) mRNA 6 . 87 0 . 56 (0 . 17 , 0 . 98) Hepsin (transmembrane pr otease, serine 1) − 6 . 89 − 0 . 95 ( − 1 . 62 , − 0 . 30) Ca ve olin 2 7 . 44 0 . 53 (0 . 16 , 0 . 85) Ras homolog gene famil y , mem b er B 6 . 7 1 . 41 (0 . 42 , 2 . 40) Zinc finger protein 36, C3H t ype-l ike 1 6 . 76 0 . 52 (0 . 16 , 0 . 87) Hepatic l euk emia f actor 6 . 72 0 . 46 (0 . 11 , 0 . 78) Phosphatidic acid phosphatase type 2B 6 . 59 0 . 34 (0 . 08 , 0 . 60) Multiple endo crine neoplasia I − 6 . 51 − 0 . 31 ( − 0 . 54 , − 0 . 08) Endothelin r eceptor type A 6 . 47 0 . 51 (0 . 12 , 0 . 92) T ransforming growth factor, b eta receptor I I I 6 . 38 0 . 54 (0 . 10 , 0 . 98) Gro wth factor receptor-bound protein 2 − 6 . 31 − 0 . 42 ( − 0 . 77 , − 0 . 12) Hermansky-Pudlak s yndrome 1 6 . 32 0 . 34 (0 . 07 , 0 . 58) Dickk opf homolog 3 (Xenopus l aevis) 6 . 29 0 . 34 (0 . 09 , 0 . 61) Phosphatidic acid phosphatase type 2B 6 . 24 0 . 32 (0 . 06 , 0 . 57) Tissue inhibitor of metalloproteinase 3 6 . 2 0 . 55 (0 . 12 , 1 . 00) Hypothetical protein hCLA-iso − 6 . 13 − 0 . 38 ( − 0 . 70 , − 0 . 09) Zinc finger protein 36, C3H t ype-l ike 2 6 . 08 0 . 34 (0 . 08 , 0 . 62) 254 D. Ghosh justification for pr e ferring the empirical null distribution that Efro n [ 11 ] has rece ntly advocated. It is also clear fro m the discussion that wha t the metho ds of Devlin and Ro eder [ 10 ] a nd Pritc hard and Rose n b erg [ 2 3 ] provide are a djustmen ts to the theoretical null, using supplemen tal data and under v ar ious assumptions on the nature of confounding a nd its effects on lo cation a nd scale par ameters. Second, we hav e prop osed tw o ana lytical approaches. The first is a sensitivity analysis approach using a methodology describ ed b y Lin et al. [ 19 ], whic h is then plugged into standa rd FDR metho dology . As shown in the article, this can b e viewed as a mean-shift adjustment to the theoretical null. The seco nd pr o cedure in the a rticle we pursue is one using E mpirical Bay es methodolo gy . This inv o lves utilizing the mixture mo del for hyp o thesis testing in the pr esence of confounding prop osed by Efron [ 11 ] and constr ucting James-Stein estimators of the test s tatistic that shr ink age tow ards each target (that spe c ified under the nu ll a nd that under the alternative) with data-dep endent weights. What is novel here is tha t the mea n v alue of the distribution of the test statistic under the null is als o estimated as par t of the pro cedure. This leads to calibration of the test statistics under the empirical nu ll h ypo thes is (Efro n [ 11 ]) r ather than the theoretical n ull hypothesis . W e also develop confidence interv als in the multiple testing setting, which has no t b een discussed very muc h in the liter ature, with the ma jor exception being the work o n FDR-controlling confidence in terv als by Benjamini and Y ek utieli [ 5 ]. The metho do logy prop osed her e is fairly general. The se ns itivit y analysis regres - sion mo dels co nsidered here ar e a subset of those considered by Lin et al. [ 19 ]; the metho dology prop osed here could apply more g enerally to censored outcomes through propo rtional haza rds r egressio n mo dels and coun t r esp onses using Pois- son regression mo dels. The double shrink age estimation metho dology in Section 4 requires having W ald-type estimators. While there hav e b een Empirica l Bay es meth o ds for mult iple tes ting prop osed in the literature (Efron et a l. [ 12 ], Datta and Datta [ 9 ] and Ghosh [ 1 6 ]), most o f this work has fo cused o n hypothesis testing and selection o f hypotheses. While this is useful in scr eening problems, it mig ht also b e of interest to rep ort estimated effects and confidence in terv als corres p o nding to the rejected null hypotheses . A ma jor p otential adv an tage of Empirical Bayes (and more genera lly , fully Bay esian) metho ds in this setting is that pa r ameter estimates and co nfidence int erv a ls w ill be unaffected by the selection of whic h h y po theses to reject, provided the testing pro cedure is Bayesian. This is an ar ea that is curr ent ly under inv estigation. Ac knowledgment s. The a uthor would like to thank T om Nichols and T rivellore Raghunathan for helpful discussions. References [1] Abecasis, G. R., Ghosh, D. and Nicho ls, T. E. ( 2005 ). Link a g e disequi- librium: Ancient history drives the new g enetics. Hu man Her e dity 59 11 8–12 4. [2] Benjamini, Y. a nd Hochberg, Y. (19 95). Controlling the false dis cov ery rate: A practical a nd p owerful approa ch to m ultiple testing. J. R oy. S tatist. So c. Ser. B 57 28 9–30 0. MR13253 92 [3] Benjamini, Y. and Liu, W. (199 9). A s tep-down multiple hypothesis testing pro cedure that controls the false discov ery r ate under indep endence. J. S tatist. Plann. In fer enc e 82 163 –170. MR17364 41 Multiple co mp arisons 255 [4] Benjamini, Y. and Yekutieli, D. (2 001). The co nt rol of the false discov- ery rate in multiple testing under dep endency . Ann. Statist. 29 1165–1 188. MR18692 45 [5] Benjamini, Y. and Yeku tieli, D. (2005 ). F alse discov ery rate controlling confidence in terv als for selected par ameters (with discuss ion). J. Amer. Statist. Asso c. 10 0 71–80 . MR21568 20 [6] Bha tt a char y a, S., Long, D. and L yons-Weiler, J. (2003). Overcoming confounded controls in the a nalysis of gene expr ession da ta from microarr ay exp eriments. Applie d Bioinfo rmatics 2 197–20 8. [7] Cardon, L. and Bell, J. (2001). Asso ciatio n study designs for co mplex diseases. Natur e R eviews Genetics 2 9 1–99. [8] Dalmasso, C., Br o ¨ et, P. and Morea u, T. (20 05). A simple pro c e dure for estimating the false dis cov ery ra te. Bioinf ormatics 21 660–66 8. [9] Da tt a, S. and Da tt a, S. (2005). Empirical Bay es scre e ning of many p-v alues with applications to micro array studies. Bioinformatics 21 1987– 1994. [10] Devlin, B. and R oeder, K. (19 99). Genomic control for as so ciation studies. Biometrics 55 997 –100 4. [11] Efron, B. (2004 ). Large-sca le simultaneous hypothesis testing: The choice o f a null hypo thesis. J. A mer. S tatist. A sso c. 99 96 –104 . MR20542 89 [12] Efron, B., Tibshirani, R., Storey, J. D. and Tusher, V. (2001). Em- pirical B ay es ana lysis o f a microarr ay experiment. J. Amer. St atist. Asso c. 96 1151– 1160 . MR19465 71 [13] Genovese, C. and W asserman, L. (20 02). Op era ting characteristics a nd extensions o f the false discov ery rate pr o cedure. J. Ro y. Statist. So c. Ser. B 64 499– 5 17. MR19243 03 [14] Genovese, C. and W asserman, L. (2004). A sto chastic approach to false discov ery control. Ann. Statist. 32 103 5–106 1. MR20651 97 [15] George, E. I. (1986). Minimax m ultiple shrink age estimatio n. A nn. Statist. 14 188– 2 05. MR08295 62 [16] Ghosh, D. (2006). Shrunken p-v alues for assessing differential expression, with applications to genomic data a nalysis. Biometrics 5 9 1099– 1106. MR229 7681 [17] Ghosh, D. and Chinnaiy an, A. M. (200 5). Cov ar ia te adjustmen t in the analysis o f microa rray data from clinical studies. F unctional and Inte gr ative Genomics 5 18 –27. [18] James, W. and Stein, C. (1 961). E stimation with qua dratic lo s s. Pr o c. F ourth Berkeley Symp. Math. St atist. Pr ob ab. 361– 380. Univ. Ca lifo rnia P ress, Berkeley . MR01331 91 [19] Lin, D. Y., Kronmal, R. A. and Psa ty, B. M. (1998). Ass essing the sensitivity of regressio n r esults to unmeas ur ed confounders in o bserv a tional studies. Biometrics 5 4 9 48–9 6 3. [20] Lindsey, J. K. (1974 ). Co mparison o f probability distributions. J. R oy. Statist. So c. Ser. B 36 38–47 . MR03626 43 [21] Prentice, R. L. and Qi, L. (2006 ). Asp ects of the design and analysis of high-dimensional SNP studies for disease risk estimation. Biostatistics 7 339– 354. [22] Pounds, S. a nd Cheng, C. (2004). Improving false discov ery r ate estimation. Bioinfo rmatics 20 1737– 1745 . [23] Pritchard, J. K. and Rosenber g, N . A. (1999). Use o f unlink ed genetic markers to detect p opulatio n str atification in as s o ciation studies. Amer. J. Human Genetics 6 5 2 20–2 28. [24] Saba tti, C., Ser vice, S. and Freimer, N. (2003). F alse disco very r ate in 256 D. Ghosh link age and as so ciation g enome screens for co mplex disorder s . Genetics 164 829–8 33. [25] Sarkar, S. (2002). Some results on false discov ery rates in multiple testing pro cedures. Ann. Statist. 3 0 2 39–2 5 7. MR18926 63 [26] Sen, P . K. a nd Saleh, A. K. (1985). O n so me shrink age estimator s of m ultiv aria te lo cation. Ann. Statist. 1 3 2 72–2 8 1. MR0773 167 [27] Sen, P. K. and Saleh, A. K. (1987). On pr eliminary test and shrink age M -estimation in linear mo dels. A nn. Statist . 15 1580 –1592 . MR09135 75 [28] Storey, J. D. (20 0 2). A dir ect appro ach to fals e discov ery rates . J. R oy. Statist. So c. Ser. B 64 479–4 9 8. MR19 2430 2 [29] Storey, J. D. (2003 ). The p ositive false discov ery rate: A Bay esian interpre- tation and the q- v alue. Ann. Statist. 31 20 13–2 035. MR2036 3 98 [30] Storey, J. D., T a ylor, J. E. and Siegmund, D. (2004). Strong con trol, conserv ativ e po int estimation and simultaneous conserv ative consis tency of false discov ery r a tes: A unified approach. J. R oy. Statist. So c. Ser. B 66 187 – 205. MR20357 66 [31] Storey, J. D. and Tibshirani, R. (20 0 3). Statistical significance for genomewide studies. Pr o c. Nat. Ac ad. S ci. US A 100 9440 –9445 . MR19 9 4856 [32] v an der Laan, M. J., Dudoit, S. and Polla rd, K. S. (2004a ). Augmen- tation pro cedures for control of the generalized family-wise error rate and tail probabilities for the prop ortio n of false p ositives. Statistic al Applic ations in Genetics and Mole cular Biolo gy 3 Article 15 . MR21014 64 [33] v an der Laan, M. J., Dudoit, S. and Po llard, K. S. (2004b). Multi- ple testing. P art I I. Step-down pro cedures for con trol of the family-wis e erro r rate. Statistic al Applic ations in Genetics and Mole cular Biolo gy 3 Article 14. MR21014 63 [34] W a cholder, S. , Rothman, N. and Caporaso, N. (200 0). Population stratification in epidemiolog ic studies of common genetic v a riants and cancer: Quantification of bia s. J. National Canc er In stitute 92 115 1 –115 8. [35] V aramball y, S. et a l. (200 2). The p olyco mb gro up pr otein EZH2 is inv o lved in progr ession of pr ostate cancer . N atur e 419 6 24–62 9. [36] Wright, S. (1951 ). The genetical s tr ucture of p opulations. Ann. Eugenics 15 323–3 54. MR00414 13
Original Paper
Loading high-quality paper...
Comments & Academic Discussion
Loading comments...
Leave a Comment