Accounting for self-protective responses in randomized response data from a social security survey using the zero-inflated Poisson model
In 2004 the Dutch Department of Social Affairs conducted a survey to assess the extent of noncompliance with social security regulations. The survey was conducted among 870 recipients of social security benefits and included a series of sensitive que…
Authors: Maarten J. L. F. Cruyff, Ulf B"ockenholt, Ardo van den Hout
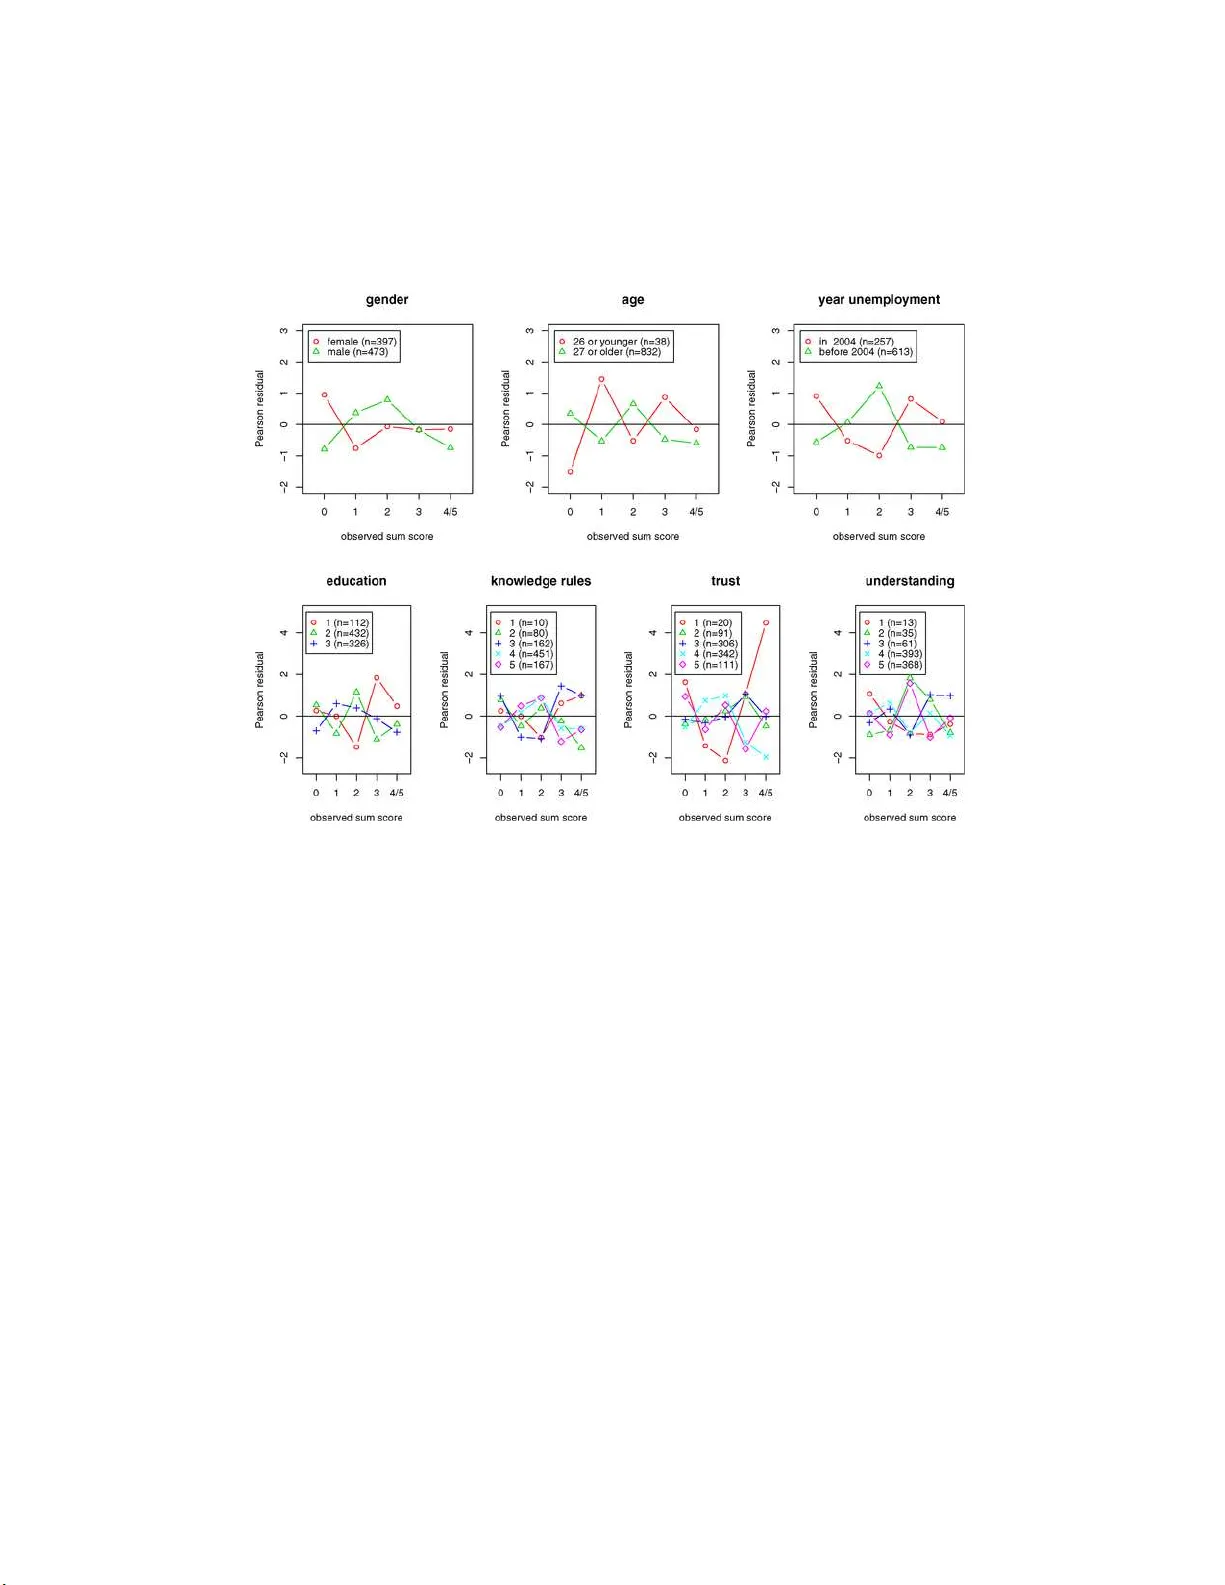
The Annals of Applie d Statistics 2008, V ol. 2, No. 1, 316–331 DOI: 10.1214 /07-A OAS135 c Institute of Mathematical Statistics , 2 008 A C COUNTING F OR S ELF-PR OTE CTIVE RESPONSE S I N RANDOMIZED RESPONSE DA T A FR OM A SOCIAL SECURITY SUR VEY USING THE ZER O-INFLA TED POISS ON MODEL By Maar ten J. L. F. Cr uyff, Ulf B ¨ ockenhol t, Ardo v an den Hout and Peter G. M. v an der Heijden Utr e cht University , McGil l University and MRC Biostatistics Unit In 2004 the Dutch Department of S ocial Affairs conduct ed a sur- vey to a ssess the extent of noncompliance with social security reg- ulations. The survey w as conducted among 870 recipients of social securit y b enefi ts and included a series of sensitive q uestions ab out regulatory noncompliance. Due to the sensitiv e nature of the ques- tions the randomized response design was u sed. Although random- ized resp onse protects the priva cy of the resp ond ent, it is unlikely that all resp ond ents follo we d the d esign. I n t his pap er w e introdu ce a mod el that allow s for respon d ents d ispla y ing self-protective respon se b ehavior b y consisten t ly giving the nonincriminating response, irre- sp ective of the outcome of the randomizing device. The dep end ent v ariable denoting the t otal number of incriminating resp onses is as- sumed to b e generated by the application of rand omized resp onse to a latent Poiss on var iable denoting the true num b er of rule violations. Since self-protective resp onses result in an excess of observed zeros in relation to the Poiss on randomized resp onse d istribution, these are mod eled as observed zero-infl ation. The mo del in clud es p red ictors of the Po isson parameters, as wel l as predictors of the probabilit y of self-protectiv e resp onse behavior. 1. In tro d uction. In 2004 the Dutc h Departmen t of So cial Affairs con- ducted a nation w ide survey to assess the lev el of compliance with the Un- emplo yment Insurance Ac t. Under t his act emplo yee s wh o h a ve lost their income due to unemplo yment are en titled to financial b enefits, pro vided that they comply with the rules and regulations stipulated in the act. The participan ts in the survey w ere ask ed if they had ev er violated against the regulations in the y ear preceding the su rv ey . S ince the disclosure of a rule Received June 2007 ; revised S ep tember 2007. Key wor ds and phr ases. R andomized resp onse, Poisson regression, zero-inflation, self- protective responses, regulatory noncompliance. This is an electro nic repr int of the original ar ticle published by the Institute of Mathematical Statistics in The Annals of Applie d Statistics , 2008, V ol. 2 , No. 1, 31 6–331 . This r eprint differs from the original in pagina tio n and typogr aphic detail. 1 2 CRUYFF, B ¨ OCKENHOL T, V AN DEN HOUT A ND V A N DER HEIJDEN violatio n may h a ve serious financial consequences for the resp onden t, th e randomized r esp onse design wa s used. The randomized resp onse metho d wa s fi rst in tro duced in 1965 by W arner as an interview tec hnique that p rotects the resp onden ts’ p riv acy [ W arner ( 1965 )]. In W arn er’s design the resp ondent is pr esen ted w ith t wo comple- men tary statemen ts, for example “I am a marihuana u ser” and “I am not a marih uana user.” Th e resp ond en t then op erates a r andomizing device, like a pair of dice or a dec k of card s , and th e outcome of this device determines whic h of the t wo statemen ts the resp ond en ts has to answer. Sin ce only the resp ond en t kn o ws the outcome of the randomizing d evice, confidentiali t y is guaran teed. A m eta-analysis of randomized resp onse studies s ho ws that the rand om- ized r esp onse design generally yields higher and more v alid prev alence esti- mates of the sensitiv e charact eristic than direct-questioning designs [ Lensv elt-Mulders et al. ( 2005 )]. Ho wev er, a n u m b er of studies su ggest that resp ond en ts do not alw ays follo w the instructions of the r an d omized resp onse design. In an exp erimenta l randomized r esp onse design [ Edgell, Himmelfarb and Duncan ( 1982 )] w ith th e outcomes of the random- izing d evice fi xed in adv ance, ab out 25% of the resp ond en ts ans w ers no to a question ab out ha ving had h omosexual exp eriences, while according to the design these resp onden ts should h a ve answered yes . In another exp eri- men tal study [ v an der Heijden et al. ( 200 0 )] all resp ond en ts w er e kn o wn to ha ve offended aga inst so cial securit y regulations. Although the randomized resp onse cond ition yielded h igher estimates th an the direct question d esign, the p r ev alence estimate of offenders obtained with randomized resp onse was only ab out 50%. Another study inv olv ed an interview of participants in a randomized resp onse survey [ Bo eije and Lensvelt-M ulders ( 200 2 )]. Many of the participan ts in dicated that they had found it difficult to falsely incrimi- nate th emselv es when they were forced to d o so by the outcome of the dice. Some of them admitted th at in this situation they had giv en the n onincrim- inating answer in s tead. A recen t topic of in v estigation in the field of randomized resp ons e is the estimation of ev asiv e resp ons e bias. Clark an d Desharn ais ( 1998 ) sho w that the pr esence of ev asive resp onses can b e detected in a rand omized r esp onse design with tw o groups that eac h use a randomizing d evice with different outcome pr obabilities. Kim and W arde ( 2005 ) pr esen t a multinomial ran- domized resp onse mo del taking ev asiv e r esp onse b ias int o accoun t in designs with a sensitiv e qu estion with m ultiple resp onse categories that increase in sensitivit y . The term self-protection (SP) was introdu ced by B¨ oc k enholt and v an der Heijden ( 2004 , 2007 ) to d escrib e the resp onses by resp ond en ts w ho consisten tly giv e the ev asive answer, without taking the outcome of the ran- domizing d evice in to accoun t. According to this definition, the SP resp onse profile consists of nonincriminating (i.e., no ) resp onses only . The authors A ZIP MODEL FOR RA N DOMIZED RESPON S E DA T A 3 use mo dels fr om item resp onse theory to obtain prev alence estimates of the sensitiv e charac teristics corrected for SP . The SP assu mption is also u sed in log-linear r andomized resp onse mo dels that study the asso ciation pat- terns b et ween the sen s itiv e charac teristics and obtain prev alence estimates corrected for SP [ Cruyff, v an den Hout, v an der Heijden ( 2007 )]. The defin ition of SP imp lies that the probabilit y of an ev asive resp onse do es not explicitly dep end on the sensitivit y of the question or on the true status of the resp ondent. Although it is p ossible to form ulate more complex assumptions with resp ect to the generation of ev asive resp onse bias, SP seems to pr o vide an adequate description of th e pr o cess. A stu d y [ B¨ oc kenholt, Barlas an d v an d er Heijden ( 2008 )] mo d eling ev asive resp onse b ehavio r in randomized resp ons e as a fu n ction of b oth the sensitivit y of the question and the tr ue status of the resp ondent foun d no compelling evi- dence for the sup eriorit y of these mo dels in relation to the corresp onding SP m o dels. In this pap er we introdu ce a regression mo del that allo ws for SP in ran - domized r esp onse sum score data. The mo del assumes a Po isson distribu tion for the tru e s um score v ariable assessing the in dividual n umb er of sensitiv e c haracteristics. Th e mo del further assum es that the ob s erv ed su m score v ari- able d enoting the num b er of in criminating resp onses is p artly generated b y the r an d omized resp onse design, an d partly by SP . Since SP b y definition results in an observed sum score of zero, the distribu tion of the observe d sum score v ariable is zero-inflated with resp ect to the Poi sson rand omized resp onse distrib ution of the true sum score v ariable. The mo del allo w s f or predictors that explain ind ividual differences in the P oisson parameters, as w ell as p redictors that explain in d ividual d ifferences in th e probability of SP . Since the distribution of the observ ed su m score v ariable is a mixtur e of a P oisson r andomized resp onse distrib ution and obs erv ed zero-inflation, the mo del is called the zero-inflated Poisson ran d omized resp onse regression mo del. The mo del is applied to rand omized resp onse data f rom a social securit y surve y conducted in the Netherlands in 2004 . S ection 2 describ es the data. Section 3 deriv es the zero-inflated P oisson r egression mod el based as an extension of existing ran d omized resp onse mo dels for multinomia l and sum score d ata. The section also includes a description of a maxim u m likelihoo d (ML) estimation pro cedu re and an ev aluation of the v alidit y of the Poisson assumption with resp ect to the tru e sum score v ariable. The r esults for the so cial securit y data [Cruyff, Bck enh olt, v an d en Hout and v an der Heijden ( 2008b )] are p resen ted in Section 4 . Section 5 discusses some assum ptions and interpretations of the mod el. 2. The data. In 2004 the Department of So cial Affairs in the Nether- lands conducted a nation w ide su r v ey to assess the lev el of noncompliance 4 CRUYFF, B ¨ OCKENHOL T, V AN DEN HOUT A ND V A N DER HEIJDEN with the So cial Security La w [compare Lensve lt-Mulders et al. ( 2006 )]. The surve y includes 870 participan ts who receiv e financial b enefits und er the Unemplo yment Insuran ce Act (UIA). P ersons who ha v e b ecome (partially) unemplo y ed are eligible for b en efi ts. A b eneficiary receiv es ab out 70% of the last earned wag es, and th e d uration of the b enefits dep end on the length of the p ersons’ employmen t history . Beneficiaries are required to rep ort all activitie s that generate income in addition to their b enefits or that might conflict with reinteg ration into th e lab or m ark et. T he failure to rep ort su c h an activi t y may b e sanctioned. The so cial securit y sur v ey includes the follo wing fiv e qu estions assessing noncompliance w ith UIA regulations: 1. Ha ve y ou in the past 12 months eve r had a job or work ed for an emplo y- men t agency in add ition to your b enefit without in forming the Depart- men t of So cial S ervices? 2. Ha ve y ou in the past 12 mon ths ev er refused to accept a su itable job, or ha ve yo u ev er d elib erately made s ure you were not hired eve n th ough yo u had a c h ance of getting the job? 3. Ha ve y ou in the p ast 12 m on ths ev er delib erately p ut in an insuffi cien t n u m b er of job ap p lications for a sustained p erio d of time? 4. Ha ve you in the past 12 mon th s attended an y day courses withou t in- forming the Departmen t of So cial Services? 5. Ha ve you in the p ast 12 months had an y income in addition to yo ur b en- efit, for example, f rom alimony , a sc holarship, su bletting, other b enefits, gifts, in terest and so forth, without inform ing the Departmen t of So cial Services? Due to the sensitiv e nature of the questions, the randomized resp onse metho d is used. The resp on d en ts answer the questions with the u se of a computer according to the forced resp onse design [ Boruc h ( 1971 )]. Before ans wering the qu estion the resp onden t thro ws t w o virtual dice, and is instructed to an- sw er yes if the sum of the dice is 2 , 3 or 4, and to answer no if the sum of the dice is 11 or 12. If the sum of th e dice is 5 , 6 , 7 , 8 , 9 or 10, the resp on d en t has to answer the question truthfu lly . Th e misclassification probabilities, that are conditional on the tru e status of the resp ond en t, can b e derive d from the probabilit y distrib ution of the sum of t w o dice. Given regulatory noncom- pliance, the p robabilit y of a yes resp onse is 11 / 12 and that of no r esp onse 1 / 12. Giv en regulatory compliance, the pr obabilit y of a yes resp onse is 1 / 6 and th e probabilit y of a no resp onse 5 / 6. I n the actual so cial secur it y sur - v ey , how ev er, the programmer inadv er tently p rogrammed th e virtual dice so that th e probabilit y of a yes resp onse given regulatory non compliance w as 0 . 9329, and that of a yes r esp onse giv en regulatory compliance 0 . 18678. The n u m b er of observed yes resp onses to the five questions are resp ectiv ely 122, 195, 168, 207 and 274. Coun ting the total num b er of yes resp on s es A ZIP MODEL FOR RA N DOMIZED RESPON S E DA T A 5 for eac h r esp ondent on the five questions yields the frequ encies n 0 = 288, n 1 = 295, n 2 = 207, n 3 = 68, n 4 = 7 and n 5 = 5 (with the subscr ip t denoting the n umb er of observed yes resp onses). The so cial security su rve y includ es t wo kinds of predictors we like to explore, one concerning demographic v ariables and th e other concernin g v ariables r elated to the forced resp onse design. The demograph ic v ariables gender , age , ye ar unemployment , e duc ation and know le dge rules are used as predictors of regulatory noncompliance. The v ariables g e nder and age are dummy-coded with “male” ( n = 483) and “older than 26” ( n = 832) as re- sp ectiv e reference categorie s. The v ariable ye ar unemployment is a dummy v ariable denoting the last ye ar of b eing emplo yed, with the y ear 2004 as reference catego ry ( n = 257). Th e v ariable e duc ation (mean = 2 . 25 , sd = 0 . 67) measur es increasing leve ls of eduction. Th e v ariable know le dge rules (mean = 3 . 8 , sd = 0 . 90) denotes on a 5-p oint scale of the r esp ond ents’ gen- eral knowledge of th e social security r egulations. The t w o v ariables trust and understanding are related to the forced resp onse design and are used as predictors of S P . The v ariable trust (mean = 3 . 5 , sd = 0 . 92) is constru cted as the a ve rage score on four 5-p oint scale v ariables (Cron bac h’s Alph a = 0.87) assessing d ifferent asp ects of th e resp on d en ts’ b eliefs in the confi den tialit y and pr iv acy p rotection of the forced resp onse design. A high score on this v ariable corresp onds to a high d egree of trust. The v ariable understanding (mean = 4 . 2 , sd = 0 . 85) assesses on a 5-p oin t scale to what extent the resp on- den t feels that he un dersto o d wh en to answer yes and when to ans w er no to a forced r esp onse question. High scores corresp ond to a go o d u n derstanding of th e forced resp ons e design. Figure 1 depicts the asso ciations b et w een the observ ed sum scores and the predictors. A t this p oint we wo uld lik e to emp hasize that the plots should not b e int erpreted as depicting asso ciations b et w een the p redictors and the true sum scores (i.e., the num b er of rule violations), since the obs er ved sum scores are not corrected for the misclassification due to ran d omized resp onse, nor for SP . The p lots at the top of the figure sho w the observ ed su m score p rop ortion conditional on the categories within the dummy v ariables gender , age and ye ar unemployment . The profiles of males and f emales lo ok similar. The plot for age sh o ws that the pr op ortion of zeros f or the younger resp ond en ts (ab out 15%) is ab out half that of the older resp onden ts. The y oun ger resp ondents also ha v e a relativ ely high pr op ortion of ones (ab out 45%). The profiles within ye ar unemployment are again relativ ely similar, although p ersons w ho b ecame un emp lo ye d in 2004 h a ve a higher p ercen tage of zero resp on s e (ab out 40%) compared to the resp ondents wh o b ecame unemplo y ed b efore 2004 ( 30%). T he four p lots at the b ottom show the mean predictor scores w ith in the observed s um scores for the resp ectiv e con tinuous v ariables e duc ation , know le dge rules , trust and understanding . Th e p redictor means do not show any clear linear asso ciations with the observed sum score, 6 CRUYFF, B ¨ OCKENHOL T, V AN DEN HOUT A ND V A N DER HEIJDEN Fig. 1. Observe d sum sc or e pr op ortion given the c ate gories within the dum m y variables gender, age and ye ar unemployment ( upp er plots ) , and me an pr e dictor sc or e within ob- serve d sum sc or e f or the c ontinuous variables e duc ation, know l e dge rules, trust and under- standing ( lower plots ) . although for the v ariable know le dge rules the means seem to slightly d ecrease with increasing su m scores. The effect of sum score is most pronoun ced on the means of the predictor trust , b ut the asso ciation p attern is erratic. 3. The mo d el. 3.1. The multinomial r andomize d r esp onse mo del. Consider a random- ized resp onse design with M sensitiv e qu estions, eac h assessing the presence or absence of a sensitiv e c haracteristic. Let the random v ariable Y ∗ m denote the observed resp onse to the m th qu estion, with y ∗ m ∈ { 0 ≡ no, 1 ≡ yes } and m ∈ { 1 , . . . , M } . Similarly , let Y m denote the true s tatus w ith r esp ect to the sensitiv e charac teristic, with y m ∈ { 0 ≡ absent , 1 ≡ p resen t } . Th e binomial randomized r esp onse mo d el for the b inary v ariable Y ∗ m is giv en b y P ( Y ∗ m = y ∗ m ) = 1 X y m =0 p y ∗ m | y m π y m , (1) where π y m = P ( Y m = y m ) and p y ∗ m | y m = P ( Y ∗ m = y ∗ m | Y m = y m ) are the cond i- tional misclassification probabilities that can b e derived from the probability A ZIP MODEL FOR RA N DOMIZED RESPON S E DA T A 7 distribution of the rand omizing device. F or a more detailed d iscussion of this mo del, w e refer to Chaudhuri and Muk erjee ( 1988 ). Next consider the tru e s um score of the M sensitive characte r istics, de- noted b y the v ariable S = M X m =1 Y m . (2) If S follo ws a m u ltinomial d istribution with p arameters π 0 , . . . , π M , then the m u ltinomial randomized resp onse mo del P ( S ∗ = s ∗ ) = M X s =0 q s ∗ | s π s , (3) applies, wher e S ∗ denotes the n u m b er of observe d yes r esp onses on th e M sensitiv e questions and q s ∗ | s = P ( S ∗ = s ∗ | S = s ), f or s, s ∗ ∈ { 0 , . . . , M } . The misclassification probab ilities q s ∗ | s , that exist if and only if the p y ∗ m | y m are th e same for all m , can b e derive d as the m ultinomial probabilities q s | t = t X j =0 t j M − t s + j − t p t − j 1 | 1 p j 0 | 1 p s + j − t 1 | 0 p M − s − j 0 | 0 , (4) for s , t ∈ { 0 , 1 , . . . , M } and t ≤ s + j ≤ M [ Cruyff, v an den Hout, v an der Heijden ( 2008 b )]. As an illustration, consider the forced r esp onse design of the s o cial securit y surve y w ith tw o bin ary v ariables Y 1 and Y 2 . App lication of ( 4 ) f or M = 2 yields the misclassification probabilities q s ∗ | s : q 0 | 0 q 0 | 1 q 0 | 2 q 1 | 0 q 1 | 1 q 1 | 2 q 2 | 0 q 2 | 1 q 2 | 2 = p 2 0 | 0 p 0 | 0 p 0 | 1 p 2 0 | 1 2 p 0 | 0 p 1 | 0 p 1 | 0 p 0 | 1 + p 0 | 0 p 1 | 1 2 p 0 | 1 p 1 | 1 p 2 1 | 0 p 1 | 0 p 1 | 1 p 2 1 | 1 . 3.2. The Poisson r andomize d r esp onse mo del. Assume that the true sum score S is generated by a Po isson pro cess w ith parameter λ . S ince r ealiza- tions of S are limited to the m axim um v alue of M , the P oisson distribution of S is truncated at the righ t [ Cameron and T riv edi ( 1998 )], so that P ( S = s | s ≤ M ) = π s P M s =0 π s , (5) with π s = exp( − λ ) λ s s ! . (6) 8 CRUYFF, B ¨ OCKENHOL T, V AN DEN HOUT A ND V A N DER HEIJDEN Substitution of the multinomial probabilities π s in mo del ( 3 ) for the ex- pression at the righ t-hand side of ( 5 ), with π s defined as in ( 6 ), yields the (righ t-trun cated) P oisson randomized resp onse mo d el P ( S ∗ = s ∗ | s ∗ , s ≤ M ) = M X s =0 q s ∗ | s π s P M s =0 π s . (7) 3.3. The zer o-inflate d r andomize d r e sp onse r e gr ession mo del. Coun t data are often c h aracterized by an excess of zeros relativ e to a Poisso n d istribu- tion. T o accoun t for the excess of zeros, Lam b ert ( 1992 ) in tro d uced the zero-inflated P oisson (ZIP) mo del P ( S = s ) = (1 − θ ) π s + I θ , (8) with S ∈ { 0 , 1 , 2 , . . . } , π s defined as in ( 6 ), and I an ind icator v ariable taking on v alue 1 if S = 0, and 0 otherwise. The parameter θ denotes the probabilit y of an excess zero in th e observ ed counts, that is, a zero count that is n ot generated b y the Poisson pr o cess. No w su pp ose that in the cont ext of randomized resp onse the true sum score v ariable S is generated by a Poisson pr o cess. In the abs ence of SP the observ ed sum score v ariable S ∗ is en tirely generated b y the P oisson randomized resp on s e pr o cess. In th e presence of SP , ho wev er, S ∗ is generated partly by the P oisson rand omized resp onse pr o cess and partly by SP . Let the parameter θ ∗ denote the p robabilit y that the observed su m score is generated b y SP , and let 1 − θ ∗ denote th e probability that the observed sum score is generated by a Poi sson rand omized resp onse pro cess. The distribution of S ∗ is then giv en by P ( S ∗ = s ∗ | s ∗ , s ≤ M ) = (1 − θ ∗ ) M X s =0 q s ∗ | s π s P M s =0 π s + I ∗ θ ∗ , (9) where I ∗ is an ind icator v ariable taking on the v alue 1 if S ∗ = 0, and 0 otherwise. Both parameters λ and θ ∗ in ( 9 ) can b e mo deled as a function of predic- tors. Let v ariable S i denote the true s u m of sensitiv e charac teristics of indi- vidual i , f or i ∈ { 1 , . . . , n } , and let x i = ( x i 0 , . . . , x ik ) ′ and z i = ( z i 0 , . . . , z il ) ′ b e v ectors that ma y or may not con tain the same pred ictors. Let the Po isson parameter of individ ual i dep end on x i according to λ i = exp( x ′ i β ) , (10) and let the probabilit y of zero-inflation dep end on z i according to θ ∗ i = exp( z ′ i γ ) 1 + exp( z ′ i γ ) , (11) A ZIP MODEL FOR RA N DOMIZED RESPON S E DA T A 9 where β = ( β 0 , . . . , β k ) ′ and γ = ( γ 0 , . . . , γ l ) ′ are parameter v ectors. The ZIP randomized r esp onse regression mo del is giv en b y P ( S ∗ i = s ∗ i | s ∗ i , s i ≤ M , x i , z i ) = (1 − θ ∗ i ) M X s i =0 q s ∗ i | s i π s i P M s i =0 π s i + I ∗ θ ∗ i , (12) where π s i = exp( − λ i ) λ s i i /s i !. 3.4. Estimation. The ZIP randomized resp onse regression mod el ( 12 ) (as w ell as th e other mo d els presented in this s ection) can b e estimated b y maximizing the k ernel of the observ ed-data log-lik eliho o d ln ℓ ∗ ( β , γ | s ∗ , X , Z ) (13) = n X i =1 ln (1 − θ ∗ i ) M X s i =0 q s ∗ i | s i π s i P M s i =0 π s i + I ∗ θ ∗ i ! , with resp ect to the p arameters β and γ . W e ha ve written co de for the q u asi Newton–Raphson pr o cedure QNewtonm t of the statistical softw are pr ogram GA USS to estimate the mo del parameters. T he p ro cedure uses the BFGS metho d with numerically computed gradient s and Hessian matrix, an d stan- dard errors are obtained fr om the inv ers e of the estimated Hessian. Con v er- gence is generally f ast, but d u e to m ac hine imprecision problems m a y b e encoun tered with the in version of the Hessian. The use of sligh tly different starting v alues us u ally solves this p roblem. The observ ed-data likeli ho o d is con vex and unimo d al when ev aluated as a fu nction of the parameters θ and λ . Figure 2 shows the sh ap e like liho o d fun ction for the ZIP randomized resp onse mo del 9 giv en the s o cial securit y data. T h is mo del d o es n ot in- clude an y p redictors for the p arameters λ and θ , and the likeli ho o d function is ev aluated for the S P parameter θ ∈ (0 , 0 . 25) and the Poisson p arameter λ ∈ (0 . 25 , 0 . 75). 3.5. The Poisson assumption. It is a well known statistica l resu lt that for M ≫ 1, π ≪ 1 and M π ≈ 1, the distribu tion of the sum of M i.i.d. Bernoulli v ariables w ith success probabilit y π is approximate d by a P oisson distri- bution with p arameter λ = M π . The P oisson randomized r esp onse mo dels present ed in this p ap er are based on the assu mption that the five rand omized resp onse v ariables Y m are Bernoulli v ariables and th at the su m of these v ari- ables follo ws a P oisson distribu tion with parameter λ = P M m =1 π 1 m , wh er e π 1 m denotes the su ccess p robabilit y of v ariable Y m (i.e., the pr ev alence of the sensitiv e c h aracteristic). In this section we ev aluate the v alidity of this assumption, giv en that in our example M is relativ ely small and that the success probabilities π 1 m are not iden tical for differen t m . 10 CRUYFF, B ¨ OCKENHOL T, V AN DEN HOUT A ND V A N DER HEIJDEN Fig. 2. Likeliho o d f unction for the ZIP r andomize d r esp onse mo del evaluate d f or the SP p ar ameter θ ∗ ∈ (0 , 0 . 25) and the Poisson p ar ameter λ ∈ (0 . 25 , 0 . 75 ) . T able 1 0 1 2 3 4 5 Exact d istribu tion 0.7250 0.2498 0.0244 0.0008 0.0000 0.0000 P oisson approximation 0.740 1 0.2228 0.0335 0.0033 0.0002 0.0000 T o ev aluate the adequacy of the P oisson assu mption, we firs t deriv e the exact distribution of the sum of fiv e in d ep endent Bernoulli v ariables with success p robabilities equal to th e prev alence estimates b π 1 m of the fiv e v ariables Y m of the so cial security surve y . The prev alence estimates ob- tained with the multinomial randomized resp onse mo del ( 1 ) are b π 1 1 < 0 . 001, b π 1 2 = 0 . 050, b π 1 3 = 0 . 009, b π 1 4 = 0 . 069 and b π 1 1 = 0 . 172, with b π 1 1 set equal to 0 . 001. W e th en approximat e this distribu tion by a P oisson distribu tion with λ = P 5 m =1 b π 1 m = 0 . 301. T he tw o d istributions are shown in the T able 1 . The P oisson appro ximation assigns more mass to the zero count an d to coun ts larger th an 2, and thus o v er estimates the true v ariance. It underes- timates the probabilit y of count 1 b y 0 . 0270, wh ich corresp onds to a r ela- tiv e differen ce of ap p ro ximately 11%. In view of the fact that the abs olute deviations in probabilit y of the remaining counts are smaller, th e P oisson appro ximation seems satisfactory for all practical purp oses. A ZIP MODEL FOR RA N DOMIZED RESPON S E DA T A 11 4. Analysis of the so cial securit y data. T able 2 presents fit indices f or the m u ltinomial randomized r esp onse mo d el ( M ), the P oisson randomized re- sp onse mo del ( P ), the ZIP randomized resp onse n ull-mo del ( Z 0 ), the mo del Z β including the five demographic predictors of the Poisso n parameter, an d the full mo del Z γ ,β with the add itional t wo pr edictors of SP . The table rep orts the loglik eliho o d, th e Ak aik e Information Criterion (AIC) giv en by 2 k − 2 ln ℓ ∗ , the Ba yesian Information Criterion (BIC) giv en b y k ln n − 2 ln ℓ ∗ , with ln ℓ ∗ the maximized loglik eliho o d an d k th e num b er of indep endentl y es- timated parameters. F or the m o dels without pred ictors, w e present the Pea r- son c hi-square statistic X 2 with d f = M − k , where M denotes the n umb er of indep end en tly observ ed sum s core frequencies. The last column of T able 2 present s the SP probabilit y estimates b θ ∗ = ( P n i =1 I ( S ∗ i =0) ) − 1 P n i =1 I ( S ∗ i =0) b θ i for the three ZIP mo dels. Although mo del M is saturated, the fitted resp onse frequencies b n 0 = 272 . 0, b n 1 = 319 . 1, b n 2 = 195 . 3, b n 3 = 66 . 7, b n 4 = 12 . 6, b n 5 = 4 . 3 do not equ al the corresp ondin g observed resp onse fr equ encies. T he fact that X 2 is nonzero with zero d egrees of freedom in dicates that one or more of the estimates are on th e b oun dary of the parameter space [ v an den Hout and v an der Heijden ( 2002 )]. The exp ected distribution of the true su m score v ariable S is b π ( M ) = (0 . 878 , 0 . 000 , 0 . 116 , 0 . 000 , 0 . 000 , 0 . 006) , with (near) zero-probability estimates for one, thr ee and four rule violations. An int eresting result is that the pr obabilit y estimate of 0 . 6% for fi ve ru le violatio ns is inconsisten t with the fact the smallest u n iv ariate pr ev alence estimate of regulatory noncompliance is only 0 . 1% (see Section 3.5 ). Mo del P clearly do es not fit well, ind icating that for our application the P oisson assumption d o es not hold. S P is in tr o duced in mo del Z 0 with an estimated probability of 12 . 6%. This mo del fits substan tially b etter and is the b est m o del in terms of BIC. The P earson c h i-squ are of 19 . 6 with 4 degrees of freedom, ho w ever, indicates lac k of fit. Th e fitted f requencies b n 0 = 287 . 2, b n 1 = 298 . 9, b n 2 = 199 . 5, b n 3 = 70 . 1, b n 4 = 13 . 3 an d b n 5 = 1 . 1 sh o w T able 2 L o glikeliho o ds, AI C ’ s, BIC ’ s and Pe arson X 2 statistics, and SP estimates b θ ∗ Mod el Loglik. AIC BIC k X 2 d f b θ ∗ M Multinomial − 1170.8 2351.6 2375.4 5 6.1 0 – P P oisson − 1183.3 2368.6 2373.4 1 56.0 5 – Z 0 ZIP (null) − 1173.2 2350.5 2360.0 2 19.6 4 0.126 Z β ZIP (in cl. β ) − 1167.0 2348.1 2381. 5 7 – – 0.124 Z γ ,β ZIP (full) − 1165.0 2348.0 2391.0 9 – – 0.121 12 CRUYFF, B ¨ OCKENHOL T, V AN DEN HOUT A ND V A N DER HEIJDEN that the lac k of fit is primarily du e to the u nderestimation of n 5 , this cell con tribu tes ab out 80% (14.6) to th e total X 2 v alue. In terms of AIC the mo dels Z β and Z γ ,β fit b est. Both mo dels estimate th e SP p robabilit y a little ab o ve 12%. T he b est mod el is Z γ ,β , w ith the marginal distribution of the fitted v alues of S i giv en by b π ( Z γ ,β ) = (0 . 6 57 , 0 . 267 , 0 . 063 , 0 . 011 , 0 . 002 , 0 . 000) . The AIC and BIC disagree with resp ect to mo del c hoice. Since rand omized resp onse r equires muc h larger samples than direct question d esigns and the BIC punish es for sample size, w e f eel that the BIC m igh t b e to o conserv ative . Therefore, we p refer the mo del with the lo west AIC, whic h is Z γ ,β . This c hoice is further motiv ated by the fact that the AIC decreases to 2343.4 when the fou r n onsignifican t regression parameters in this mo del (see T able 3 ) are s et to zero. In this case the BIC b ecomes 2367. 2, so that according to this cr iterion, Z 0 remains the pr eferred mo del. Th e disagreemen t b et wee n the t w o criteria ind icates that the evidence for the effects of the predictors in mo del Z γ ,β is not strong. T able 3 present s the parameter estimates of the p r edictors in mo del Z γ ,β . The upp er part of the table sho w s the resu lts for the predictors in th e v ec- tor x . Th e last column rep orts the effect size exp( b β ), expressing the r elativ e c hange in the P oisson parameter f or a unit c h an ge in the predictor. (F or con- tin u ou s v ariables, the standardized effect size can b e computed by raising the r ep orted effect size to the p o wer of th e standard deviation of the p re- dictor.) Th e v ariables ye ar unemploye d and know le dge rules are significant predictors of th e Poisson parameter. Regulatory noncompliance in creases af- ter the first y ear of u nemplo ym en t; the estimated num b er of rule v iolations for a p erson u nemplo yed longer than 1 year is 1 . 78 times that of a p ers on unemplo y ed less than 1 y ear. Better kno wledge of the rules is asso ciated with lo wer lev els of regulatory noncompliance; the standardized effect size of 0 . 78 d enotes the factor c h an ge in th e P oisson parameter f or eac h standard deviation increase in the score on know le dge rules (sd = 0 . 90). The lo wer p art of T able 3 rep orts the p arameter estimates for the predic- tors in the vecto r z . The last column rep orts the effect size exp( b γ ), whic h expresses the relativ e c hange in the od ds of S P for a u nit c hange in th e predictor. Th e parameter estimate for the v ariable understanding is signif- ican t. Better und erstanding of the forced resp onse metho d results in less self-protectiv e r esp onses; the stand ardized effect indicates that the o dd s of SP decrease b y appr o ximately tw o-thirds (0 . 67) for eac h s tand ard deviation increase in the score of understanding (sd = 0 . 85). In ord er to assess the fit of m o del Z γ ,β more closely , w e ev aluate the corre- sp ond en ce b et wee n the observ ed and fitted frequencies within the resp onse catego ries of eac h the predictor v ariables. Figure 3 p lots the Pearson resid- uals ( n s ∗ x j k − b n s ∗ x j k ) / q b n s ∗ x j k , with n s ∗ x j k denoting the observe d frequency A ZIP MODEL FOR RA N DOMIZED RESPON S E DA T A 13 T able 3 Par ameter estimates, standar d err ors (se) , t -values and effe ct sizes for mo del Z γ ,β Predictors in x b β (se) t -v al. exp( b β ) Constan t − 0.13 (0.38) − 0.32 – Gender ( female) 0.21 (0.22) 0.95 1.23 Age ( < 26) 0.50 (0.36) 1.39 1.65 Education 0.19 (0.18) 1.07 1.21 Y ear unemploymen t ( < 2004) 0.58 ( 0.29) 1.97 1.78 Knowl edge rules − 0.27 (0.12) − 2.34 0.76 Predictors in z b γ (se) t -v al. exp( b γ ) Constan t − 0.64 (1.04) − 0.61 – T rust 0.14 (0.33) 0.43 1.15 Understanding − 0.46 (0.23) − 1.99 0.63 of p ersons with sum score s ∗ and score k on predictor j , and b n s ∗ x j k denot- ing the corresp onding fitted fr equency . Because of the lo w fr equencies of th e observ ed su m scores 4 ( n = 7) and 5 ( n = 5), these t w o categories h a ve b een collapsed in to the s in gle su m score category 4 / 5. The u pp er thr ee plots of Figure 3 d o not sho w systematic patterns or outliers for the dummy v ariables. O nly the catego ry of resp ondents younger than 27 with sum score zero shows a mo derately large (negativ e) residual, in- dicating that this group is sligh tly o verestimate d. The remaining four plots in the low er part of Figure 3 s h o w large residu als for the p redictor trust . The plot shows und erestimation of r esp ondents wh o ha ve n o trust in the randomized r esp onse design and wh o ha ve an observe d sum score of either zero or four or five, with an exceptionally large residual in the latter cate- gory ( n = 3). Since the com bination of no tr u st in the ran d omized resp onse design an d yes resp onses to (almost) all sensitive questions is somewhat coun terintuitiv e, it su ggests the pr esence of a resp onse mec hanism opp osite to th at of S P ; it may b e the case that there are (a few) resp ond en ts who do not trust rand omized resp onse and who th erefore (almost) alw a ys answ er yes , irresp ectiv e of the outcome of dice. Although th is is only a ten tativ e explanation for the large residual, it would b e in teresting to see whether a similar resp onse mec h anism could also b e detected in other randomized resp onse applications. The results present ed in this section sho w evidence for the p resence of S P in the d ata; the mo dels with the SP p arameter fit b etter th an the other mo d- els. The degree of f reedom n eeded to estimate the S P parameter is gained by the P oisson assumption for the su m scores of regulatory noncompliance. In this application the P oisson mo dels fit th e data w ell, except for the under- estimation of th e fi v e cases with an observ ed sum score 5. F urther researc h is needed to explore the nature of this misfi t. 14 CRUYFF, B ¨ OCKENHOL T, V AN DEN HOUT A ND V A N DER HEIJDEN Fig. 3. Pe arson r esiduals given pr e dictor sc or e and observe d sum sc or e (with sum sc or es 4 and 5 c ol lapse d into single c ate gory). 5. Discussion. In this p ap er we in tro duce a zero-inflated Poisson regres- sion mo del for the analysis of randomized resp onse sum score d ata. The cen tral assumption u nderlying the mo del is that the true su m score v ari- able follo ws a P oisson distribution, and th at th e pr esence of SP results in a zero-inflated d istribution of the observed sum score v ariable. W e present an example with a rand omized resp ons e su m score v ariable assessing non- compliance w ith so cial securit y regulations. The ZIP r an d omized resp onse mo del is used to fi nd (1) th e probabilit y distribution of regulatory noncom- pliance, (2) the probability of S P , (3) significant p r edictors of regulatory noncompliance and (4) significan t predictors of SP . F rom a su bstan tiv e p oint of view, the ZIP r andomized resp onse regres- sion m o del yields some in teresting resu lts. F or officials at the Departmen t of So cial Affaires, the negativ e effect of rule kn o wledge on regulatory non- compliance, suggesting that noncompliance is to a certain extent d ue to ignorance, may b e of assistance in the formulat ion of new p olicies. Th e negativ e asso ciation b et ween un d erstanding of the forced resp onse design and the probability of SP is esp ecially in teresting to social scien tists in- terested in randomized resp onse metho d . This resu lt, that coincides with A ZIP MODEL FOR RA N DOMIZED RESPON S E DA T A 15 the conclusions of a study of psyc h ologica l asp ects of randomized r esp onse [ Landsheer, v an der Heijden and v an Gils ( 1999 )], s uggests that adjus tments in the in structions that w ould help the resp onden ts to b etter und erstand the forced r esp onse d esign ma y reduce resp onse bias an d thereby enhance the v alidity of the resp onses. The central assum ption of the mo del that the true su m s core v ariable is generated by a Poisson pro cess is q u estionable sin ce (1) the num b er of Bernoulli (i.e., binary ran d omized resp ons e) v ariables making up th e ran- domized r esp onse sum score v ariable is limited and (2) the success p r oba- bilities (i.e., the prev alence of the sensitive c haracteristics) are not identi cal. Based on the un iv ariate p rev alence estimates, we demonstrate that in our example the P oisson appr o ximation is satisfactory . An ev aluation study w ith manipulation of the num b ers of Bernoulli v ariables and of success pr obabil- ities (not rep orted here) shows that the qualit y of P oisson app ro ximation is most affected if one (or more) of the success pr obabilities b ecomes larger. This fi nding is corrob orated by the more f ormal resu lt of Serfling ( 1978 ) that the absolute deviations b et wee n a series of Bernoulli v ariables with d ifferen t success pr obabilities and its Poisson appro ximation incr ease as a fu nction of the squ ared success probabilities. Although it is d ifficult to giv e exact figures, we feel th at th e P oisson assumption is ju stified as long as th e prev a- lence estimates of the binary randomized resp onse v ariables do not exceed 0 . 25. Since randomized resp onse deals with sensitiv e c h aracteristics that are rare b y definition, the risk of this happ enin g should b e small. SUPPLEMENT AR Y MA TERIAL The so cial securit y s urv ey d ata (doi: 10.121 4/07-A OAS135 S UPP ; .p df ). The su rv ey w as conducted in 2004 b y th e Dutch Departmen t of S o cial Af- faires amongst 870 so cial securit y b eneficiaries. The data con tain the r e- sp onses to fiv e randomized resp onse items assessing n oncompliance with so cial securit y regulations, and sev en backg round v ariables. REFERENCES B ¨ ockenhol t, U. and v an d er Heij den, P. G. M . (2004). Measuring noncompliance in insurance b enefit regulations with randomized resp onse metho ds for multiple items. In Pr o c e e dings of the 19th International Workshop on Statistic al Mo del ling (A. Biggeri, E. Dreassi, C. Lagazio and M. Marchi, eds.) 106–110. Florence, Italy . B ¨ ockenhol t, U. and v an der Heij den, P. G. M. (2007). Item randomized-response mod els for measuring noncompliance: Risk-return p erceptions, social in fl uences, and self-protectiv e resp on ses. Psychometrika 72 245–262. B ¨ ockenhol t, U., Barlas, S. and v an der He ijden, P. G. M. (2008). Do randomized- response designs eliminate resp onse biases? A n empirical study of non compliance b e- havior. J. Appl. Ec onometrics . T o app ear. 16 CRUYFF, B ¨ OCKENHOL T, V AN DEN HOUT A ND V A N DER HEIJDEN Boeije, H. and Le nsvel t-Muld ers, G. J. L. M. (2002). H onest by chance: A q ualita- tive interview study to clarify resp ondents’ (non)-compliance with computer-assisted randomized resp onse. Bul l. Metho dol. So c. 75 24–39. Boruch, R. F. (1971). Assuring confidentialit y of resp onses in social research: A note on strategies. Americ an So ci olo gist 6 308–311. Clark, S. J. and Desha rnais, R. A. (1998). Honest answers to embarrassing qu estions: Detecting cheating in t he randomized resp onse model So ciolo gic al Metho ds and R ese ar ch 11 89–110. Cameron, A . C. and Trivedi , P. K. (1998). R e gr ession Analysis of Count Data . Econo- metric So ciety Monographs 30 . Cam bridge Un iv. Press. MR1648274 Chaudhuri, A. and M ukerjee, R. (1988). Ra ndomize d R esp onse. Statistics: T extb o oks and Monographs 85 . Dekker, New Y ork. MR0933555 Cruyff, M. J. L. F., v an den Hout, A., v an de r Heijden , P. G. M. and B ¨ ockenhol t, U. (2007). Log-linear rand omized-resp onse mo dels taking self-protective resp onse b e- havior into account. So ciolo gic al M etho ds R ese ar ch . 36 266–282. Cruyff, M. J. L. F., v an den Hout, A. and v an de r Heijde n, P. G. M. (2008a). The analysis of randomized-resp onse sum score va riables. T o app ear. Cruyff, M. J. L. F., B ¨ ockenhol t, U., v an de n H out, A. and v an der Hei jden, P. G. M. (2008b). Supplement to “Accounting for self-protective resp onses in randomized response d ata from a so cial security survey using the zero-infl ated Poisson mod el.” DOI: 10.1214/07-A OAS135SUPP . Edgell, S. E., Himmelf arb, S . and Duncan , K. L. (1982). V alidity of forced resp onse in a randomized resp onse mo del. So ciol o gic al Metho ds R ese ar ch 11 89–110. Kim, J.-M. and W ard e, W. D. (2005). Some new results on the multinomial randomized response model. Comm. Statist. The ory Metho ds 34 847–856. MR 2163090 Lamber t, D. (1992). Zero-inflated Poisso n regression, with an application to defects in manufa cturing. T e chnometrics 34 1–14. Landsheer, J. A., v an der H eijden, P. G. M. and v an G ils, G. (1999). T rust and understanding, tw o psychological asp ects of rand omized resp onse. Quality Q uantity 33 1–12. Lensvel t-Mulders, G. J. L. M., Hox, J. J., v an de r Heijd en, P. G . M . and Maas, C. J . M. (2005). Meta-analysis of randomized respon se researc h, thirty-five years of v alidation. So ciolo gic al Metho ds R ese ar ch 33 319–348. MR2086452 Lensvel t-Mulders, G . J. L. M., v an d er Heijd en, P. G. M., La udy, O. and v an Gils, G. (2006). A va lidation of a computer-assisted rand omized-resp on se survey to estimate t h e prev alence of fraud in so cial security . J. R oy. Statist. So c. Ser. A 169 305–318 . MR2225545 Serfling, R. J. (1978). Some elementary results on Poi sson approximation in a sequence of Bernoulli trials. SIAM Re v. 20 567–579. MR0482958 v an d er Heij den, P. G . M., V an Gils, G., Bouts, J. and Hox, J. (2000). A compar- ison of randomized resp onse, computer-assisted self-in terv iew and face-to-face direct- questioning. So ci ol o gic al Metho ds R ese ar ch 28 505–537. v an den Hout, A. and v an der Hei jden, P. G . M . (2002). The analysis of multiv ariate misclassified data with sp ecial attention to randomized resp onse. So ci olo gic al Metho ds R ese ar ch 32 384–410. W arner, S. L. (1965). Randomized resp onse: A survey technique for eliminating answer bias. J. Amer. Statist. Asso c. 60 63–69. A ZIP MODEL FOR RA N DOMIZED RESPON S E DA T A 17 M. J. L. F. Cruyff P. G. M. v a n der Heijden Dep ar tment of Methodology and St a tistics Utrecht University 3508 Utrecht The Netherlands E-mail: m.cruyff@uu.nl p.g.m.v anderheijden@uu.nl U. B ¨ ockenhol t Dep ar tment of Marketing McGill University Montreal Canada E-mail: ulf.b o c k enholt@mcgill.ca A. v an den Hout MRC Biost a tistics Unit Cambridge United Kingdom E-mail: ardo.v andenhout@mrc-bsu.cam.ac.uk
Original Paper
Loading high-quality paper...
Comments & Academic Discussion
Loading comments...
Leave a Comment