A statistical framework for testing functional categories in microarray data
Ready access to emerging databases of gene annotation and functional pathways has shifted assessments of differential expression in DNA microarray studies from single genes to groups of genes with shared biological function. This paper takes a critic…
Authors: William T. Barry, Andrew B. Nobel, Fred A. Wright
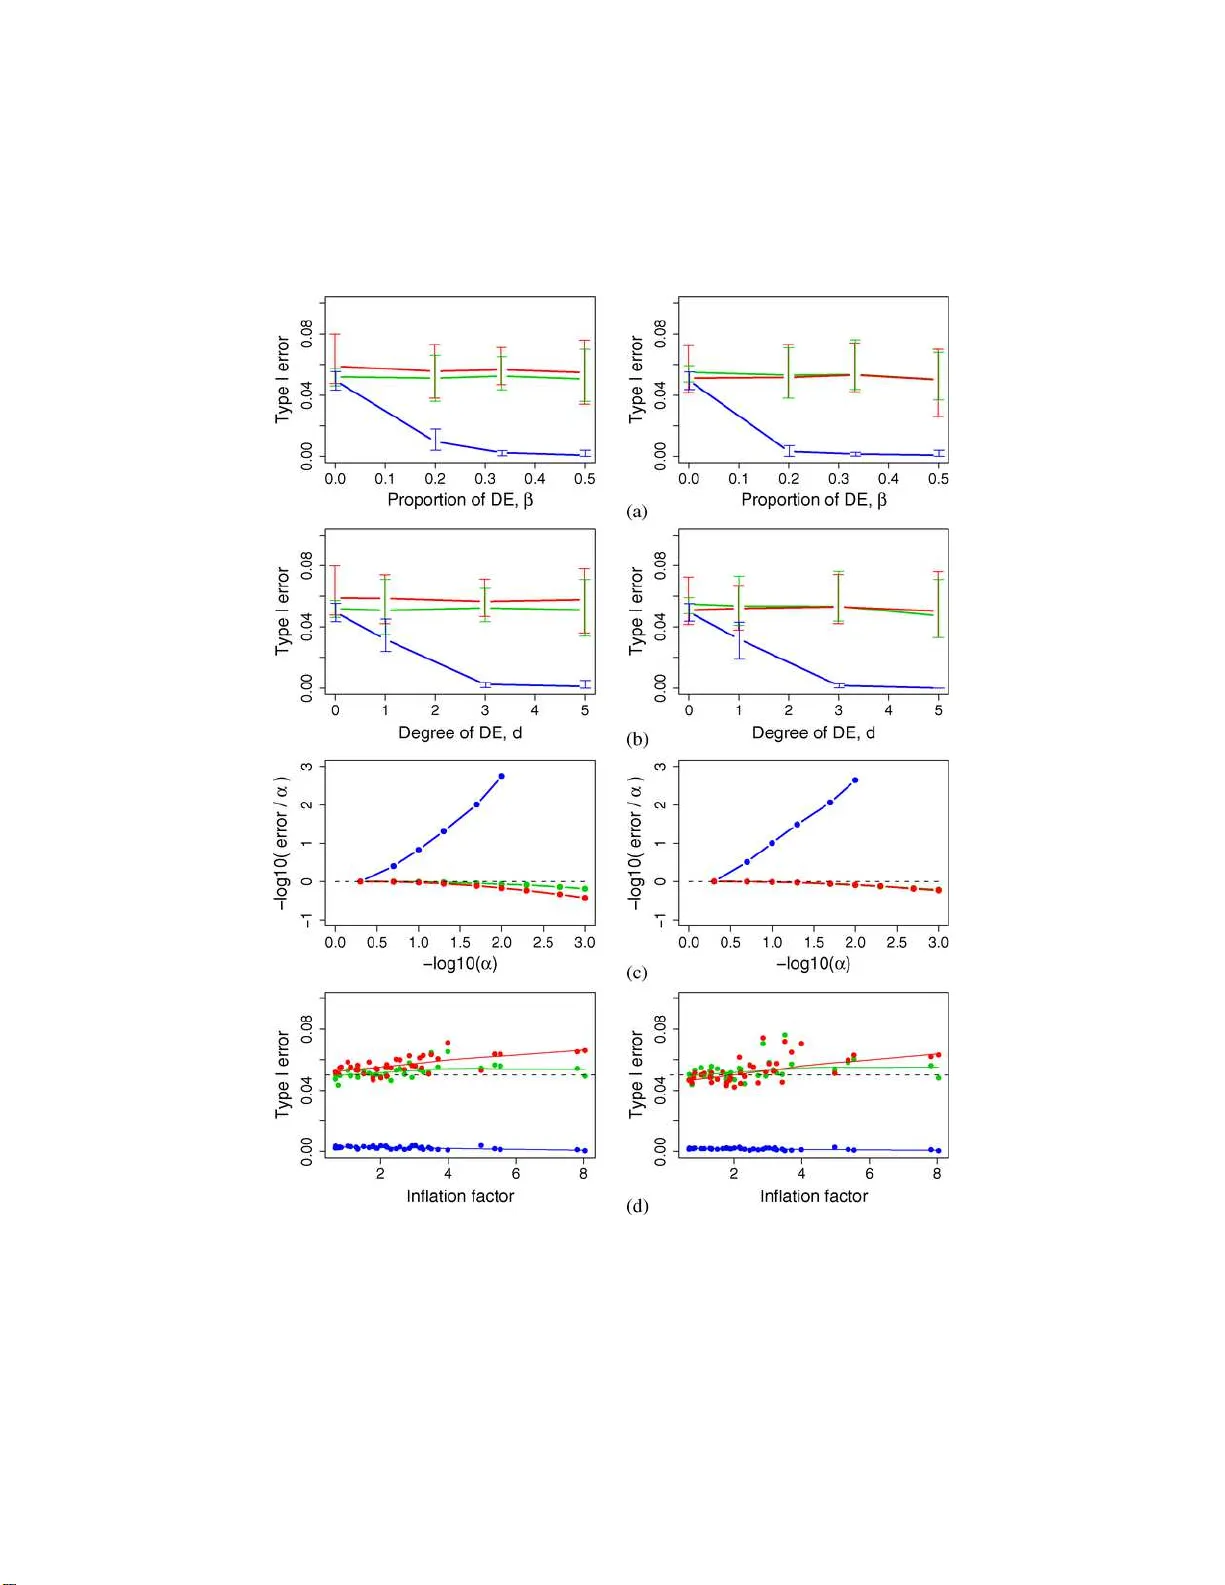
The Annals of Applie d Statistics 2008, V ol. 2, No. 1, 286–315 DOI: 10.1214 /07-A OAS146 c Institute of Mathematical Statistics , 2 008 A ST A TISTICAL FRAMEW ORK F OR TESTING FUNCTIONAL CA TEGORIES IN MICR O ARRA Y D A T A By William T. Barr y, Andrew B. Nobel and Fred A. Wright Duke University Me dic al Center , U niversity of N orth Car olina and University of North Car olina Ready access to emerging databases of gene annotation and func- tional pathw ays has shifted assessmen ts of differential ex p ression in DNA microarra y studies from single genes to groups of genes with shared biologica l function. This p aper takes a critical look at exist- ing metho ds for assessing t he differential expression of a group of genes (funct ional category), and provides some suggestions for im- prov ed p erformance. W e b egin by p resenting a general framew ork, in whic h the set of genes in a functional category is compared to the complemen tary set of genes on th e array . The framew ork includes tests for over representa tion of a category within a list of significant genes, and me tho ds that consider contin uous measures of differential expression. Existing tests are d ivided into tw o classes. Class 1 tests assume gene-sp ecific measures of differential expression are indep en- dent, despite o verw helming eviden ce of p ositive correlation. Analytic and sim ulated results are presented that demonstrate Class 1 tests are strongly anti-conserv ativ e in practice. Class 2 tests account for gene correlation, typicall y through arra y p ermutation that b y construction has prop er Type I error con trol for the indu ced null. How ever, b oth Class 1 and Class 2 tests use a null hyp othesis th at all genes hav e the same degree of differential ex p ression. W e introduce a more sensible and general (Class 3) null under which the profile of differential ex- pression is the same within the category and complement. Under this broader null, Class 2 tests are shown to b e conserv ative. W e prop ose standard b ootstrap meth o ds for testing against the Class 3 null an d demonstrate th ey provide va lid Type I error control and more p ow er than arra y p ermutation in sim u lated datasets and real microarray exp eriments. 1. In tro d uction. DNA m icroarra ys allo w researc hers to simulta n eously measure th e co expression of thousands of genes. They are widely used in Received F ebruary 2007; revised O ctober 2007. Key wor ds and phr ases. Differential expression, arra y p ermutation, b o otstrap, T yp e I error, p ow er. This is an electronic r eprint of the origina l ar ticle published by the Institute of Mathematical Statistics in The Annals of Applie d Statistics , 2008, V ol. 2, No. 1, 286– 315 . This reprint differs from the o riginal in pagination and typogr aphic deta il. 1 2 W. T. BARR Y, A . B. NOBEL AND F. A. WRIGHT biology and medicine to study the relationships b et w een transcriptional ex- pression and cellular pro cesses or disease states. A primary application of microarra ys is th e iden tification of genes w ith d ifferin g expression across ex- p erimenta l conditions, or having signifi can t asso ciation with a clinical out- come. Hereafter w e will generically r efer to the condition or clinical ou tcome as the r esp onse for eac h arra y , and the asso ciation b et w een expression and resp onse as differen tial expression (DE). Analyses of DE often pro ceed in a gene-b y-gene manner, in wh ic h the asso- ciation b et ween the resp onse and the expression of eac h gene is assessed in d ividually . A v ariet y of metho d s ha ve b een pr op osed, includ- ing stand ard p arametric tests, p ermutatio n an d r esampling-based meth- o ds, and Ba y esian tec hniques [ Dudoit et al. ( 2002 ), Newton et al. ( 2004 ) and T usher, T ib shirani and C hu ( 2001 )]. Usin g these metho ds, inv estigators can pro du ce a ranke d list of genes significan tly asso ciated to the resp onse that ma y accoun t for m ultiple testing through control of the family-wise error rate (FWER) or false d isco v ery rate (FDR). Although gene-sp ecific analyses ha ve yielded tremendous insigh t into th e role of individu al genes, they do n ot provide a mec hanism for identifying larger-scale biological phenomena. With the ready a v ailabilit y of compre- hensiv e annotation databases su c h as Gene Ontolog y (GO) [ Ash b urner et al. ( 2000 )], r esearc hers can no w explore the co ordinated inv olv ement of gene c at- e gories , n amely , sets of genes with s hared annotation or f unction. A general framew ork is w arranted for ev aluating metho ds that test the associations of an entire category to the r esp onse of in terest, and will allo w a more system- atic un derstanding of DE across the genome. Beginning with Virtanev a et al. ( 2001 ), a num b er of pro cedur es h a v e b een present ed as wa ys to assess the asso ciation b et wee n a resp onse and the ex- pression of a gene category . The most commonly used tests b egin with a list of genes deemed significan t and look for o v er -r epresen tation of catego ry mem b ers within the gene-list, u sing Fisher’s Exact T est or other tests of as- so ciation for 2 × 2 continge ncy tables [see Barry , Nob el and W righ t ( 2005 ) for a list of references]. Other appr oac hes more directly use the gene-sp ecific measures of DE, rather than collapsing th e d ata to the dic h otomous outcome of significan t asso ciation with the resp onse. In these metho ds tests are con- structed to compare the asso ciation of genes using the a verag e differences of gene-sp ecific statistics [ Kim and V olsky ( 2005 ) and Bo orsma et al. ( 2005 )], or r ank-based pr o cedu res for tw o-sample comparisons [ Mo otha et al. ( 2003 ), Barry , Nob el and W righ t ( 2005 ) and Ben-shaul, Bergman and S oreq ( 2005 )]. Gene category testing is n ow widely p erformed, and resu lts are fr equen tly rep orted without in dep endent v erification. As p ointe d out in a recent review b y Allison, Cui, P age et al. ( 2006 ), ev en fu n damen tal issu es suc h as the for- mal definition of the und erlying null h y p othesis and a prop er analysis of TESTING GENE CA TEGORIES IN MICR OARRA Y S 3 T yp e I error ha ve not b een pr o vided for man y of the metho ds in the litera- ture. Recent w ork b y Go eman and Buhlmann ( 2007 ) add r esses some of the issues s urround ing the assumptions of indep endence in gene categ ory testing, while suggesting that commonly used metho ds fail to test f or a m ore direct h y p othesis of DE among the cate gory mem b ers. Dudoit et al. ( 2007 ) ha ve also d escrib ed a very general f ramew ork for hyp othesis testing that captur es most existing metho ds for testing gene categories and prop oses b o otstrap- based testing. Ho we v er, there remains a clear need to differentiat e among existing metho d s in order to examine their strengths and p oten tial deficien- cies, and to place gene category testing on a firm statistical foundation. 1.1. Contributions. In th is pap er we pro vide a careful, extended exam- ination of gene category testing and discuss ho w a standard applicatio n of b o otstrap metho dology offers imp ro ved p erformance and flexibilit y o v er some of the existing metho ds in th e literature. W e b egin by defining a frame- w ork for gene category testing, which is general enough to includ e the ma jor- it y of the existing metho ds in the literature. Within our f r amew ork, existing gene catego ry metho ds can b e divided in to t wo d istinct classes of p ro cedures as defi n ed b y the follo w ing n u ll h yp otheses: 1. Gene-sp ecific statistics are ind ep endent and identical ly distribu ted; 2. Gene-sp ecific statistics follo w a common null d istribution, though they ma y b e d ep endent. Sev eral shortcomings of these n ull hyp otheses are d emonstrated throu gh analytic deriv ations and simulati ons u sing an example dataset. W e pr op ose a broader null hyp othesis that allo ws for arbitrary dep endence b et ween th e expression of differen t genes, as we ll as v arying degrees of as- so ciation b et ween the expression of a giv en gene and the resp onse. Un d er this more general null, array p erm u tation app roac hes can b e qu ite conser- v ativ e. Th e conserv ativ eness can b e explained in part th r ough an analytical argumen t whic h sh o ws th at the m axim um v ariance of the categ ory-wide test statistic o ccurs und er the sp ecial case induced b y arra y p ermutation. T o remedy this problem, we su ggest a simple b o otstrap-based test that is consisten t w ith the general null hyp othesis. W e d emonstrate the utilit y of the b o otstrap test on a b reast cancer dataset, and discuss other adv an tages that b o otstrap-based tests h a ve o ver array p ermutat ion pro cedur es. 2. Notatio n and general f ramew ork for gene category tests. Let x b e an m × n matrix contai ning the observ ed exp ression d ata for an exp eriment with m genes and n arr a ys. Let x ij b e the elemen t of the matrix corresp onding to the i th gene in th e j th arra y . The expression pr ofile for gene i is the ro w vecto r x i ∗ , and the expression v alues of arr a y j are represented by the column vecto r x ∗ j . W e u se lo w ercase letters to denote observ ed v alues, and 4 W. T. BARR Y, A . B. NOBEL AND F. A. WRIGHT upp ercase (i.e., X , X ij , X i ∗ , and X ∗ j ) to d enote r andom v ersions of these quan tities. The arra y-sp ecific r esp onse information is denoted by y , w ith elemen t y j corresp onding to array j . The resp onse can b e categorica l (e.g., tumor grade or exp erimenta l group assignment ) or con tinuous (e.g., surviv al time), and could p oten tially b e multiv ariate. A category is represented b y a subset C ⊆ { 1 , . . . , m } suc h that i ∈ C if an d only if gene i is a mem b er of the catego ry . The size of a category C w ill b e denoted b y m C = P m i =1 I { i ∈ C } . F or any category C , its complemen t will b e denoted b y ¯ C , and is of size m ¯ C = m − m C . W e adopt the termin ology of Barry , Nob el and W righ t ( 2005 ), w h ere it is noted th at h yp othesis tests of gene categories can b e view ed as t w o-stage pro cedures (see Box 1). In the first stage, a lo c al statistic measures the asso ciation b et w een the expression profile of eac h gene and the resp onse. W e d en ote the lo cal statistic of gene i by T i = T ( X i ∗ , y ) and let t i b e the corresp onding v alue based on observe d d ata. In a t wo-co ndition exp eriment , the lo cal statistic migh t b e a t -statistic or a verag e fold change. F or more complex datasets, such as those w ith censored surviv al data, a lo cal statistic deriv ed f r om a Cox p rop ortional hazard mo del may b e u s ed to test for asso ciation b et wee n gene expression and p atien t outcome. In many cases, T is an estimate of an underlying gene-sp ecific parameter that go verns the asso ciation b et ween resp onse and expression. In the tw o-condition example ab o ve, the related parameters w ou ld b e a scaled difference of means and a ratio of p opu lation means, resp ectiv ely . Prop er ties of lo cal statistics are examined more fully in Section 5.3 . In the second stage of a gene category test, a glob al statistic exam- ines the differential expression within the gene category th rough the col- lection of lo cal statistics. The global statistic can b e generally denoted by U = U ( T 1 , . . . , T m : C ), and in the follo wing sections we describ e many of the fu nctional forms of U ( · ) that hav e b een utilized in the literature. In the most commonly emplo ye d tests of gene categories, U ( · ) compares the lo cal statistics of genes w ithin a catego ry C to those in its complement. Metho ds focu s on either detecting a difference in th e prop ortion of genes with significan t DE, or d etermining a shift in the a verage lo cal statistic of the category against its complement. Go eman and Buhlmann ( 2007 ) ha v e argued th at comparin g a category to its complemen t creates an un necessary conflict b et wee n these metho ds and the gene-sp ecific tests. Ho wev er, alter- nativ ely prop osed metho ds that d ir ectly test the DE within a category h av e their own d ra wb ac ks. F or man y direct tests, the n u ll hyp othesis w ill tend to b e rejected more often for large categories than sm all categories. This w ill b e true ev en if the genes in the category are c hosen at rand om. F or this r eason, w e will limit our fo cu s to tests that compare a category to its complement . Among the cu r ren t metho ds for analyzing gene categories, th ere are v ar- ious wa ys to classify the tests that ha ve b een prop osed (e.g., by the c h oice TESTING GENE CA TEGORIES IN MICR OARRA Y S 5 of global statistic). In terms of T y p e I err or con trol, w e argue that the more meaningful distinction is based on the implicit n u ll hyp otheses, as describ ed in the follo wing sections. Most existing p ro cedures can b e roughly divided according to whether arr ay p ermutation is used, but w e note that additional requirement s must b e placed on the lo cal statistics in order for th e inference to b e sensible. Throughout our pap er we treat the categories to w hic h a gene b elongs as a fixed prop erty of the gene. Bo x 1: Common elemen ts of gene categ ory tests Gene category tests are t ypically tw o-stage pro cedures r equiring the follo w ing statistics: • A lo c al statistic th at measures the asso ciation b et we en the resp onse (e.g., exp eriment al condition) and the ex- pression of eac h gene. • A glob al statistic that examines the lo cal stati stics within a category , often in comparison to those of its complemen t. F or eac h global statistic there are t wo b road classes of hyp oth- esis tests: 1. Pa rametric or rank-based pro cedu res that assume ind e- p endent and identic ally d istributed lo cal statistics, or alternativ ely , gene p ermutation metho ds that ind uce the same app ro ximate null. 2. Array p ermutat ion metho ds whic h maint ain the corre- lation str ucture while indu cing a null of no asso ciations with the resp onse. Error rate con trolling or estimating pro cedures address the mul- tiple comparisons from testing man y categ ories. 3. Class 1 gene category tests. Global test statistics d etect an increased lev el of DE among the genes within a category . Man y testing pro cedures use traditional metho ds f or comparing indep end ent samples from tw o p op- ulations. In the pr op osals for these metho ds, the null hyp othesis is rarely stated, and without discussion of the app r opriateness of the un derlying as- sumptions. While a v ariet y of global statistics ha v e b een employ ed in these tests, and p -v alues are obtained from b oth exact and appro ximate distribu- tional assu m ptions, we n ote the null hypotheses h a ve a common f orm. Definition 1. A gene categ ory test is of C lass 1 if it assumes (or in- duces through gene p erm u tation) the n ull hyp othesis that th e lo cal statistics 6 W. T. BARR Y, A . B. NOBEL AND F. A. WRIGHT T 1 , . . . , T m are ind ep endent and identical ly distributed (i.i.d.), namely , H 0 : T 1 , T 2 , . . . , T m are i.i.d. with T i ∼ F , (3.1) where F can take an y form . 3.1. A survey of glob al test statistics. The global statistics prop osed for Class 1 tests fall in to t wo groups . “Categorical ” statistics rely on a list of significan t genes to ha ve b een iden tified b y a p rior gene-sp ecific analysis, while “con tin uous” global statistics incorp orate real-v alued measures of DE for eac h gene, without reference to a list of significan t genes. T o illustrate the v ariet y of global statistic s that hav e b een prop osed in the literature, we present tw o examples f r om eac h group and giv e a brief description of the corresp onding nonresampling based Class 1 tests. A one-sided form of eac h test is giv en, b ecause in most applications one is only intereste d in categories sho w in g more asso ciation w ith the resp onse than their complements. W e note it is conceiv able to conduct a one-sided test in the opp osite d irection; for instance, one could lo ok f or relativ e stabilit y within a set of hous ekeeping genes. Cate goric al statistics . Gene-list enric hment metho ds ha v e b een devel op ed as a p ost ho c means of testing a category once the genes with signifi- can t DE hav e b een iden tified. Let Γ denote the rejectio n region for lo cal statistics that pr o duces the list of s ignifican t genes. Categorical metho d s consider on ly the d ic hotomous outcomes of the m gene-sp ecific h yp othe- sis tests, and the exten t of DE within C and ¯ C can therefore b e s umma- rized b y a 2 × 2 con tingency table [illustrated in Supp lemen tary Figure 1, Barry , Nob el and W righ t ( 2008 )]. T raditional tests f or con tingency tables h a v e b een utilized in v arious gene catego ry analyses, in cluding the χ 2 test of homogeneit y , Fisher’s Exact test, and sligh t v ariations on these tests for con tingency tables. I n the classical deriv ation of such tests, bin ary v ariables I { T 1 ∈ Γ } , . . . , I { T m ∈ Γ } are as- sumed to b e in d ep endent with probabilities of r ejection P ( T i ∈ Γ) = π C for i ∈ C and P ( T i ∈ Γ ) = π ¯ C for i ∈ ¯ C . The tests are designed to ha v e p ow er to detect departures fr om ( 3.1 ) of the form π C ≥ π ¯ C under the assumption that the indicator v ariables are i.i.d. It is wo r th w h ile to note that th e Class 1 n u ll is sufficien t, but n ot necessary , for the dic hotomous outcomes to b e i.i.d. under a give n Γ. How ev er, ( 3.1 ) guarantee s the catego r ical n ull holds for an y p ossible c h oice of r ejection r egion. W e also note that Γ ma y at times b e de- fined in a data-dep end en t manner, suc h as when using an error controlli ng pro cedure in defining the s ignifi can t gene list. T h is violates the assumption of indep endent test r esults, ev en if expression is uncorrelated b et ween genes. The most common test in gene-list enric h men t metho d s is Fisher’s Exact T est. F ormally , this is a conditional test based on the total num b er of rejected TESTING GENE CA TEGORIES IN MICR OARRA Y S 7 h y p otheses, R = P m i =1 I { T i ∈ Γ } . The global statistic can b e represente d as the num b er of genes in the category that are rejected, n amely , U F = X i ∈ C I { T i ∈ Γ } . (3.2) Giv en R , an exact p -v alue can b e obtained f r om the h yp ergeometric distri- bution. In several gene-list enric hm en t soft ware pac k ages, the unconditional χ 2 test of homogeneit y is pr op osed as an app ro ximate test for large categories [ Draghici et al. ( 2003 ) and Beißbarth and Sp eed ( 2004 )]. The one-sided ver- sion of this test is equiv alen t to the d ifference in prop ortions test originally prop osed by Pe arson ( 1911 ). The asso ciated global statistic can b e written in the form U P = ˆ π C − ˆ π ¯ C ˆ σ P = 1 m C · ˆ σ P X i ∈ C I { T i ∈ Γ } − 1 m ¯ C · ˆ σ P X i ′ ∈ ¯ C I { T i ′ ∈ Γ } , (3.3) where ˆ σ P is the traditional estimated standard deviation of the d ifference in prop ortions. Under th e Class 1 n ull, the central limit theorem ensures that the t w o prop ortions are asymptotically normal for large m C and m ¯ C , suc h than a Z -test can b e p erformed on U P . Giv en the v ariet y of metho ds f or generating gene-lists, it is not alwa ys clear whether it is appr opriate to condition on R , but in general, exact tests are fa v ored for their abilit y to handle small categories. F or m o derately sized catego ries, w e note ther e will b e little difference b et wee n the exact condi- tional and the follo wing appro ximate unconditional test. F or this reason, we will restrict our atten tion to U F in the sim u lations p erform ed in Section 4 . Continuous statistics . In con trast to gene-list type tests, it is also p ossible to directly compare the ob s erv ed asso ciations of expression and resp onse without an in termediate gene list. On e straigh tforward global statistic is the a ve rage difference in lo cal statistics b et wee n a cate gory and complemen t, namely , U D = ˆ µ C − ˆ µ ¯ C ˆ σ D = 1 m C · ˆ σ D X i ∈ C T i − 1 m ¯ C · ˆ σ D X i ′ ∈ ¯ C T i ′ , (3.4) whic h has p o w er to detect an increase in th e exp ected v alue of lo cal statistics in the catego ry , µ C = E [ T i | i ∈ C ] , relativ e to the complement , µ ¯ C = E [ T i | i ∈ ¯ C ] [as illustrated in Supp lemen tary Figure 1, Barry , Nob el and W right ( 200 8 )]. Sev eral hypothesis tests based on the a v erage difference hav e b een prop osed, including a Z -test p erformed where ˆ σ D is the standard deviation of all m lo cal statistics [ Kim and V olsky ( 2005 )], and a t -test p erformed where ˆ σ D is the p o oled sample v ariance of the local statistics [ Bo orsma et al. ( 200 5 )]. In the remainder of this pap er we will fo cus on the t -test ve rsion of U D , bu t 8 W. T. BARR Y, A . B. NOBEL AND F. A. WRIGHT note for a t yp ical category where m C ≪ m , the v ariance estimates in the t wo approac h es will b e similar, yielding comparable results. The global statistic in ( 3.4 ) ma y not b e robust to outliers or skewness in the lo cal statistics. Rank-b ased global statistics a void this sh ortcoming, as they are in v arian t to monotone transf ormations of the lo cal statistics. T he Wilco xon rank sum statistic, U W = X i ∈ C Rank( T i ) , (3.5) is designed to test a median difference in the t wo p opulations of lo cal statis- tics and has b een imp lemen ted in GOStat b y Beißbarth and Sp eed ( 2004 ). Under th e Class 1 null hypothesis, the d iscrete C DF of U W is known once m C and m ¯ C are sp ecified. Hyp othesis testing then pro ceeds using an exact pro cedure or a norm al appro ximation to U W . A Kolmogoro v–Smirn o v t yp e global statistic has also b een implemented in another rank-based Class 1 pro cedure [ Ben-shaul, Bergman and Soreq ( 2005 )]. Ho wev er, the K olmogoro v–Sm irno v statistic has b een criticized in gene category testing for b eing sen s itiv e to departur es that d o not necessar- ily reflect increasing DE in th e catego ry [ Damian and Gorfine ( 2004 )]. F or example, a category with no DE b ut with lo cal statistics that all happ en to b e nearly iden tical would b e considered signifi can t b y these tests. F or this reason, w e restrict our focus to U D and U W when considering con tin uous global statistics. 3.2. Gene p ermutation. S ev eral p ermutat ion-based metho ds hav e pr o- p osed rand omly reordering the r o ws of the data matrix to determine category significance [ Ash b urner et al. ( 2000 ), Pa vlidis et al. ( 2004 ) and Zhong et al. ( 2004 )]. In this setup, the colle ction of local statistics r emains unc h anged while the category assignments are randomized. Gene p ermutat ion effec- tiv ely induces the C lass 1 n u ll h yp othesis in ( 3.1 ), with the distribution of eac h reassigned lo cal statistic equaling the empir ical distribution of all observ ed v alues, ˆ F ( t ) = m − 1 P m i =1 I { t i ≤ t } . Exh austiv e p ermuta tion of the gene assignm ents w ill b e iden tical to a Fisher’s Exact T est of U F and a Wilco xon rank sum test of U W . Although gene p ermutat ion has limited u se- fulness for global statistics with traditional tests f or the n u ll stated in ( 3.1 ), it has prov en to b e usefu l in more complex global statistics [ Efron and Tibshiran i ( 2007 )], and also main tains th e correlation b et ween tests of ov erlapping cat- egories, desp ite inducing indep endent lo cal statistics. W e emphasize that gene-p ermutation pro cedur es (whic h are also calle d “gene-sh uffling”) follo w a reasonable and principled dev elopment, if on e is willing to assu me the category assignment s in C are ran d om. Then the null h y p othesis is th at C and the expression data X are indep end en t. Under these assumptions, gene p ermutatio n reflects inference conditioned on the TESTING GENE CA TEGORIES IN MICR OARRA Y S 9 expression data. Ho wev er, as we detail later, Class 1 tests, in cluding those based on gene p ermutatio n, are sens itiv e to correlation of expression of genes within categories, regardless of DE. S uc h correlation repr esen ts a departure from the assumption of in dep endence of X and C , bu t is un related to DE. F ollo wing our p ersp ectiv e that gene category assignments are fixed, we view gene p er mutation pro cedur es as Class 1. 4. The effect of correlation on Class 1 tests. I n this section we examine more closely the assumption of indep end en t lo cal statistic s, and how vio- lations of this assu mption effect th e p erform an ce of Class 1 tests. W e note that correlation of lo cal statistics arises naturally fr om correlation of ex- pression among genes. A sim ulation study based on a real microarra y data set exhibits the extreme an ti-conserv ativ e b eha v ior of Class 1 tests in the presence of realistic lev els of correlation in expression. 4.1. Corr e lations in e xpr ession and lo c al statistics. Let the p op u lation correlation b et wee n genes i and i ′ b e giv en as ρ X i,i ′ = Corr( X ij , X i ′ j ). F or exp eriment al designs with indep end en t arra ys , a n atural estimate of ρ X i,i ′ is the sample correlation co efficien t, r i,i ′ . The distribu tions of global s tatistics for Class 1 tests are directly affected b y th e correlatio n b et ween lo cal statis- tics, ρ T i,i ′ = Corr( T i , T i ′ ). In the s p ecial case that T tak es the linear form T ( X i ∗ , y ) = P n j = 1 a ( y j ) · X ij for some function a ( · ), it is easy to see that ρ T i,i ′ = ρ X i,i ′ . An example of a linear local statistic would b e fold c h ange on the log-scale. In general, the r elationship b et wee n ρ X i,i ′ and ρ T i,i ′ do es n ot hav e a simple analytic form, although it can b e sh o wn numerically to often b e monotone and ap p ro ximately linear for one-sided lo cal statistics. In deed, Mont e Carlo sim u lations of gene expr ession data (Figure 1 ) demonstrate that a nearly linear relationship holds for several standard exp eriment al designs and cor- resp ondin g measures of DE. This includes u sing a Stud en t’s t as the lo cal statistic f or a t wo-co n dition stud y , and a W ald-t yp e statistic for regress- ing expression on censored time-to-e ven t data through a Co x prop ortional hazards mo d el. F or such lo cal statistics, ρ X i,i ′ ≈ ρ T i,i ′ so that the sample cor- relation coefficients of gene expression can b e used as estimates of { ρ T i,i ′ } in determining the pr op erties of global statistics. Ho we v er, the t wo correla- tions hav e a nonlinear relationship for “und irected” lo cal statistics, suc h as an analysis of v ariance F -statistic [Figure 1 (b)]. 4.2. V arianc e inflation. Th e effects of pairwise correlation on Class 1 tests can b e illustrated by deriving the true v ariances of the global statistics U D and U W in the p r esence of dep endence. 10 W. T. BARR Y, A . B. NOBEL AND F. A. WRIGHT (a) (b) (c) Fig. 1. Corr elations b etwe en gene expr ession levels i nduc e c orr elations in lo c al statis- tics. Monte Carlo simulations of standar d Gaussian expr ession for two genes under sev- er al exp erimental designs: (a) a two-sample c omp arison wi th a Student ’ s t -statist ic; (b ) four-sample c om p arison wi th an ANOV A F -st atistic; (c) survival using a Wald test fr om a univariate Cox-pr op ortional hazar d mo del. F or e ach design, sample c orr elation was ob- serve d acr oss 100 gene p airs and n = 40 arr ays with e qual ly size d gr oups or exp onential ly distribute d event and c ensor times. The me dian and r epr esentative (0.05, 0.95) quantile intervals ar e shown fr om 200 simulations. Si milar r esults ar e obtaine d when sim ulating heter osc e dastic genes. F or the a verag e difference global statistic U D , a simple calculation sh o ws that the true v ariance of the statistic will differ fr om that under the i.i.d. n u ll in Class 1 tests b y three additional terms: V ar[ ˆ µ C − ˆ µ ¯ C ] = V ar i . i . d . [ ˆ µ C − ˆ µ ¯ C ] (4.1) × 1 + m ¯ C ( m C − 1) m ρ C + m C ( m ¯ C − 1) m ρ ¯ C − m C · m ¯ C m ρ C, ¯ C , where the quant ities ρ C = 1 m C · ( m C − 1) X i ∈ C X i ′ ∈ C i ′ 6 = i ρ T i,i ′ , (4.2) ρ ¯ C = 1 m ¯ C · ( m ¯ C − 1) X i / ∈ C X i ′ / ∈ C i ′ 6 = i ρ T i,i ′ , (4.3) ρ C, ¯ C = 1 m C · m ¯ C X i ∈ C X i ′ / ∈ C ρ T i,i ′ (4.4) are related to the a v erage pairwise corr elations within the category ( 4.2 ), within its complemen t ( 4.3 ), and across th e t wo gene sets ( 4.4 ). W e note TESTING GENE CA TEGORIES IN MICR OARRA Y S 11 that ρ C can v ary greatly across catego ries, while ρ ¯ C and ρ C, ¯ C will b e close to the a ve rage pairw ise corr elation of all genes on the array and near zero in most datasets. F or a mo derately sized category where m ¯ C ≈ m , the ration of v ariances in ( 4.1 ), V ar[ ˆ µ C − ˆ µ ¯ C ] / V ar i . i . d . [ ˆ µ C − ˆ µ ¯ C ], is approxi mately 1 + ( m C − 1) · ρ C . Th is ratio measures the v ariance inflation of U D o ve r what is assu m ed by ( 3.1 ), and as a consequence, the catego ry exhibiting p ositiv e correlation will tend to ha ve an ti-conserv ativ e Class 1 tests of significance DE. F or the Wilco xon r ank sum global statistic, the true v ariance w ill dep end on the common distribution F of lo cal statistics, as defined in ( 3.1 ). In the sp ecial case that lo cal statistics are marginally n ormally distributed, with common mean, unit v ariances, and pairwise correlations { ρ T i,i ′ } , then V ar[ U W ] is giv en by V ar[ U W ] = 1 2 π X i ∈ C X i ′ ∈ C X h / ∈ C X h ′ / ∈ C sin − 1 ρ T i,i ′ + ρ T h,h ′ − ρ T i ′ ,h − ρ T i,h ′ q (2 − 2 ρ T i,h ) · (2 − 2 ρ T i ′ ,h ′ ) . (4.5) The deriv ation of ( 4.5 ) is provided in th e Su p plemen tary material [ Barry , Nob el and W right ( 2008 )] and is analogous to the classic work of Gast wirth and Ru bin ( 1971 ) on th e effect of d ep endence on the Wilco xon rank sum. If the lo cal statistics within a category w ere all p ositiv ely corre- lated an d the complemen tary set of genes w ere in dep endent, this v ariance is easily sho wn to b e strictly greater than what is assumed un d er the Class 1 null, V ar i . i . d . [ U W ] = m C · m ¯ C · ( m + 1) / 12 . Correlation b et ween lo cal statistics will also affect the dis tr ibutions of U F and U P . Ho wev er, the v ariance of th ese categorical global statistics in the p r esence of correlation will fur ther dep end on b oth the distribu - tion F and the rejection region Γ. In the next subsection w e p resen t a simple s im ulation study illustrating the effect of gene correlatio n on Class 1 tests for ann otated categories in a r eal microarra y dataset. The anti- conserv ativ e b eha vior of a Class 1 test using the global statistic U F is explored in the recen t w ork of Go eman and Buhlmann ( 2007 ), w ho con- sidered sim ulated Gauss ian expr ession d ata in which the pairwise correla- tion of genes is fixed and equal, and categories are of a fixed size. Th e sim u lation stu dy b elo w attempts to capture the more complicated correla- tion structures and v ariable sizes of fu nctional categories that o ccur in r eal data. 4.3. A simulation study. A t wo -condition exp eriment was sim ulated us- ing a subset of the lung carcinoma microarra ys from Bhattac harjee et al. ( 2001 ). W e fi rst selected 100 adeno carcinoma samples at rand om from the dataset, that con tains expression estimates for 7299 genes [see Barry , Nob el and W righ t ( 2005 ) for data pre-pro cessing steps]. Among the 12 W. T. BARR Y, A . B. NOBEL AND F. A. WRIGHT (a) (b) Fig. 2. Po or p erformanc e of Class 1 tests. (a) Em piric al CDFs of p o ole d p -values (1823 c ate gories over 1000 si mulations) for the Class 1 Fi sher’s Exact T est, Student ’ s t -test, and Wilc oxon r ank sum test gener ate d under the nul l hyp othesis in ( 5.1 ) . (b) The same data ar e plotte d on the l o g-10 sc ale to demonstr ate the dispr op ortionate numb er of smal l p -values that r esults f r om inc orr e ct varianc e estimates. a v ailable genes, 1823 GO and Pfam categories w ere identified with at least 5 mem b ers. Th e within-category av erage p airwise samp le correlatio ns ranged from − 0 . 09 to 0.93, with more than 86% of the categories ha vin g v alues greater than the a verage pairw ise correlation across the entire array (0.012) . This increase in correlation within categories illustr ates the common ob- serv ation that co expression among genes is associated with gene fu nction [ Lee et al. ( 2004 )]. One thousand binary resp onse vecto rs with equal num b ers of zeros and ones were generated at rand om, and us ed to assign th e arrays to one of t wo cond itions. T he r andom assignment of arra ys ensured that th e resulting datasets had no asso ciatio n b et ween exp ression and exp erimen tal condition for any gene, and thus, no category is exp ected to ha ve a greater degree of DE than any other. W e note that the expression matrix is held constan t across sim u lations, so that the sample gene–gene correlations { r i,i ′ } remained fi xed. F or eac h realization of th e resp onse v ector, a p o oled-v ariance t -statistic w as used as the lo cal statistic, and global statistics U F , U D and U W w ere computed. F or the Fisher’s Exact T est statistic, U F , the rejection region w as equal to v alues exceeding t 98 , 0 . 95 = 1 . 66. F or eac h global statistic and eac h catego ry , the differen t Class 1 tests p ro duced a nominal p -v alue for ev ery generated resp onse v ector. Empirical CDFs of the nominal p -v alues p o oled across all categories and all realizations demonstrate their extreme nonuni- TESTING GENE CA TEGORIES IN MICR OARRA Y S 13 formit y un d er th e induced null hyp othesis, confi r ming th e p o or p erformance of Class 1 tests (Figure 2 ). The a verag e T yp e I err or of these tests w as estimated as the prop ortion of p -v alues und er simulatio ns that fall b elo w a target α level. T able 1 displays that, for eac h global statistic, the corresp onding Class 1 tests r eject far more hyp otheses than exp ected. Moreo v er, the anti -conserv ativ e b eha vior of these tests increases for smaller target α v alues. Eve n though the gene-list enric h m en t metho ds are slight ly less anti- conserv ativ e than the contin uous metho ds, this is offset b y th eir p oten tial loss in p ow er from dichoto mizing lo cal statistics. T o illustrate h o w th is b ehavio r also affects the family-wise error rate among the L = 1823 catego ries, we applied a Bonferroni correction to the nominal p -v alues. Since for the randomized data all categories are tru ly null, the FWER is estimated b y FWER = 1 1000 1000 X b =1 I ( L X h =1 I p b,h < α L > 0 ) , (4.6) where p b,h is the Class 1 p -v alue for categ ory h under realization b . T here is substant ial o v erlap in the members h ip of gene categories from annota- tions su c h as Gene Onto logy , and thus tests will b e p ositiv ely correlated accordingly . Therefore, the use of Bonferr oni thr esholds m ight b e thou ght to b e o ve rly stringen t in controlli ng th e FWER, pro vid ing some p rotection against an ti-conserv ative Class 1 p -v alues. How ev er, for α = 0 . 05, the real- ized FWER in ( 4.6 ) is far greater th an the target lev el ( U F : 0 . 776, U D : 0 . 925 and U W : 0 . 918). The extreme anti- conserv ativ e b ehavio r of the Class 1 tests of all global statistics suggests a differen t app roac h is needed to conduct v alid gene category tests. 5. Class 2 tests an d arra y p ermutatio n. The null h yp othesis of Class 1 tests is violated by the correlations pr esen t in gene expr ession data, and w e demonstrate the resulting an ti-conserv ativ e b eha vior. F or this reason, a second class of gene category tests is warran ted that can id en tify increases in DE within a catego r y , while pr op erly accoun ting for correlation. Definition 2. Class 2 gene categ ory tests are defin ed b y th e assumed or induced null hyp othesis that the local statistics T 1 , . . . , T m are p ossibly dep endent and iden tically distrib uted. More p recisely , H 0 : T 1 , T 2 , . . . , T m are identica lly d istributed with T i ∼ F 0 , (5.1) where F 0 corresp onds to a lac k of asso ciatio n b et wee n expression and th e resp onse of inte rest. No assump tions are m ad e ab out dep enden ce among the T i s. 14 W. T. BARR Y, A . B. NOBEL AND F. A. WRIGHT In order f or ( 5.1 ) to hold in a giv en exp erimental d esign, an appropr iate form of T ( · ) m ust b e selected to ensu re lo cal statistics are marginally iden- tically distributed. In the follo wing section we describ e a s u fficien t prop ert y of lo cal statistics to ind u ce ( 5.1 ) u nder a global null of all genes h a ving n o DE. 5.1. δ -determine d lo c al statistics. In gene category testing, th e true as- so ciation b et w een th e exp ression of an ind ividual gene and a real- or vec tor- v alued resp onse can often b e su mmarized by a single fixed parameter δ that dep ends on th eir (unkno wn) joint d istribution. In the absence of an y asso ciation, the parameter frequent ly assumes a known null-v alue. Accord- ingly , the lo cal statistic T ( · ) is chosen for its utilit y in conducting h yp othesis tests against the n u ll v alue of the p arameter. T o illustrate, consider a t wo- condition exp erimen t where the resp onse vec tor y take s v alues of 1 or 2, indicating the sample condition of eac h arra y . If the expression of gene i has exp ectation µ 1 i and µ 2 i under the t w o resp ectiv e conditions, and common v ariance σ 2 i , then a natural measur e of asso ciation is the scaled difference in means δ i = µ 1 i − µ 2 i σ i · p 1 /n 1 + 1 /n 2 . (5.2) Here and b elo w, δ i denotes the v alue of the asso ciation parameter for gene i . In this case, the gene-sp ecific null h yp othesis of interest is H 0 ,i : δ i = 0, and the p o oled-v ariance t -statistic is a n atural c hoice of lo cal statistic [ Galitski et al. ( 1999 )]. When the expr ession leve ls of gene i are normally distrib u ted, and indep end en t f rom sample to s amp le, th e lo cal statistic follo ws a t - distribution with noncen tr ality parameter δ i , whic h reduces to a cen tral t -distribu tion when δ i = 0 . In general, a function T ( · ) is a prop er c hoice of test statisti c for a null of the form H 0 : δ = d when the d istribution F ( T | δ i = d ) of T giv en δ = d is known and do es not dep end on an y n uisance parameters. When the distribution of T ( · ) can b e sp ecified in this man n er for any c hoice of d , we refer to its distr ib ution as b eing δ -determine d . Th is p rop ert y is imp ortan t in the basic theory of in terv al estimation and pivo tal qu an tities; if F ( T | δ = d ) is δ -determined, it can b e u sed as a pivot al quan tity to construct a confiden ce set for δ [ Casella and Berger ( 2002 )]. In the particular example pr esen ted ab o ve, a S tudent ’s t is δ -determined by ( 5.2 ). The δ -determined prop ert y is imp ortan t when conducting gene catego ry tests; if the distribu tion of T is δ -determined, then differences in n uisance parameters d o n ot influ ence the comparison of a catego ry against its com- plemen t. T o illustrate, consider a t w o-condition exp eriment with δ defined as ( 5.2 ). Here the gene-sp ecific m eans and v ariances of expression are con- sidered nuisance parameters. Supp ose that for eac h gene one d ir ectly uses TESTING GENE CA TEGORIES IN MICR OARRA Y S 15 the mo dified t -statistic from the SAM softw are [ T ush er, Tibshiran i and Chu ( 2001 )] as th e lo cal statistic. This statistic con tains a constant in the denom- inator that effectiv ely p enalizes lo wly-expressed genes in order to improv e the FDR of a gene-list. Due to the presence of this constant, the SAM t - statistic is not δ -d etermined, as its distr ib ution dep ends on the means and v ariances of gene expr ession. No w consider a category consisting primarily of highly-expressed houseke eping genes. Under a global n u ll in which no genes are differen tially expressed, and th us no category should b e considered sig- nifican t, highly expressed genes hav e an increased c h ance of b eing ranked ab o ve lo wly-expressed genes wh en usin g the S AM statistic. Thus, a category with highly expr essed genes is more likel y to b e (falsely) declared significan t, regardless of whether one uses a catego rical or con tin uous global statistic. Categories with lowly-expressed genes wo uld exp erience the opp osite effect. When a δ -determin ed lo cal statistic is c h osen and a uniqu e v alue, d 0 , of the parameter corresp onds to a lac k of asso ciation b et ween expression and resp onse, the Class 2 null can b e restated as H 0 : δ 1 = · · · = δ m = d 0 . F or the remainder of th e pap er, w e will only consider lo cal statistics that are δ -determined, or appro ximately so when n is large. 5.2. Arr ay p ermutation. If the pairwise correlatio ns { ρ T i,i ′ } of the lo cal statistics are kn o wn, a C lass 2 test can b e constructed for the a ve rage dif- ference statistic U D using its true v ariance, as derived in ( 4.1 ). Similarly , an appro ximate Z -test for the Wilco xon rank su m statistic U W can b e designed using ( 4.5 ) if lo cal statistics are app ro ximately norm al. Ho we v er, since th e correlations are generally unknown, a particular f orm of p erm u tation can b e used as an alternativ e m eans of approximate ly inducing the C lass 2 n u ll. In many common microarra y exp eriments, eac h mRNA samp le consti- tutes an indep endent unit. By p erm uting th e column v ectors of X , or equiv- alen tly the resp onse v ector y , an emp irical null distr ibution is achiev ed in whic h there is no asso ciation b et w een gene expression and the resp onse. Ar- ra y p ermutatio n was fi rst used in Virtanev a et al. ( 2001 ) to test categories of genes, and then implemented in GSEA for a Kolmogoro v–Smirnov global statistic [ Mo otha et al. ( 2003 )], and in SAFE for any c h osen global statistic [ Barry , Nob el and W righ t ( 2005 )]. More recen tly , other global statistics ha ve b een pr op osed for use with array p ermutat ion, includin g a we igh ted version of GSEA [ Subr amanian et al. ( 2005 )] and a standardized trun cated mean that is more sensitive to d irectional c hanges [ Efron and T ibshirani ( 2007 )]. These r ep orts note that arra y p ermutati on do es not c h ange the correlations in expression among genes, and th us the gene-sp ecific measures of DE re- main dep endent. Also, wh en u sing arra y p ermutat ion the resampled lo cal statistics are conditional on the observ ed dataset, s uc h that their empirical distributions are not exactly identic ally d istributed, and on ly approxima tely 16 W. T. BARR Y, A . B. NOBEL AND F. A. WRIGHT follo w the Class 2 n ull. Ho wev er, if one uses th e gene-sp ecific empirical p - v alues as local statistics, then every local statistic will exactly f ollo w the discrete un iform distribu tion under p ermutation, guaran teeing ( 5.1 ). 5.3. Simulate d c over age of Class 2 tests. The ran d omized datasets from ( 4.3 ) w ere used to ev aluate Class 2 tests of eac h global statistic b ased on arra y p ermutatio n . Here the tests are ensured to b e of prop er size, since the randomization pro cedur e in the sim u lation and the arr a y p ermutation in the test b oth emplo y the same sampling pro cess. W e confirmed this b y obtaining empirical p -v alues for eac h catego r y and eac h realization of th e resp onse v ector (T able 1 ). Due to the computational bur dens of b oth sim u lation and p ermutati on, only 1000 resamples were take n for eac h test, s o the smallest p ossible empir ical p -v alue was 0.001. The Class 2 Fisher’s Exact T est results are notably conserv ativ e, du e to the numerous tied global statistics that o ccur in small categories. Th e slight miss p ecification of T yp e I error for U P , U D and U W reflects only sampling v ariabilit y . These r esults demonstrate Class 2 tests of gene catego r ies generally outp erform Class 1 tests based on the assum ption of gene indep endence. 6. A more general null for gene category tests. Although Class 2 tests of gene categories appropriately accoun t for the correlation structure of gene expression data, they sh are w ith Class 1 pro cedures the shortcoming of assuming a null h yp othesis under wh ic h lo cal s tatistics are ident ically dis- tributed. This assump tion is n ot n ecessary wh en considering whether a gene catego ry exhibits a greater degree of d ifferen tial expression than its comple- men t. F or example, supp ose 20% of the genes are differentia lly expressed to T able 1 The r atio of r e al ize d T yp e I err or r ates to tar get α levels Fisher’s, U F Student’s t , U D Wilco xon, U W Class 1 tests α = 0 . 1 1 . 19 1 . 82 1 . 86 α = 0 . 01 3 . 40 5 . 92 5 . 83 α = 0 . 001 13 . 4 25 . 2 23 . 5 α = 1 e –4 65 . 6 130 116 α = 1 e –5 367 769 677 α = 1 e –6 2213 4974 4 245 Class 2 tests α = 0 . 1 0 . 39 1 . 01 1 . 01 α = 0 . 01 0 . 21 1 . 01 1 . 01 α = 0 . 001 0 . 14 1 . 03 1 . 01 α = 1 e –4 NA NA NA TESTING GENE CA TEGORIES IN MICR OARRA Y S 17 the same degree (where δ i equals a common nonnull v alue d ), and the r emain- ing genes h a ve no asso ciation with the resp onse ( δ i equals the n u ll v alue d 0 ). An y category in whic h 20% of the genes are differentia lly expr essed sh ould not b e consid er ed “sp ecial.” Ho wev er, the Class 2 null, whic h is induced by arra y p ermutatio n, is clearly violated under this scenario. Based on this simple example, w e pr op ose the follo wing less restrictiv e, and more biolog ically realistic, null hyp othesis of gene categories. Instead of requ iring the lo cal s tatistic s of all genes to b e identica lly distributed, w e allo w eac h to fall into one of K ≤ m C strata that corresp ond to a different marginal distrib ution for the statistic. No conditions are imp osed on the dep enden ce of the lo cal s tatistics. Th e n u ll can b e formalized as follo ws. Definition 3. Let K ≥ 1 and let G 1 , . . . , G K b e distinct, fixed dis- tributions. Let the lo cal s tatistic s T 1 , . . . , T m ha ve marginal d istributions F 1 , . . . , F m and let C ⊂ { 1 , . . . , m } b e a gene category . Assume that eac h F i ∈ { G 1 , . . . , G K } and that β C,k = m − 1 C P i ∈ C I { F i = G k } and β ¯ C ,k = m − 1 ¯ C P i ∈ ¯ C I { F i = G k } are the prop ortions of genes from C and ¯ C , r esp ec- tiv ely , whose local statistics are distributed as G k . Th e C lass 3 null hyp oth- esis is the follo win g: H 0 : β C,k = β ¯ C ,k ≡ β k , k = 1 , . . . , K, (6.1) where the distributions G 1 , . . . , G K can tak e an y form. The Class 1 and Class 2 null h yp otheses are then sp ecial cases of ( 6.1 ) with K = 1 str atum. When DE can b e assessed in terms of an asso ciation parameter δ , and the lo cal statistic is δ -determined [e.g., th e scaled differ- ence in m eans ( 5.2 ) and the S tudent ’s t -statistic], the strata can b e directly related to different degrees of asso ciation with the resp onse. In this case, the Class 3 null h yp othesis is equiv alen t to the statemen t that the empirical distributions of δ s in C and ¯ C are iden tical. Dudoit et al. ( 2007 ) apply a general appr oac h to m ultiple testing to a fam- ily of p roblems in volving sim u ltaneous testing of ann otatio n-based profiles using gene expression data. T heir wo rk pro vides a framew ork for multiple testing of asso ciations b et ween what the authors term gene-annotation pro- files and gene-parameter p rofiles. Th e former include gene categories and GO terms. The latter are p opulation based qu an tities th at encompass measures of asso ciation b etw een the expression of a gene and a b inary or con tinu- ous resp onse, includ in g a s caled difference (or ratio) of means. When lo cal statistics are δ -determined, the Class 2 and Class 3 n u lls considered here can b e placed w ithin that framew ork , with the vect or of gene-parameter profiles playing a r ole analogo us to the gene asso ciation parameters δ . W e note that the Wilco xon global statistic is not linear in the sense describ ed 18 W. T. BARR Y, A . B. NOBEL AND F. A. WRIGHT in Dud oit et al. ( 2007 ), and therefore is n ot cov ered b y their theoretical dev elopments. In the follo wing su bsections we discuss simp le b o otstrap-based tests that: (a) maint ain the correlation structure of th e expression d ata and (b ) demon- strate ap p ro ximate T yp e I error con tr ol u nder different realizati ons of the Class 3 null. Simulatio ns of microarray data rev eal that tests based on b o ot- strap resampling of arra ys clearly outp erform arra y p ermutation tests that induce a C lass 2 null. F urther examination of the d istributional prop erties of U W and U D indicate the p o or p erformance of arr a y p ermutat ion in this more general setting. Finally , we illustrate th rough simulat ion the increased p o wer of Class 3 tests under a d efined set of alternativ e hyp otheses. 6.1. Defining the b o otstr ap-b ase d tests. S tandard b o otstrap metho dol- ogy assumes that the obs erv ed data can b e divided into indep endent un its deriv ed f rom an unknown p robabilit y mo del. Resampling fr om the empir- ical distrib ution of the observ ed data enables one to form approxima te confidence in terv als without p arametric assumptions [ Efron and T ibshirani ( 1998 )]. F or most microarra y exp eriments, the ind ep endent sampling u n it is the joint v ector { x ∗ j , y j } cont aining m gene expression measurements and resp onse information for a single mRNA sample. T o approximate the un- kno wn prob ab ility m o del of the d ata, b o otstrap pro cedur es resample the join t v ectors with r eplacemen t. Let b = ( b 1 , . . . , b n ) b e a resamplin g vec tor whose elemen ts are indep end en t and uniform ly d istr ibuted o ve r the intege rs { 1 , . . . , n } . Asso ciated with b is a resampled resp onse y ∗ b = ( y b 1 , . . . , y b n ), and a resamp led expression matrix in which the measurement s of gene i are giv en by x ∗ b i · = ( x ib 1 , . . . , x ib n ). F rom the r esampled data, lo cal statis- tics t ∗ b i = T ( x ∗ b i · , y ∗ b ), and a global statistic u ∗ b = U ( t ∗ b 1 , . . . , t ∗ b m : C ) may b e calculate d in the u sual wa y . Let B denote the total num b er of b o otstrap samples. Standard pro cedures can b e used to generate b o otstrap confidence in- terv als f or the parameter θ = E [ U ]. In the con text of lo oking f or in cr eased amoun ts of DE, one w ould define a one-sided confid ence int erv al of size α by its lo w er b ound L α . Arguably , the simplest pro cedu r e for pro du cing the one-sided confidence in terv al via b o otstrap resampling is the qu an tile metho d [ Efron ( 1979 )], in wh ic h L α is the sample α -quan tile of the resam- pled v alues: u ∗ ( B · α ) . The quantile metho d is straigh tforwa rd to compute and in v ariant under monotone transformations of the global statistics. Ho wev er, its co v erage ma y b e p o or wh en the sample size is small [ Efron ( 1987 )], due to the d iffi cu lt y of estimating the tail distribution of th e global statistic. Alternativ ely , if one assu mes that th e global statistic is appro xim ately nor- mal, a confidence in terv al can b e generated from the t -d istribution using TESTING GENE CA TEGORIES IN MICR OARRA Y S 19 b o otstrap-based estimates of the moments of U W [ Efron ( 197 9 )]. Th e re- sulting one-sided confidence interv al has a lo w er b ound giv en by ¯ u ∗ − c se ∗ ( U ) · t n − 1 , 1 − α , (6.2) where ¯ u ∗ = 1 B B X b =1 u ∗ b and c se ∗ ( U ) = P B b =1 ( u ∗ b − ¯ u ∗ ) 2 B − 1 1 / 2 . (6.3) Hyp othesis testing with the b o otstrap was originally p rop osed by Efr on as b eing applicable wh en th e distr ib ution of a test statistic w as un kno w n un- der a n ull hyp othesis (due to nuisance parameters) b ut could b e indu ced b y b o otstrap-resampling [ Efron and Tibshiran i ( 1998 )]. Hall and Wilson ( 1991 ) ha ve prop osed th at b o otstrap-based tests can also b e constru cted when the empirical distribu tions of resampled statistics do not dir ectly relate to H 0 if a “piv ot test” is used. In the setting of gene categories, this w ould relate to testing f or the exclusion of some null v alue, θ 0 = E H 0 [ U ] , fr om a confidence in terv al defined by the p opu lations of resampled global statistics. These tests are of particular us e for the Class 3 null, whic h w ould b e difficult to induce directly through the resampling the arr a ys in a wa y that also maint ains gene-correlat ion. W e generally fa vo r usin g th e Wilco xon rank sum global statistic, U W , for gene category tests, b ecause it is a robus t and transformation-inv arian t mea- sure of a verage differen ce that av oids the arbitrariness the gene-list metho ds ha ve of c h o osing a rejection region. The f ollo wing theorem establishes the exp ectation of the Wilco xon global statistic U W is a constan t, θ 0 , und er all realizatio n s that the stratified n u ll h yp othesis ( 6.1 ). Theorem 1. Supp ose that for e ach i the lo c al statistic T i of gene i has distribution F i ∈ { G 1 , . . . , G K } and that P ( T i = T j ) = 0 for i 6 = j . Then for any c ate gory C ⊂ { 1 , . . . , m } such that β C,k = β ¯ C ,k = β k for e ach str atum k = 1 , . . . , K , E [ U W ] = m C · ( m + 1) 2 . (6.4) (See App endix A for the pro of.) Note th at the exp ectatio n is constan t, regardless of the n umb er of strata K , the prop ortions { β 1 , . . . , β K } , and the distributions { G 1 , . . . , G K } . S imilar deriv ations demonstrate that the global statistics U D and U P ha ve a fixed exp ectation of 0 u nder ( 6.1 ), allo wing for the constru ction of a test based on b o otstrap resampling. The Class-3 b o otstrap tests adv o cated here are b ased on standard b o ot- strap confidence in terv als. Dudoit et al. ( 2007 ) also pr op ose b o otstrap tests within the multiple testing fr amework considered in their pap er. S p ecialized 20 W. T. BARR Y, A . B. NOBEL AND F. A. WRIGHT to the setting of the C lass 3 null, their b o otstrap pro cedure is essentia lly similar to the quant ile-based metho d we discuss ab ov e. Do dd et al. ( 200 6 ) ha ve also applied b o otstrap resampling to category testing in th e con text of differen tial expression b et w een cancerous and normal human tissue, in whic h a genelist w as in terrogated with th e Pearson-t yp e global statistic, U P . Many of the argument s w e present in the follo wing sections in su pp ort of b o otstrap testing can b e app lied to the pro cedures in Dud oit et al. ( 2007 ) and Do dd et al. ( 2006 ). In con trast to the global statistics men tioned ab ov e, the exp ectation of the global statistic emp lo y ed in Fisher’s Exact test dep end s on the K gene- sp ecific distribu tions, and the exp ectatio n of th e Kolmogoro v–Smirnov t yp e global statistic used in Mo otha et al. ( 2003 ) d ep ends on b oth the marginal distribution of the lo cal statistics, and their correlation structure. As a conse- quence, one cannot test for exclusion of a null v alue from confidence interv als of these t wo global statistics. The follo wing simulati ons of v arious Class 3 n u lls w ere designed to ev al- uate the Typ e I and I I err ors of b o otstrap-based tests for b oth con tinuous global statistics, U W and U D . These results demonstrate that arra y p ermu- tation is clearly inferior in this setting. 6.2. T yp e I err or u nder a simulate d Class 3 nul l. T h e randomized lun g cancer dataset describ ed in Section 4.3 is extended to ev aluate the Typ e I error incurred by p ermutat ion- and b o otstrap-based tests of U W and U D under ( 6.1 ). A S tuden t’s t is used as the lo cal statistic for DE across the sim u lated conditions; und er the assu mption the gene expression v alues ap- pro x im ately follo w normalit y , eac h distr ibutional strata is determined by the asso ciation parameter δ giv en in ( 5.2 ). W e inv estigate d sev eral null h yp othe- ses with K = 2 strata of genes relating to no DE ( δ i = 0) and p ositiv e DE ( δ i = d > 0). T o artificially generate different degrees of DE in a p articular gene, th e expression v alues w er e first standardized to ha ve v ariance 1; then d · p 1 /n 1 + 1 /n 2 w as added to those v alues x ij with condition y j = 1. S im- ulations w ere r un us in g three different lev els of DE, d = 1 , 3 and 5, and also for three prop ortions of DE, β = 1 / 5 , 1 / 3 and 1 / 2. F or eac h prop ortion, we selected a su bset of nonov erlapping categories with the p rop erty that β · m C is an in teger. This r esulted in 41 categ ories b eing considered for β = 1 / 5, 40 catego ries for β = 1 / 3 and 34 categories for β = 1 / 2. T h e selected categories exhibited a wid e r ange of correlatio n in expression, reflectiv e of that seen across the en tire dataset. F or eac h of 1000 0 r andomizations of tumor status, the p ermutatio n - and quan tile b o otstrap-based hyp othesis tests we re conducted using 2000 p er- m u tations and resamples, resp ectiv ely . S im u lations in dicate that B = 200 resamples are t ypically suffi cient for the momen t estimates in the b o otstrap TESTING GENE CA TEGORIES IN MICR OARRA Y S 21 Fig. 3. Performanc e of gene c ate gory tests using b o otstr ap-quantile (gr e en), b o otstr ap-t (r e d), and arr ay p ermutation (blue) metho ds, f or the c ontinuous glob al statistics U W and U D , and various C l ass 3 nul l hyp otheses. The r ange of T yp e I err ors of differ ent c ate gories is shown for (a) f our pr op ortions of DE, β , and (b) for four levels of DE; (c) the aver- age T yp e I err ors of U W and U D for differ ent α levels under a Cl ass 3 nul l wi th d = 3 and β = 1 / 3 ; (d) the T yp e I err or for α = 0 . 05 is plotte d f or e ach c ate gory against their estimate d Cl ass 1 varianc e inflation, 1 + ( m C − 1) · ˆ ρ C , as derive d fr om ( 4.1 ). 22 W. T. BARR Y, A . B. NOBEL AND F. A. WRIGHT t -inte rv als, and were used accordingly . T yp e I err or wa s determined by com- paring the emp ir ically d eriv ed p -v alues to v arious α level s (Figure 3 ). F or a target α = 0 . 05, th e b o otstrap T yp e I error wa s only sligh tly infl ated, and re- mained relativ ely unc hanged r egardless of β and d , whereas th e T yp e I error of p erm utation testing dropp ed dramatically as either parameter div erged from 0. F or d = 3 an d β = 1 / 3, the minimum empirical p -v alues obtained un - der p ermuta tion w ere 0.0055 and 0.001 for U W and U D resp ectiv ely , wh ic h are seve ral ord er s of magnitude higher than w h at w ould b e exp ected with prop er Typ e I error con trol. These findings illustrate the Class 2 tests b ased on arra y p erm utation are o ve rly conserv ativ e under the b r oader n u ll. In order to b etter understand the conserv ativ e b eha vior of arra y p erm utation, we note that it induces a sp ecial case of ( 6.1 ) under which the lo cal statistics are app ro ximately iden tically distribu ted ( 5.1 ). W e retur n to the v ariance of the Wilco xon global statistic derive d in ( 4.5 ), and define the follo wing t yp e of p ositiv ely correlated category . Definition 4. F or lo cal statistics T 1 , . . . , T m with correlations { ρ T i,i ′ } , a category C ⊆ { 1 , . . . , m } will b e called c orr elation dominant if for ev ery { i, i ′ } ∈ C and { h, h ′ } / ∈ C it is true that ρ T i,i ′ ≥ ρ T i,h and ρ T i,h ≤ ρ T h,h ′ , in other w ord s, correlations within the category and its complement are greater than those b et wee n th e category and its complement. In the follo wing th eorem we establish that, for norm ally distribu ted lo cal statistics, the v ariance of the Wilco xon global s tatistic U W is maximized under the K = 1 n ull give n in ( 5.1 ) for all correlation dominant categories. Theorem 2. L et T 1 , . . . , T m b e r andom variables that fol low a multi- variate normal distribution with me ans δ 1 , . . . , δ m , unit varianc es and c orr e - lations { ρ T i,i ′ } . F or a c orr elation dominant gene c ate gory C , the varianc e of U W has a glob al maximum at δ 1 = δ 2 = · · · = δ m = d . Because array p ermutati on ind uces the sp ecial case of ( 6.1 ) wher e the v ari- ance of U W is maxim um, it is reasonable that the tests will tend to b ecome conserv ativ e under C lass 3 n u ll hyp othesis that depart f rom ( 5.1 ). Although the complex structure of gene correlation w ould like ly pr ev ent any real cat- egory from meeting the s tr ict criterion of b eing corr elation dominan t, the conserv ativ eness of arra y p erm u tation tests is seen across all categ ories in the rand omized datasets (Figure 3 ). W e h a v e also confir m ed th ese results in t wo- condition datasets sim u lated from a m u ltiv ariate Gaussian mo d el (not sho w n ). The equal conserv ativ eness of U D remains to b e explored in full de- tail, bu t we suggest that the p o oled-v ariance estimate used in stand ardizing TESTING GENE CA TEGORIES IN MICR OARRA Y S 23 the global s tatistic s similarly ov erestimates the true v ariance in the Class 3 n u ll hyp otheses with more th an 1 stratum of DE. While in the simulations presente d ab o ve b oth b o otstrap m etho ds main- tained their approximat ely corr ect Type I error thr oughout, we ha ve found that in sim ulated expression data with a smaller samp le size of n = 20 arr a ys, the quantile- based metho d b ecomes more ant i-conserv ative at small target α , since man y microarray datasets can b e of this size, and the q u an tile-in terv al also requires more resamples to condu ct tests with sm all α . F urther, as U W is the su m of m C · ( m − m C ) pairw ise comparisons of lo cal statistics, appro x- imate n ormalit y follo ws fr om the C entral Limit T heorem wh en the a v erage correlation b et we en these terms is not extreme and m C is large. Histograms of resampled global statistics confirm that the approximat ion to the norm al distribution is app ropriate for the large num b er of genes in a t yp ical mi- croarra y exp erimen t. Therefore, we p refer the b o otstrap Student’s t -interv al for more general use in Class 3 tests of gene categorie s. 6.3. Power under simulate d alternatives. T o assess the relativ e p ow er of the b o otstrap tests o ver arra y p ermuta tion, alternativ e hyp otheses m u s t b e sp ecified that relate to increased amounts of DE in a gene categ ory . When the differen tial expression of a gene can b e measured in terms of an asso ciation parameter δ , an a v erage increase of DE within the category relativ e to its complemen t can b e written as H A : K X i =1 β C,k · d k > K X i =1 β ¯ C ,k · d k . (6.5) F or these alternativ es, the Wilco xon r ank sum U W is wel l su ited to id en ti- fying in creased amoun ts of DE in a robust mann er. In the rand omized lung carcinoma dataset, realizatio ns of ( 6.5 ) can b e ac hiev ed by app lyin g an additiv e or multiplicat iv e constan t to all gene- sp ecific parameters w ithin th e cate gory . More precisely , if { δ 0 i : i ∈ C } are the asso ciation parameters of a category u nder the Class 3 null, w e consider H A to b e either of the f orm { δ A i = c + δ 0 i : i ∈ C } or { δ A i = c · δ 0 i : i ∈ C } . In this w ay , p o wer curv es can b e disp la ye d across a single axis b y v arying c . Figure 4 illustrates the effects wh en the constan t is applied in an additive mann er for K = 2 strata of DE and nonDE genes, and in a m ultiplicativ e mann er for an example w ith K = 5 strata. The results demonstrate considerable impro v ements in p o wer of the b o otstrap metho d s o ver array p ermutatio n . 7. Analysis of a su rviv al m icroarra y d ataset. The breast cancer sur viv al dataset fr om Ch ang et al. ( 200 5 ) are used to illustrate the u tilit y of b o ot- strap resampling as compared to arr a y p ermutatio n. A total of n = 295 breast cancer s amples w ere analyzed on Agilen t microarra ys, and normal- ized gene expr ession estimates were ob tained for a subset of m = 11176 genes 24 W. T. BARR Y, A . B. NOBEL AND F. A. WRIGHT Fig. 4. Av er age p ower of p ermutation- and b o otstr ap-b ase d gene c ate gory tests as one dep arts fr om C lass 3 nul ls. R esults b ase d on r andomize d micr o arr ay data and r e al GO c ate gories, and applying ( a) an additive c onstant to K = 2 classes of genes with 1 / 3 differ ential l y expr esse d at d = 1 (as shown by the CDF in the inset gr aphs), and (b) a multiplic ative c onstant to K = 5 classes of genes wi th { d k } e qual ly sp ac e d b etwe en 0 and 1 . Both sc enarios exhibi t mor e p ower to dete ct the alternative using the b o otstr ap tests . that are annotated to at least one of 1348 GO terms (details on normaliza- tion, filtering, and formation of gene categories are omitted, but a v ailable from the authors). S urviv al times an d censoring indicators were a v ailable for eac h array . W ald statistics from univ ariate C o x prop ortional h azard mo dels w ere used as lo cal statistics to r efl ect the asso ciation b et ween expression and patien t outcome. W e employ ed the Wilco xon rank-sum U W as a the global statistic for the p ermuta tion and b o otstrap-based tests; results were obtained from 1000 p ermutati ons/resamples of the data, resp ectiv ely . The p -v alues pro d u ced by T able 2 Numb er of signific ant GO c ate gories for tar get α levels Perm Boot-q Boot- t α = 0 . 1 195 222 220 α = 0 . 05 129 157 160 α = 0 . 01 56 72 85 α = 0 . 005 36 63 73 α = 0 . 001 12 40 48 α = 3 . 7 e –5 ∗ NA NA 28 ∗ Bonferroni cutoff. TESTING GENE CA TEGORIES IN MICR OARRA Y S 25 the b o otstrap quan tile and t -in terv als w er e in goo d agreemen t across the set of categories (rank correlation > 0.999 ), reflecting the f act that the dis- tributions of resampled global statistics were nearly normally distributed. The p ermutat ion test also sho wed go o d agreemen t with th e b o otstrap (rank correlation of 0.977 with b o otstrap results), bu t a distinct difference was observ ed in the num b er of categ ories ac hieving v arious lev els of significance (T able 2 ). The impro v ed p o wer of the b o otstrap metho d s is evidenced by the increased num b er of significant categories, w ith 48 d eclared s ignifican t via b o otstrapping at α = 0 . 001, but only 12 d eclared significant via p er- m u tation. The minimal p ossible p -v alue of the p ermutati on and b o otstrap- quan tile tests are limited by the 1000 resamples that were taken of the data. The b o otstrap t -int erv al do es n ot h a ve this restriction, and 28 categories w ere observ ed to pass the conserv ativ e Bonferroni threshold for α = 0 . 05. Because of the iterativ e pro cedu re for estimates from the Cox-prop ortional hazard mo del, taking additional resamp les of the dataset wa s computation- ally in feasible, and w ould b e prohibitiv e when trying to con trol the FWER across such a large n u m b er of categories. 8. Discussion. W e ha ve used the terminology of lo cal and global statis- tics as presente d in SAFE [ Barry , Nob el and W righ t ( 2005 )] to describ e ex- isting m etho ds f or testing differenti al expression w ithin a gene categ ory . By classifying metho d s according to their assumed null hyp otheses, w e illustrate a num b er of shortcomings of these m etho d s. W e prop ose a no ve l b o otstrap- based approac h that u niquely allo w s b oth for genes within a category and its complemen t to b e correlated, and that main tains prop er error con trol under a more biologically sensib le n ull hyp othesis than has b een implicitly used by other metho d s. As a last bu t v ery imp ortan t adv an tage to the b o otstrap-based pro cedu r e, w e note that by resampling with replacement , the b o otstrap can incorp o- rate cov ariate information in a sen sible manner. In p ermutation testing, by inducing a n u ll that breaks th e asso ciation b et ween the resp onse and ex- pression, the co v ariate inform ation can no longer b e linke d to b oth. Thus, a researc her is forced to choose the p art of the data to r emain linked to th e co- v ariate. By resampling the data jointly , the b o otstrap allo ws the relationship b et ween all three v ariable typ es to b e mainta ined. Th e pr op er consideration of co v ariates is ju st one area of p oten tial improv emen t, as gene category testing m ov es to wa r d greater statistical maturit y . APPENDIX A: PROOF TO THEOREM 1 The follo w in g elemen tary lemma is useful in ev aluating the exp ectatio n of U W . 26 W. T. BARR Y, A . B. NOBEL AND F. A. WRIGHT Lemma A.1. L et T 1 and T 2 b e distribute d as G 1 and G 2 and assume that P ( T 1 = T 2 ) = 0 . Define µ ( G 1 , G 2 ) ≡ E [ I { T 1 > T 2 } ] , then µ ( G 1 , G 2 ) = 1 − µ ( G 2 , G 1 ) and µ ( G 1 , G 2 ) = 1 / 2 when G 1 = G 2 . The exp ectation of U W is calculate d by decomp osing the m C · m ¯ C pairwise comparison of T s into th e K 2 differen t terms inv olving µ ( G k , G k ′ ): E [ U W ] = E " X i ∈ C Rank( T i ) # = E " m C · ( m C + 1) 2 + X i ∈ C X h / ∈ C I { T i > T h } # = m C · ( m C + 1) 2 + K X k =1 K X k ′ =1 X i ∈ C F i = G k X h / ∈ C F h = G k ′ µ ( G k , G k ′ ) = m C · ( m C + 1) 2 + K X k =1 K X k ′ =1 m C · β k · m ¯ C · β k ′ · µ ( G k , G k ′ ) = m C · ( m C + 1) 2 + m C · m ¯ C " K X k =1 β 2 k 2 + X k ′ 0 , 2. f (0 , 0) is a g lob al minimum when ρ < 0 , TESTING GENE CA TEGORIES IN MICR OARRA Y S 27 3. f ( x, y ) = 0 when ρ = 0 . Pr oof. The fir st deriv ativ es of f ( x, y ) are ∂ f ∂ x ( x, y ) = ∂ ∂ x (Φ 2 ( x, y ; ρ ) − Φ( x ) · Φ( y )) ∝ Φ y − ρx p 1 − ρ 2 − Φ( y ) and ∂ f ∂ y has an analogous form due to symmetry . Since Φ is a strictly in- creasing fun ction, setting the deriv ativ es equal to zero leads to the follo win g equations: y − ρx = q 1 − ρ 2 · y , x − ρy = q 1 − ρ 2 · x, for whic h { x = 0 , y = 0 } is the only solution when ρ 6 = 0. Since (0 , 0) is the only stationary p oin t, a second d eriv ativ e test can b e used to determine whether it is a global minim u m or m axim um [ Thomas and Finney ( 1992 )]. The second deriv ativ es are solv ed to b e ∂ 2 f ∂ x 2 ( x, y ) = φ ′ ( x ) Φ y − ρx p 1 − ρ 2 − Φ( y ) + φ ( x ) · φ y − ρx p 1 − ρ 2 · − ρ p 1 − ρ 2 , ∂ 2 f ∂ y 2 ( x, y ) = φ ′ ( y ) Φ x − ρy p 1 − ρ 2 − Φ( x ) + φ ( y ) · φ x − ρy p 1 − ρ 2 · − ρ p 1 − ρ 2 , ∂ 2 f ∂ x ∂ y ( x, y ) = φ ( x ) · φ y − ρx p 1 − ρ 2 · 1 p 1 − ρ 2 − φ ( y ) = ∂ 2 f ∂ y ∂ x ( x, y ) . A t the p oin t { x = 0 , y = 0 } the deriv ativ es are equ al to ∂ 2 f ∂ y 2 (0 , 0) = ∂ 2 f ∂ x 2 (0 , 0) = φ (0) 2 · − ρ p 1 − ρ 2 , (B.1) ∂ 2 f ∂ x ∂ y (0 , 0) = ∂ 2 f ∂ y ∂ x (0 , 0) = φ (0) · φ (0) · 1 p 1 − ρ 2 − φ (0) and the discriminant tak es the form D (0 , 0) = ∂ 2 f ∂ x 2 (0 , 0) · ∂ 2 f ∂ y 2 (0 , 0) − ∂ 2 f ∂ x ∂ y (0 , 0) 2 28 W. T. BARR Y, A . B. NOBEL AND F. A. WRIGHT = φ (0) 2 · − ρ p 1 − ρ 2 2 − φ (0) · φ (0) · 1 p 1 − ρ 2 − φ (0) 2 (B.2) = φ (0) 4 ρ 2 1 − ρ 2 − (1 − p 1 − ρ 2 ) 2 1 − ρ 2 = φ (0) 4 · 2 · p 1 − ρ 2 − (1 − ρ 2 ) 1 − ρ 2 . Since p 1 − ρ 2 > (1 − ρ 2 ) for all nonzero ρ ∈ ( − 1 , 1), ( B.2 ) is strictly p osi- tiv e, pro ving that either a minimum or a maxim um m u st exist. F rom the second deriv ativ es in ( B.1 ), one can sho w that f (0 , 0) is a m inim u m w hen ρ < 0 and a maxim um when ρ > 0. Last, f ( x, y ) is exactly 0 wh en ρ = 0 by indep end ence. The v ariance of U W can b e decomp osed usin g the Mann–Whitney form of the s tatistic : V ar[ U W ] = V ar " X i ∈ C Rank( T i ) # = V ar " m C · ( m C + 1) 2 + X i ∈ C X h ∈ ¯ C I { T i > T h } # (B.3) = X i ∈ C X i ′ ∈ C X h / ∈ C X h ′ / ∈ C Co v [ I { T i > T h } , I { T i ′ > T h ′ } ] , where Co v [ I { T i > T h } , I { T i ′ > T h ′ } ] = E [ I { T i > T h } · I { T i ′ > T h ′ } ] − E [ I { T i > T h } ] · E [ I { T i ′ > T h ′ } ] = P ( { T h − T i < 0 } ∩ { T h ′ − T i ′ < 0 } ) − P ( T h − T i < 0) × P ( T h ′ − T i ′ < 0) . Under ( 6.1 ) and the Gaussian assumption, the paired d ifferen ces in lo- cal statistics follo w noncen tral b iv ariate norm al distribu tions with marginal means δ h − δ i and δ h ′ − δ i ′ . Eac h co v ariance term can b e written as Φ 2 ( δ h − δ i , δ h ′ − δ i ′ ; ρ ) − Φ( δ h − δ i ) · Φ( δ h ′ − δ i ′ ) , (B.4) where Φ and Φ 2 represent th e CDFs of a univ ariate and biv ariate n ormal distributions with unit v ariance, an d ρ is defined as ρ = ρ T i,i ′ + ρ T h,h ′ − ρ T i ′ ,h − ρ T i,h ′ q (2 − 2 ρ T i,h ) · (2 − 2 ρ T i ′ ,h ′ ) . (B.5) TESTING GENE CA TEGORIES IN MICR OARRA Y S 29 W e consider in turn the sev er al forms of ρ that arise in ( B.4 ). When i = i ′ and h = h ′ , ρ is p rop ortional to 2 − 2 · ρ T i,h , wh ic h is a p ositiv e quan tit y except wh en the genes are p erfectly correlated wh ic h is ruled out b y the d efinition of a correlation dominant category . F rom Lemma B.2 , ( B.3 ) is maximized when δ i = δ h . Sin ce th is is true f or all { i, h } pairs of category and complement genes, a global maxim u m of the summed co v ariances will o ccur w hen all lo cal statistics hav e the same mean. When i = i ′ and h 6 = h ′ , ρ is prop ortional to 1 + ρ T i,i ′ − ρ T i ′ ,h − ρ T i,h ′ and will b e greater than 0 for a correlatio n dominant category suc h that a maximum o ccurs w hen δ i = δ h = δ h ′ . An analogous argument holds for when i 6 = i ′ and h = h ′ . F or i 6 = i ′ and h 6 = h ′ , either ρ will b e p ositiv e if ( ρ T i,i ′ + ρ T h,h ′ ) > ( ρ T i ′ ,h + ρ T i,h ′ ) so that ( B.4 ) is maximized w hen δ h = δ i and δ h ′ = δ i ′ , or ρ will b e exactly 0 if ( ρ T i,i ′ + ρ T h,h ′ ) = ( ρ T i ′ ,h + ρ T i,h ′ ) and ( B.4 ) will b e constant. Th is inequalit y of summed correlations is again guaran teed for corr elation dominant categ ories. This prov es a global maxim um f or V ar[ U W ] is ac h iev ed at δ 1 = δ 2 = · · · = δ m = d since only in this case will every co v ariance term in ( B.3 ) b e either maximized, or a constant . SUPPLEMENT AR Y MA TERIAL Supp lemen t A: Measures of differen tial expression in gene category test- ing (Figure) (doi: 10.121 4/07-A OAS146 S UPP A ; .p d f ). In gene category test- ing, global statist ics t ypically fall in to t wo groups: “categorica l” statistics that rely on a list of significan t genes to b e identified, and “con tinuous” statistics that incorp orate real-v alued measures of gene-sp ecific differen tial expression. The follo wing fi gure illustrates the tw o data t y p es using the no- tation fr amew ork d escrib ed in the article. Supp lemen t B: V ariance of the Wilco xon rank sum statistic und er cor- relation (Theorem) (doi: 10.121 4/07-A OAS146 S UPPB ; .p df ). The v ariance of the Wilco xon rank su m global statistic in equation (4.5) is derived in the follo wing theorem un der the assumption of d ep endent and iden tically dis- tributed Gaussian lo cal statistics. The pr o of is pr esen ted using the notation framew ork d escrib ed in th e article, and is analogous to the classic w ork of Gast wirth and Ru bin. REFERENCES Allison, D. B., Cui, X . Q., P age, G. P. et al. (2006). Microarra y data analysis: F rom disarra y to consolidation and consensus. Natur e R eviews Genetics 7 55–65. Ashburner, M., B all, C. A., B lake, J. A., Botstein, D. , B u tler, H., Cherr y, J. M., Da vis, A. P., Dolinski, K., Dwight, S. S ., Eppig, J. T., Harris, M. A ., Hill, D . P., Issel-T ar ve r, L., Kasarskis, A., Lewis, S., Ma tese, J. C., Richard- son, J. E., Ringw ald, M., Rubin, G. M. and She rlock, G. ( 2000). Gene O ntol ogy: 30 W. T. BARR Y, A . B. NOBEL AND F. A. WRIGHT T o ol for the un ification of biology . The Gene O ntol ogy Consortium. Nat. Genet. 25 25–29. Barr y, W . T., Nobel, A. B. and Wright, F. A. (2005). Significance analysis of func- tional categories in gene expression stu dies: A structured p erm utation app roac h. Bioin- formatics 21 1943–1949. Barr y, W. T., Nobel, A. B. and Wrigh t, F. A. (2008). Supp lemen t to “A statistical framew ork for testing functional categories in microarray data.” DOI: 10.1214/07-A OAS146SUPP A , DOI: 10.1214 /07-AOAS146SUPPB . Beißbar th, T. and Sp eed, T . P. (2004). GOstat: Find statistically ov errepresented Gene Ontologies within a group of genes. Bioinformatics 20 1464–1465. Ben-shaul, Y ., Bergman, H. and Soreq, H. (2005). Identifying subtle interrelated changes in functional gene categories using continuous measures of gene ex pression. Bioinformatics 21 1129–1137. Bha tt a charjee, A ., Richards, W. G., St aunton, J., Li, C., Monti, S., V asa, P., Ladd, C., Beheshti , J., Bue n o, R., Gillette, M., Loda, M., Weber, G., Mark, E. J., Lander, E. S., Wong, W ., Johnson, B. E., Golub, T. R., Sugarbaker, D. J. and Me yerson, M. (2001). Classification of human lung carcinomas by mRNA expression profiling reveals distinct adeno carcinoma sub classes. Pr o c. Natl. A c ad. Sci. USA 98 13790–13 795. Boorsma, A., Fo a t, B. C ., Vis, D., Klis, F. and B ussemaker, H. J. (2005). T-profiler: scoring the activity of predefi n ed groups of genes using gene ex pression data. Nucleic A cids R ese ar ch 33 W592–W595 . Casella, G. and Berger, R. L . (2002). Statistic al Infer enc e , 2nd ed. Duxb ury , A ustralia. MR1051420 Chang, H. Y., Nu yten, D. S. A., S neddon, J. B., Hastie, T., T ibshirani, R., Sorlie, T., Dai, H. Y., He, Y. D. D., Vee r, L. J. V., Bar telink, H., de Ri jn, M. V. , Bro wn, P. O. and de Vi jver, M. J. V . (2005). Robustness, scalabilit y , and integration of a w ound- response gene expression signature in predicting b reast cancer surviva l. Pr o c. Natl. A c ad. Sci. USA 102 3738–37 43. Damian, D. and Gorfine , M. (2004). S tatistical concerns about the GSEA pro cedure. Natur e Genetics 36 663. Dodd, L. E., Sengupt a, S., Chen, I. H., d en Boon, J. A., Cheng, Y. J., We stra, W., Newton, M. A., Mittl, B. F., McShane , L., Chen, C. J., Ahlquist, P. and Hildesheim , A . (2006). Genes inv olved in D NA repair and nitrosamine metab olism and those lo cated on chromosome 14q32 are dysregulated in nasopharyngeal carcinoma. Canc er Epi demiolo gy Biomarkers and Pr evention 15 2216–222 5. Draghici, S., Kha tri, P., Mar tins, R. P., Osterm eier, G. C. and Kra wetz, S. A. (2003). Global functional profiling of gene expression. Genomics 81 98–104. Dudoit, S., Keles, S. and v an der Laan, M. J. (2007). Multipl e T ests of Asso ciation with Biol o gic al Annotat ion Metadata . Sp ringer, New Y ork. Dudoit, S., Y ang , Y. H., Callow, M. J. and Speed , T. P. ( 2002). Statistical metho ds for identif ying differentially expressed genes in replicated cDNA microarra y exp eri- ments. Statist. Sinic a 12 111–139. MR1894191 Efr on, B. (1979). Bootstrap metho ds: Another look at the jackknife. Ann. Statist. 7 1–26 . MR0515681 Efr on, B. ( 1987). Better b o otstrap confidence interv als. J. Amer. Statist. Asso c. 82 171– 185. MR0883345 Efr on, B. and T ibshirani, R. J. (1998). An Intr o duction to the Bo otstr ap , 2nd ed . Chapman and Hall/CRC , New Y ork. MR1270903 TESTING GENE CA TEGORIES IN MICR OARRA Y S 31 Efr on, B. and Ti bshirani, R. (2007). On testing t h e significance of sets of genes. Ann. Applie d Statist. 1 107–129. Galitski, T., S a ld anha, A. J., S tyles, C. A., Lander, E. S . and Fink, G . R. (1999). Ploidy regulation of gene expression. Scienc e 285 251–254. Gastwir th, J. L. and Rubin, H. (1971). Effect of dep end ence on the lev el of some one-sample tests. J. Amer. Statist. Asso c. 66 816–820. MR0314192 Goeman, J. J. and Buhlmann, P. (2007). Analyzing gene exp ression d ata in terms of gene sets: Metho dological issues. Bi oinformatics 23 980–987. Hall, P. and W i lson, S. R. (1991). Two guidelines for b ootstrap hyp othesis testing. Biometrics 47 757–762. MR1132543 Kim, S.-Y. and Volsky, D . J. (2005). Parametri c analysis of gene set enrichmen t. BMC Bioinformatics 6 144. Lee, H. K., Hsu, A. K., Sajdak, J., Qin, J. and P a vlidis, P. (2004). Co expression analysis of human genes across many microarra y data sets. Genome R ese ar ch 14 1085– 1094. Mootha, V. K., Lindgren, C. M., Eriksson, K. F., Subramanian, A ., Sihag, S., Lehar, J., Puigser v er, P., Carlsson, E., R idderstrale, M., Laurila, E., Houstis, N., Dal y , M. J., P a tterson, N., Mesiro v , J. P., Golub, T . R., T ama yo, P., Sp iegelman, B., Land e r, E. S., Hirschhorn, J. N., Al tshuler, D. and G r oop, L. C. (2003). PGC-1alpha-resp onsive genes invo lve d in o x idativ e phosph orylation are coordinately d o wnregulated in human diab etes. Nat. Genet. 34 267–273. Newton, M. A., Noue i r y, A., Sarkar, D. and A hlquist, P. (2004). Detecting d iffer- entia l gene expression with a semiparametric hierarc h ical mixture metho d. Biostatistics 5 155–176. P a vlidis, P., Qin, J., Arango, V., Mann, J. J. and S ibille, E. (2004). Using the gene ontol ogy for microarra y data mining: A comparison of metho ds and application to age effects in human prefrontal cortex . Neur o chemic al R ese ar ch 29 1213–1 222. Pearson, K. (1911). on the prob ab ility th at tw o indep endent distributions of frequen cy are really samples from th e same p opulation. Biometrika 8 250–254 . Subramanian, A., T ama yo, P., Mootha, V. K., Mukherjee, S ., Eber t, B. L., Gillette, M. A., P aulo vich, A., Pomero y, S. L., Golub, T. R., Land er, E. S. and Mesiro v, J. P. (2005). Gene set enrichment analysis: A kno wledge-based ap - proac h for interpreting genome-wide exp ression profiles. Pr o c. Natl. A c ad. Sci. USA 102 15545–15550. Thomas, G. B. J. and Fi n ney, R. L. (1992). Maxima , Mi nima , and Sadd le Poi nts , 8th ed. A ddison-W esley , Reading, MA. Tusher, V. G., Tibshirani , R. and Chu, G. (2001). S ignificance analysis of microarrays applied t o the ionizing radiation resp onse. Pr o c. N atl. A c ad. Sci. USA 98 5116–5121. Vir t anev a, K. I., Wright, F. A., T anner, S. M., Y uan, B ., Lemon, W. J., Caligiuri, M. A., Bloomfield, C. D., de la Chapelle, A. and Krahe, R. (2001). Expression profiling reveals fundamental biological differences in acute my eloid leukemia with isolated trisomy 8 and normal cytogenetics. Pr o c. Natl. A c ad. Sci. USA 98 1124–1129. Zhong, S., Storch, K. F., Lip an , O., Kao, M. C., We itz, C. J. and Wong, W. H. (2004). GoSurfer: A graphical interactiv e to ol for comparative analysis of large gene sets in gene onto logy space. Appl. Bioinformatics 3 261–264. 32 W. T. BARR Y, A . B. NOBEL AND F. A. WRIGHT W. T. Barr y Dep ar tment of Biost a tistics and Bioinforma tics Duke University Medical Center Durham, Nor th Carolina 27710 USA E-mail: bill.barry@duke.edu A. B. Nob el Dep ar tment of St a tistics and Opera tions Research University of Nor th Carolina at Chapel Hill Chapel Hill, Nor th Carolina 27599-3 260 USA E-mail: nobel@email. unc.edu F. A. Wrigh t Dep ar tment of Biost a tistics University of Nor th Carolina a t Chapel Hill Chapel Hill, Nor th Carolina 25599-7 420 USA E-mail: fwright@bios.unc.edu
Original Paper
Loading high-quality paper...
Comments & Academic Discussion
Loading comments...
Leave a Comment