False discovery rate analysis of brain diffusion direction maps
Diffusion tensor imaging (DTI) is a novel modality of magnetic resonance imaging that allows noninvasive mapping of the brain's white matter. A particular map derived from DTI measurements is a map of water principal diffusion directions, which are p…
Authors: Armin Schwartzman, Robert F. Dougherty, Jonathan E. Taylor
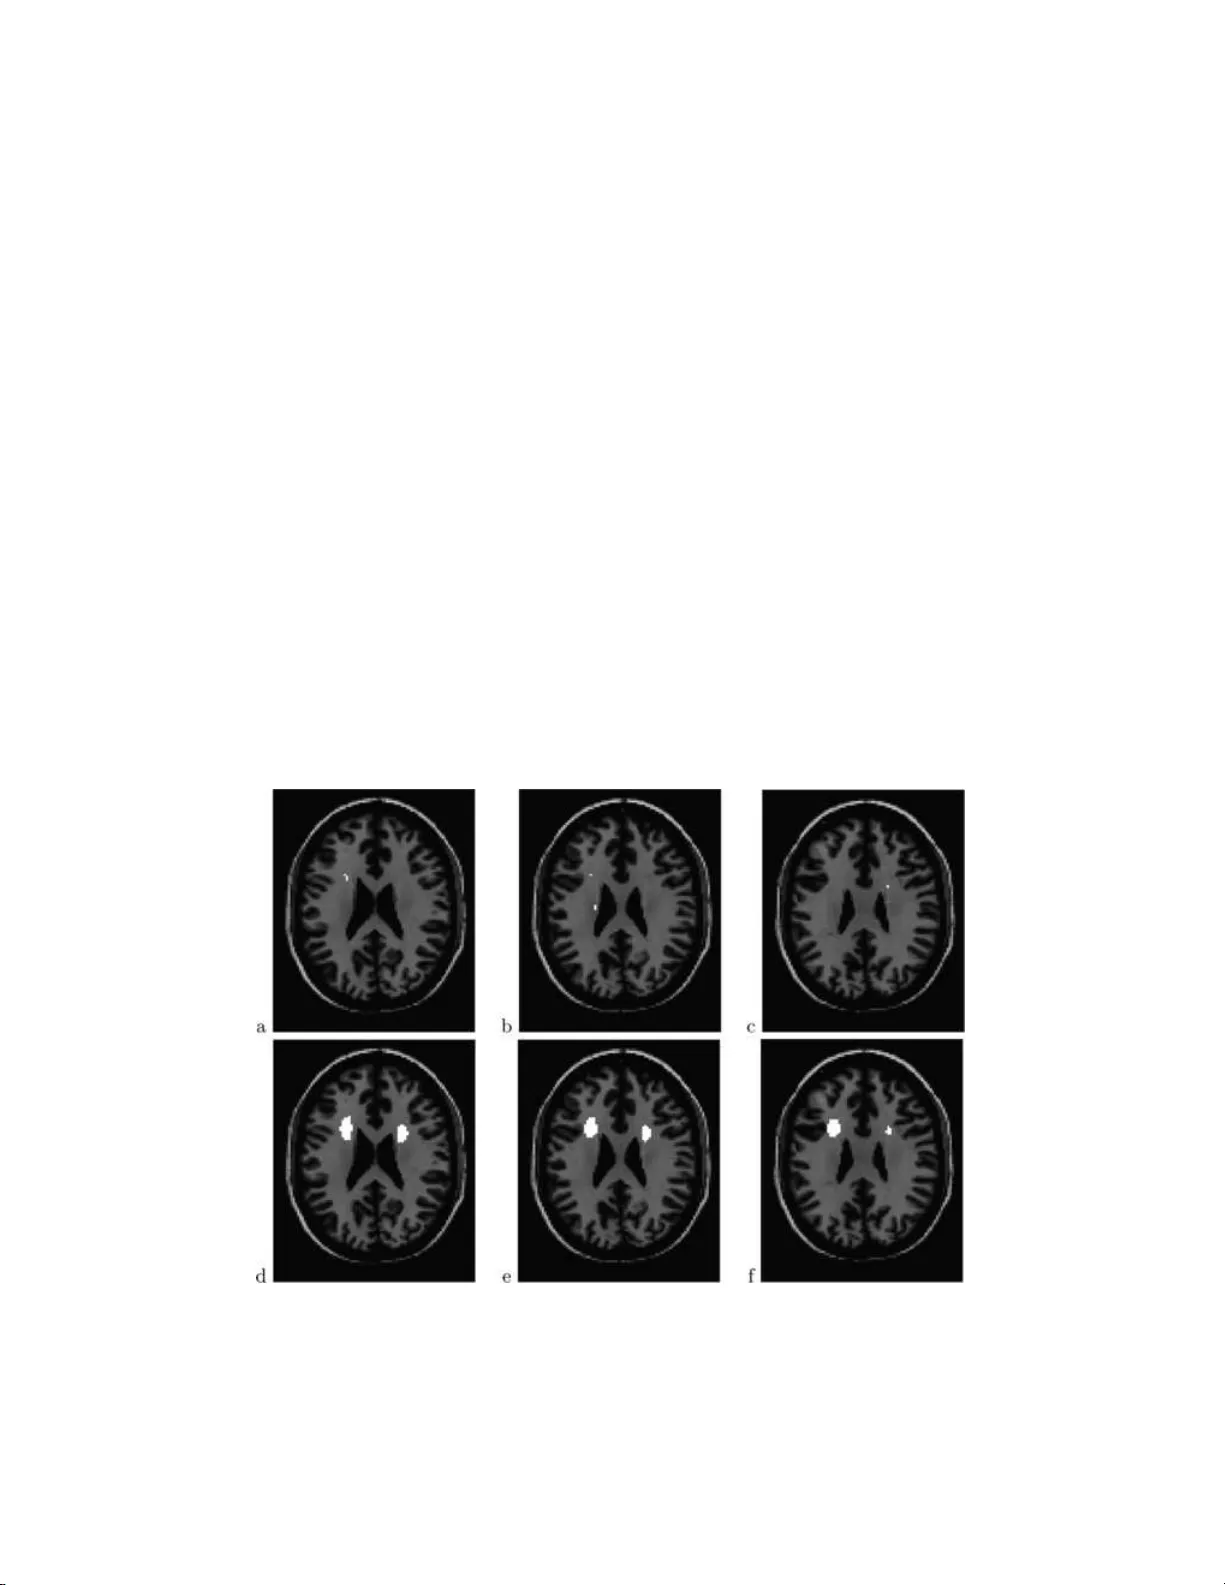
The Annals of Applie d Statistics 2008, V ol. 2, No. 1, 153–175 DOI: 10.1214 /07-A OAS133 c Institute of Mathematical Statistics , 2 008 F ALSE DISCOVER Y RA TE ANAL Y S IS OF BRAIN DIFFUS ION DIRECTION MAPS By Armin Sch w ar tzman, 1 R ob er t F. Dougher t y 2 and Jona than E. T a ylor 3 Harvar d Scho ol of Public He alth , Stanfor d Univ ersity and Stanfor d University Diffusion tensor imaging (DTI) is a nov el modality of magnetic resonance imaging that allow s noninv asive mapping of th e brain’s white matter. A particular map derived from DTI measuremen ts is a map of water principal diffusion directions, whic h are proxies for neural fib er directions. W e consider a study in which d iffu sion direc- tion maps were acquired for t wo groups of sub jects. The ob jective of the analysis i s to find re gions of the brain in whic h the cor respond - ing d iffusion directions differ b etw een the groups. This is attained by first computing a test statistic for the difference in direction at every brain location using a W atson model for d irectional data. In- teresting lo cations are sub sequently selected with contro l of the false disco very rate. More accurate mo deling of the null distribu t ion is obtained using an emp irical n ull d ensit y bas ed o n the empirical dis- tribution of the test statistics acros s th e brain. F urth er, substantial impro vemen ts in p o wer are achiev ed by lo cal spatial ave raging of t he test statistic map. Alth ough the focus is on one p articular study and imaging tec h nology , the proposed inference metho ds can be applied to other large scale sim ultaneous h yp othesis testing problems with a conti nuous un derlying spatial structure. 1. Int r o duction. A cen tr al statistical p roblem in brain imaging s tu dies is to find areas of the b rain that differ b et ween t wo groups of sub jects, namely , a con trol group and another group with a sp ecial c haracteristic of in terest. Diffusion tensor imaging (DTI) is a mo dalit y of MRI that allo ws insigh t into Received Ap ril 2007; revised Ap ril 2007. 1 Supp orted in p art by a William R. and Sara Hart Kim ball Stanford Graduate F ellow - ship. 2 Supp orted by t h e Sch wab F oundation for Learning a nd N I H Gran t EY-01-5000 . 3 Supp orted by N SF Grant DMS-04-05970. Key wor ds and phr ases. Diffusio n tensor imaging, directional statistics, multiple test- ing, empirical n ull, spatial smo othing. This is an electronic reprin t of the original article published b y the Institute of Mathema tical Sta tistics in The Annals of Applie d Statist ics , 2008, V ol. 2, No. 1, 153– 175 . This reprint differs from the original in pag ination and t yp ographic detail. 1 2 A. SCHW A R TZMAN, R. F. DO UGHER TY AND J. E. T A YLOR the brain’s wh ite matter. As opp osed to fun ctional MRI, wh ich shows b rain activit y , DTI rev eals anatomical structure. DTI measures th e d iffusion of w ater molecules in tissu e [ Bammer et al. ( 2002 ), Basser and Pierpaoli ( 1996 ) and Le Bihan et al. ( 2001 )]. S ince the m o v emen t of wa ter is affected by the cell structure, the pattern of diffusion is an indicator of the microscopic prop erties of the tissue. DTI d ata differ fun damen tally from con ven tional imaging d ata in that v alues at eac h sp atial lo cation are n ot scalars b u t 3 × 3 p ositiv e definite matrices, also called diffusion tensors (DTs). T he DT at a lo cation in sp ace can b e th ough t of as the co v ariance matrix of a 3D Gaussian distribution that mo dels the lo cal Brownian motion of the w ater m olecules in that lo cation. The DTs are measured at discrete v olum e elemen ts called v oxe ls arranged in a r egular spatial grid. V o xels are t ypically ab out 2 mm in size. A typica l DT image of the entire b rain ma y conta in a few h u ndred thousand vo xels. Because of familiarit y with scalar statistics, inv estigators fr equen tly re- strict their analysis of DTI data to scalar quant ities d eriv ed from the DT [e.g., Bammer et al. ( 2000 ) and Deutsc h et al. ( 2005 )]. Th e tw o most imp or- tan t s u c h qu antites are trace and fractional an isotropy (F A), b oth fun ctions of the DT’s eigen v alues related resp ectiv ely to the total amount of d iffusion and the degree of anisotrop y within a vo xel. The most imp ortan t nonscalar quan tit y derive d from the DT is the pr incipal diffusion direction, defined as the eigen v ector corresp ondin g to the largest eigen v alue of th e DT. It is generally assum ed that diffu sion is r estricted in the d irection p erp endicu- lar to the nerv e fib ers, so the principal diffusion direction provides a proxy for the fib er dir ection within the v oxe l [ Le Bihan et al. ( 2001 )]. Thus, in- ference ab out the principal diffusion direction is v aluable for und erstanding where in the brain d ifferen t neural fib er s may b e dir ected to. Th e other t wo eigenv ectors are not as easily inte rpretable. F ortu n ately , there is a ric h literature in directional statistics that can help with this pr ob lem. T o the b est of our kn o wledge, the first attempt to formally analyze p rincipal dif- fusion direction maps in a m ulti-sub ject stu dy has b een rep orted by th e authors [ Sc hw artzman et al. ( 2005 )]. The present article is an extension of the analysis rep orted there. Giv en t w o s ets of principal diffusion direction maps, the task at hand is to find regions that d iffer b et wee n the tw o groups. After app ropriate spatial registration so that all images are aligned in the s ame co ordin ate system, the analysis can b e b rok en down into t wo main steps : (1) Computation of a statistic that tests the difference b et wee n group mean d irections at ev ery v oxe l; (2) In f erence on th e o ve rall test statistic map. F or step one, we use a pr obabilit y mo del for the principal d iffusion direc- tion giv en by the bip olar W atson distribution on the un it sphere [ Best and Fisher ( 1986 ), Mardia and Ju pp ( 2000 ) and W atson ( 1965 )]. W e c hose this d istri- bution b ecause it is one of th e simplest that p ossesses the p rop ert y of b eing FDR ANA L YSIS O F BRAIN DIFFU SION DIRECTION MAPS 3 an tip o dally symmetric, giving to eac h direction and its negativ e the same probabilit y . Th is is crucial b ecause the DT is inv arian t u nder sign changes of the p rincipal eigen vec tor. Th is particular mo d el leads to appropr iate defini- tions of mean direction an d disp ers ion f or a random samp le of directions, as w ell as a test s tatistic for testing w h ether tw o samples of directions, that is, same v o xel across t wo groups of su b jects, ha ve the same mean. According to this mo del, the test statistic u nder the null hyp othesis has an approximat e F distribu tion for fix ed sample size, asymptotically as the samples b ecome more concen trated around th eir mean. This is usefu l wh en the n u m b er of sub jects is small, as it is generally the case in imaging studies. The second step in the analysis corresp onds to solving a m u ltiple testing problem among a large n u m b er of v oxe ls. F or this we use the pro cedure by Storey , T a ylor and Siegmund ( 2004 ) that con trols the false discov ery rate (FDR). FDR inference has b een applied su ccessfu lly to microarra y analy- sis [e.g., Efron et al. ( 2001 ) and Ef ron ( 2004 )], but is still a relativ ely new tec hnique in b r ain imaging [Geno vese, Lazar and Nic hols ( 2002 ) and Pac i- fico et al. ( 2004 )], where, in con trast, the usu al approac h has b een cont rol of the family-wise error rate (FWER) usin g Gaussian random field theory [ W orsley et al. ( 1996 )]. A p ractical reason for our c ho osing FDR o ve r FWER is that the Storey , T a ylor and Siegm un d ( 2004 ) p ro cedure dep ends only on the marginal distribution of the test statistics, wh ile FWER con tr ol would require knowledge of the co v ariance prop erties of the random field d efined b y th e test statistics. Th is is relev an t b ecause the marginal distribution of the W atson statistic is easy to estimate, while the field prop erties are not. A metho dological reason for usin g FDR is that sometimes researchers are not so interested in cont rolling the error o ver the en tire searc h region b ut rather findin g interesti ng r egions that could b e further inv estigate d. F or this reason it is appr opriate to use the con v entio n in tr o d uced b y Efron ( 2004 ) of calling the selected vo xels “in teresting.” The inno v ativ e asp ects of the statistical analysis are tw ofold. The first is a new empirical null for global mo d eling of the test statistic. Since the num b er of sub j ects is s mall, a parsimonious m o del (su c h as the W atson) is needed at eac h vo x el. On the other hand, the n u m b er of vo xels is large, so more accurate mo deling of the n ull distribution of the test statistic can b e ob- tained by considering global parameters common to all vo xels. These global parameters are fi t based on the emp irical distr ib ution of the test statistic among v oxels that ma y b e considered to b elong to the null class. Th is em- pirical null concept was originally sugge sted f or z -scores in a microarra y exp eriment setting [ Efron ( 2004 )]. W e introd uce here a new version of the empirical n u ll adapted to the F nature of the W atson test statistic. The second innov ativ e asp ect is the increase of p ow er in FDR in ference through s p atial smo othing. An imp ortant d istinction b et wee n the multiple testing p roblems in brain imaging and microarray analysis is that the former 4 A. SCHW A R TZMAN, R. F. DOUGH ER TY A ND J. E. T A YLOR are accompanied by a spatial stru cture. W e tak e adv anta ge of this p r op ert y to increase statistica l p o wer b y applying lo cal spatial a ve raging, whic h re- duces the noise v ariance. While routinely used in image pro cessing, the effect of sp atial smo othing on FDR inference is only starting to b e studied [P aci- fico et al. ( 2004 )]. Here the empirical null helps again assess the marginal n u ll distr ib ution of the test statistic after smo othing. The article is organized as follo ws. S ection 2 describ es the d ata. S ection 3 , together with the App endix , summarize the r elev an t features of the W atson distribution. S ection 4 describ es the FDR inferen ce, including the empirical n u ll and th e lo cal av eraging. Th e data analysis is integrat ed into Sections 3 and 4 and follo w s along w ith th e theory . F urther ev aluation and criticism of the analysis results are offered in Section 5 . 2. The data. Our p articular dataset concerns an observ ational study of anatomical differences related to reading abilit y in c hildr en, condu cted by a research team at Stanford Universit y that included one of th e authors (RFD). Th e study w as motiv ated by a pr evious rep ort of anatomical evi- dence of d yslexia in adults [ Klin b erg et al. ( 2000 )]. Two groups of c h ildren w ere recru ited for the stud y: a con trol group consisting of children with nor- mal reading abilities and a case group of c hildr en with a pr evious diagnosis of dyslexia. The sub jects we r e ph ysically and mental ly health y , strongly righ t-hand ed, 7–13 y ears of age, h ad English as their p rimary language and in telligence within the a verage range. There were no significan t group dif- ferences in age, gender, parent al education or so cio economic status. More details on the study and the image acquisition are giv en in Deutsc h et al. ( 2005 ). The data set consists of 12 diffusion direction maps, of wh ic h 6 b elong to the control group and 6 to the d yslexic group. Eac h d iffu sion direction map is a 95 × 79 × 68 array of vo xels representi ng spatial lo cations in a rectangular grid with 2 × 2 × 3 mm regular spacings. T o ev ery v oxe l corresp onds a un it v ector in R 3 that indicates the principal diffus ion direction at that vo xel. These vecto r s actually rep r esen t axes in the sense th at the vecto r s x and − x are equiv alen t. F or th e pur p oses of statistical analysis, all diffu sion direction maps are assumed to b e aligned in the same co ordinate system so that eac h v o xel corresp onds to the same b rain stru ctur e across all sub jects. Since sub jects ha ve differen t head sizes and shap es and ma y lie slightly differen tly in the scanner, co-registrat ion of the im ages was necessary . The common co ordi- nate system used here is a standard called the MNI template. The vertica l z axis corresp onds to the inferior-su p erior dir ection for a sub ject s tanding u p, lo oking forwa r d. T he origin is lo cated at an anatomical land mark lo w near the cen ter of the br ain called the an terior commissure. In br ief, for eac h su b- ject, b oth linear an d nonlinear trans f ormation p arameters we re compu ted FDR ANA L YSIS O F BRAIN DIFFU SION DIRECTION MAPS 5 from that sub j ect’s scalar MRI intensit y image by min imizing the squ are error difference b et ween th e transf ormed image and the template. The DTs w ere then inte rp olated en try w ise in the transformed grid and p rincipal d if - fusion directions w ere recompu ted from the DTs at the n ew lo cations. The principal d iffu sion directions w ere then reorien ted b y applying the lin ear p ortion of the transf ormation and renormalizing to un it length. F or m ore details on this pr o cess, s ee Sc hw artzman, Doughert y and T a ylor ( 2005 ). Brain inv estigato rs often r estrict their image analyses to a su bset of the brain, called searc h region or mask, that is relev ant to the particular s tudy . The purp ose is to increase significance by red ucing the data v olume and the m u ltiple comparisons pr oblem. A trade-off exists b ecause a s earc h region that is to o small will exclude other regions of the b r ain wh ere in teresting differences ma y b e foun d. Sin ce DTI is p articularly go o d at imaging the white matter of the brain, the search region in this study wa s defined as v oxe ls that had a high pr obabilit y of b eing within the white matter for all sub jects [Sc h wartzman, Doughert y and T aylo r ( 2005 )]. In our case, the white matter mask con tains N = 20931 v o xels. A p revious analysis of this dataset [ Deutsch et al. ( 2005 )] u sed scalar F A images in s tead of the prin cipal diffusion d irection maps, and fo cused on a small white matter region (120 vo xels). O ur analysis searc hes for differences in principal diffusion direction o ver a muc h larger wh ite matter region (2093 1 v oxe ls) and reve als differences in gross anatomical s tr ucture in other parts of the white matter that are in visib le to statistical analyses of F A. Examples of diffus ion d irection maps are shown in Figure 1 (these are not maps of individual s ub jects bu t rather the av erage m ap s for eac h group, as describ ed in Section 3 ; the d ata structure, ho wev er, is the same). 3. Statistics f or diffus ion directions. 3.1. The bip olar Watson distribution. Giv en th e sign ambiguit y p rop- ert y of diffusion d irections, it is appropriate to consider probabilit y den s it y functions on the sph ere that are an tip o d ally symmetric. I f x is a random unit vect or in R 3 , we require that the d ensit y f ( x ) satisfies f ( x ) = f ( − x ). One of th e simplest mo dels with this prop erty is the b ip olar W atson distri- bution [ W atson ( 1965 )], wh ose d ensit y is giv en by [ Mardia and Ju pp ( 2000 ), page 181]: f ( x ; µ, κ ) = C ( κ ) exp ( κ ( µ T x ) 2 ) . (1) The p arameter µ is a u nit v ector called m ean direction and κ is a p ositiv e constan t called concen tration parameter. Th e W atson distribution can b e though t of as a symmetrization of the Fisher–V on Mises distribution for unit v ectors on the sphere, whose density is C ( κ ) exp( κµ T x ). Th e squ ared exp onent in ( 1 ) ensu res the required antipo d al symm etry . The d ensit y has 6 A. SCHW A R TZMAN, R. F. DOUGH ER TY A ND J. E. T A YLOR Fig. 1. Me an diffusion di r e ction map for c ontr ol gr oup (a) and dyslexic gr oup (b) at tr ansverse (axial) slic e z = 23 mm. Colors indic ate c o or dinate dir e ctions: sup erior-inferior (blue), right-left (r e d) and anterior-p osterior (gr e en). The figur e was c onstructe d by taking the absolute value of the ve ctor entries of the diffusion dir e ction at e ach voxel and mapping e ach (now p ositive) entry to a sc ale in the c orr esp onding c olor. Mixe d c olors r epr esent dir e ctions that ar e oblique to the c o or dinate axes. The white m atter mask is deli ne ate d by the c olor e d ar e a. The gr ay b ackgr ound i s a standar d T1-weighte d M RI sc alar i mage of the same sli c e, sup erimp ose d for vi sual r efer enc e. Two maj or br ain structur es ar e visible i n this pictur e: the c or ona r adi ata (blue vertic al strip es on b oth sides of the br ain) c ontains fib ers that run sup erior-inferior and c onne ct br ainstem and c er eb el lar r e gions at b ottom of the br ai n with c ortic al r e gions at the top of the br ain; the c orpus c al losum (r e d) c onne cts the left and right br ain hemispher es. Notic e the differ enc e in dir e ction i n the upp er left c orner of the white matter mask (r e d in the c ontr ol gr oup, blue in the dyslexic gr oup). maxima at ± µ and b ecomes more concentrate d around ± µ as κ increases. The dens it y is also rotationall y inv arian t around ± µ . T he normalizing con- stan t C ( κ ) is not needed for the comparison metho ds used h ere. It is n ev er- theless includ ed in th e app endix for completeness. More complex mo dels exist for axial data. F or instance, the Bingham dis- tribution [ Mardia and J upp ( 2000 ), page 181] allo ws mo deling data without assuming rotational inv ariance ab out the mean axis. Th e b enefit of fl exibil- it y in suc h mo dels is outw eigh ted by the cost in degrees of freedom for th e estimation of the additional parameters. Giv en the small num b er of s ub jects in our data, the simpler W atson mo del is preferab le. More flexible mo d eling is in corp orated instead through the empirical null (Section 4 ). 3.2. Me an dir e ction and disp e rsion. Let x 1 , . . . , x n b e a samp le of un- signed random un it ve ctors in R 3 . In our data these w ould b e principal FDR ANA L YSIS O F BRAIN DIFFU SION DIRECTION MAPS 7 diffusion directions fr om a single vo xel for eac h of n su b jects. Because the data is sign inv ariant, the direct a verage is not w ell defined. Instead, the sample mean direction ¯ x is defined as the pr incipal eigen v ector (i.e., the eigen v ector corresp ond ing to the largest eigen v alue) of the scatter matrix S = 1 n n X i =1 x i x T i . (2) S ma y b e interpreted as the empirical co v ariance of the p oin ts d etermined b y x 1 , . . . , x n on the spher e. Intuitiv ely , if th e p oin ts on the sp here ha ve a preferen tial d irection, then, as a group, they are also fu r ther apart in space from their an tip o des. The principal eigen v ector of the scatter matrix p oin ts in th e direction of maximal v ariance in space, wh ic h is the preferential direction for the p oin ts on the sphere. It can b e sh o wn (see th e App endix ) that ¯ x is the maxim u m lik eliho o d estimat or of the lo cation parameter µ when x 1 , . . . , x n are i.i.d. samples from the W atson mo del. The sample disp ersion is defined as s = 1 − γ , where γ is the largest eigen v alue of S . In tuitiv ely , when the sample is concent rated aroun d the mean, the an tip o des are far apart as a group and so the prin cipal v ariance γ is close to 1, giving a disp ersion s that is close to 0. Conv ersely , wh en the sample is u niformly scattered on the sphere, the fact that trace( S ) = 1 dictates that the three eigen v alues are equal to 1 / 3. The disp ersion s in that case tak es its maxim um v alue of 2 / 3. It can b e sho wn (see the App endix ) that s is the maximum lik eliho o d estimate of 1 /κ in the W atson mo del, asymptotically wh en κ → ∞ . Since κ con trols concen tration, this is consisten t with s as a m easur e of d isp ersion. A usefu l in terpretation of s in units of angle is obtained by computing the quanti t y arcsin( √ s ), w h ic h we call the angle disp ersion of the sample. This definition is a d irect consequence of the fact (see the App endix ) that s is the av erage sine-squared of the angles the samp les mak e with the sample mean d irection ¯ x . This d efinition r esults in a maximal angle d isp ersion of arcsin( p 2 / 3) = 54 . 74 ◦ in the case of un iformit y . An example of mean dir ection m ap s is s h o wn in Figure 1 . Th is p articular slice wa s selected via the inference p ro cedure d escrib ed in Secti on 4 and it sho w s large d ifferences in diffu sion direction of up to 46 . 1 ◦ in the u pp er left corner of the white matter mask. Th e statistical test describ ed next formalizes th is observ ation. 3.3. A two-sample test for dir e ctions. Cons ider t w o s amples of unsigned unit v ectors of sizes n 1 and n 2 with mean v ectors µ 1 and µ 2 . W e w ish to test the null hypothesis H 0 : | µ 1 − µ 2 | = 0 against the alternativ e H A : | µ 1 − µ 2 | > 0. Th e follo win g solution is tak en from Mardia and Jupp ( 2000 ), page 238, 8 A. SCHW A R TZMAN, R. F. DOUGH ER TY A ND J. E. T A YLOR whic h assumes equal disp ersion in the tw o groups (akin to a standard t - test) and that the samples are highly concen trated around the means. These assumptions are reconsidered in Sections 4.2 and 5 . Under the null, the tw o samples can b e view ed as a s in gle sample of size n = n 1 + n 2 and corresp onding sample d isp ersion s . Let s 1 and s 2 denote the s amp le disp ers ions of b oth samples ev aluated separately . Similar to an analysis of v ariance, the total disp ersion ns is d ecomp osed as ns = ( n 1 s 1 + n 2 s 2 ) + ( ns − n 1 s 1 − n 2 s 2 ) , where the t wo terms in p aren thesis corresp ond to th e in tr agroup and int er- group d isp ersion, resp ectiv ely . The test statistic T , which w e shall call the W atson statistic, is d efined as the ratio of the in tergroup to the int ragroup disp ersion divided by th e corresp onding num b er of d egrees of freedom, 2 for the intergroup term and 2( n − 2) for the intrag roup term: T = ( ns − n 1 s 1 − n 2 s 2 ) / 2 ( n 1 s 1 + n 2 s 2 ) / (2( n − 2)) . (3) If the un derlying concen tration p arameter κ is the same in b oth samp les, then, asymptotically as κ → ∞ , the W atson statistic ( 3 ) has an F distri- bution with 2 and 2( n − 2) degrees of freedom. Because of the asymptotic assumptions, this is called a high concentrat ion test rather than a large sam- ple test. This means that the test is v alid f or small sample sizes as long as the group d isp ersions are lo w. The app endix giv es a d eriv ation of the null distribution of the W atson statistic in the general case of testing equalit y of means b et ween a num b er of samples p ossibly greater th an t w o. A m ap of the W atson statistics is sho wn in Figure 2 a, at the same slice as Figure 1 . In our case, n = 12 and so the th eoretica l null distr ibution is F (2 , 20). F or reasons that will b ecome clear in Section 4.2 , the test statistics ha ve b een tr an s formed to a χ 2 scale b y a one-to-one qu an tile transform ation from F (2 , 20) to χ 2 (2). Notice the lo cal maximum of the test s tatistic map on the upp er left corner of the white matter mask, indicativ e of the difference in dir ection allud ed in Section 3.2 . T o assess significance, we incorp orate the m u ltiple testing problem, as describ ed next. 4. F alse d isco v ery rate inference. 4.1. FDR c ontr ol. T he inference problem of fin ding significant v o xels is a multiple comparisons problem of the t yp e H 0 ( r ) : | µ 1 ( r ) − µ 2 ( r ) | = 0 vs. H A : | µ 1 ( r ) − µ 2 ( r ) | > 0 , where the lo cation r ∈ R 3 ranges o ver the searc h region. W e o vercome th e m u ltiple comparisons problem b y controll ing th e false disco v ery rate (FDR), FDR ANA L YSIS O F BRAIN DIFFU SION DIRECTION MAPS 9 Fig. 2. Watson statistic m ap T ( r ) [after tr ansformation to χ 2 (2) ] (a) and lo c al ly aver- age d map T 5 ( r ) using a 5 × 5 × 5 b ox smo other ( b) , shown at slic e z = 23 mm. the exp ected p rop ortion of false p ositiv es among the vo xels where th e null h y p othesis is rejected. As an alternativ e to the FDR-con trolling p ro cedures describ ed in Benjamini and Ho c hb erg ( 1995 ) and Geno v ese, Lazar and Nic h ols ( 2002 ), wh ich are b ased on ordering of the p -v alues, we use an equiv alent in terp retation of the pro cedu re tak en from Storey , T a ylor and S iegmund ( 2004 ), as follo ws. Let T b e a test statistic that rejects the null hyp othesis at v oxel r if its v alue T ( r ) is large. In our case, T is th e W atson statistic from ( 3 ), b ut th e follo wing description applies more generally . Let the search region M con tain N vo xels, so that N is th e n um b er of tests (in ou r case, N = 2093 1). Th e n u ll hyp othesis is tru e in an unkn o wn subs et M 0 ⊂ M with N 0 v oxe ls, wh ile the alternativ e is tru e in the complemen t M A = M \ M 0 . The ob jectiv e is to detect as muc h as p ossible of M A while con trolling the FDR. F or an y fixed threshold u , let R ( u ) and V ( u ) b e resp ectiv ely the num b er of rejections and the num b er of false p ositiv es out of N . That is, R ( u ) = X t ∈ M 1 ( T ( r ) ≥ u ) , V ( u ) = X t ∈ M 0 1 ( T ( r ) ≥ u ) . In terms of these empirical pr o cesses, th e FDR is defined as FDR( u ) = E V ( u ) R ( u ) ∨ 1 , where the effect of the maximum op erator ∨ is to set the ratio to 0 when R ( u ) = 0 . Th e natural empirical estimator of FDR( u ) is the ratio [ FDR( u ) = ( ˆ N 0 / N ) · E[ V ( u ) / N 0 ] R ( u ) / N = ˆ p 0 P H 0 [ T ( r ) ≥ u ] ˆ P [ T ( r ) ≥ u ] , (4) 10 A. SCHW A R TZMAN, R. F. DOUGH ER TY A ND J. E. T A YLOR where ˆ P denotes a probabilit y computed from the empirical distribution of the test statistic T across M and P H 0 is a probabilit y computed from the exact distribution of the test statistic according to the n u ll hyp othesis H 0 . Th e factor ˆ p 0 is an estimate of the true fraction of n u ll v oxels N 0 / N . Assuming that most vo xels are n ull, ˆ p 0 ma y b e tak en to b e 1, making the estimate [ FDR( u ) sligh tly larger and thus conserv ative . Expression ( 4 ) has a nice graphical int erpretation as the ratio of the tail areas under the n ull and emp ir ical densities r esp ectiv ely . Notice that this f ormula assumes th at the null distribution of the test statistic is the s ame in all v oxe ls. V oxel s in whic h th e alternativ e hypothesis is true tend to h a v e higher v alues of the test statistic than exp ected according to th e n u ll hyp othesis. As a result, [ FDR( u ) tend s to d ecrease as u increases. F or a giv en FDR lev el α , the thr eshold is automatically c hosen as the low est u for whic h [ FDR( u ) is sm aller or equal to α : u α = inf { u : [ FDR( u ) ≤ α } . It is sh o wn by Storey , T a ylor and Siegmund ( 2004 ) that wh en the truly null N 0 test statistic s are indep en den t and identic ally distrib uted, this pro cedure (with ˆ p 0 = 1) is equiv alen t to the Benjamini and Ho c hb erg ( 199 5 ) pr o cedu re, and therefore pr o vides s tr ong cont rol of the FDR. Moreo v er, it is sh o wn in Storey , T a y lor and Siegm u nd ( 2004 ) that th e strong con trol also holds asymptotically for large N u nder weak dep end ence of the test statisti cs, suc h as dep endence in fi n ite blo c ks. W eak dep endence may b e assu med in brain imaging data b ecause th e n um b er of v oxe ls is large and dep en d ence is usually lo cal with an effectiv e range that is s mall compared to th e size of the b rain. 4.2. Empiric al nul l. A histogram of the W atson statistics for all N = 20931 v o xels in the white matter mask is sho w n in Figure 3 a, except that the test s tatistic s ha ve b een trans f ormed to a χ 2 scale by a one-to-one quanti le transformation from F (2 , 20) to χ 2 (2). Th e theoretical null χ 2 (2) (dashed curv e) gives a r easonable descrip tion of the distribution of th e test statistics. The empir ical null densit y (solid curve ), how ev er, pro vides a m uc h b etter fit to the data. The empirical null take s adv antage of the large num b er of v o xels to globally correct for the lac k of flexibilit y and p ossibly short-of-asymptotic b eha vior of the distrib u tion prescrib ed by the theoretical mo del. The empirical null concept was originally prop osed for z -scores [ Efron ( 2004 )], whose theoretical null is N (0 , 1). There, t -statistic s were hand led b y tran s forming them to z -scores via a one-to-one quant ile transformation from th e app ropriate t distrib ution to a N (0 , 1). Th e effect of this trans- formation is to eliminate the dep endence on the num b er of sub jects, whic h affects the estimation of the v ariance in the denominator of the t -statistic. FDR ANA L YSIS O F BRAIN DIFFU SION DIRECTION MAPS 11 In our case, the tran s formation from F (2 , 20) to χ 2 (2) has a similar effect. Keeping the numerator d egrees of freedom intact preserve s in terp retation of the dimensionalit y of the prob lem. The empirical n u ll for χ 2 statistics is computed as follo ws [ Sc hw artzman ( 2006 )]. Let f ( t ) denote the marginal densit y of the test statistic T o ver all v o xels. F r om the setup of Section 4.1 , w e write it as the mixture f ( t ) = p 0 f 0 ( t ) + (1 − p 0 ) f A ( t ) , where the fr action of v oxels p 0 = N 0 / N b ehav e according to the null den sit y f 0 ( t ) and the remainder 1 − p 0 b eha v e according to an alternativ e d ensit y f A ( t ). T o mak e the problem iden tifiable, it is assumed that p 0 is close to 1 (sa y , larger than 0.9), so that the bulk of the histogram N ∆ ˆ f ( t ) (left p ortion of Figure 3 a, w here ∆ = 0 . 2 is the bin w idth) is m ostly comp osed of n u ll vo xels. Th e densit y f A ( t ) ma y itself b e a mixtur e of other comp onen ts but its form is irrelev an t as long as it has most of its mass aw a y from zero, Fig. 3. FDR analysis with no smo othing (l eft c olum n) and smo othing using b = 5 (right c olumn). T op r ow: observe d histo gr am of the T statistic [after tr ansformation to χ 2 (2) ] c omp ar e d to the the or etic al nul l density (dashe d curve) and empiric al nul l density (solid curve). Bottom r ow: Estimates of FDR as a function of the thr eshold u ac c or ding to the the or etic al nul l (dashe d curve) and empiric al nul l (solid curve). No the or etic al nul l i s available for the smo othe d test statistic (right c olumn). 12 A. SCHW A R TZMAN, R. F. DOUGH ER TY A ND J. E. T A YLOR or equ iv alent ly , if its con tr ib ution to the mixture (1 − p 0 ) f A ( t ) is small for v alues of t close to zero. As an adjustment to th e theoretical n ull N (0 , 1) , Efron ( 2004 ) p rop osed an empirical n ull of th e form N ( µ, σ 2 ). Similarly , as an adju stmen t to a theoretical null χ 2 ( ν 0 ) with ν 0 degrees of freedom, we prop ose an empir ical n u ll of the form aχ 2 ( ν ) with ν degrees of fr eedom (p ossib ly different from ν 0 ) and scaling factor a (p ossibly d ifferen t f rom 1), that is, f 0 ( t ) = 1 (2 a ) ν / 2 Γ( ν / 2) e − t/ (2 a ) t ν / 2 − 1 . (5) This is essen tially a gamma distrib ution, b u t the scaled χ 2 notation mak es in terp retation of the resu lts easier. Under the ab o ve assumptions, the p ortion of the histogram N ∆ ˆ f ( t ) close to t = 0 should resem ble the scaled n ull p 0 f 0 ( t ). P r o ceeding as in Efron ( 2004 ), w e fit mo d el ( 5 ) to the histogram N ∆ ˆ f ( t ) via Po isson r egression usin g the link log( p 0 f 0 ( t )) = − t 2 a + ν 2 − 1 log t + constan t . (6) This is a linear mo del with predictors t and log t and observ ations give n b y the histogram counts. The estimate d p arameters ˆ a and ˆ ν are solv ed from the estimated co efficien ts of t and log t in th e P oisson regression. An estimate of p 0 is also obtained b y solving the expression for the constant in the r egression. As in Efron ( 2004 ), the fitting in terv al is arbitrary . In Figure 3 a we used an in terv al from 0 up to th e 90th p ercen tile of the histogram. The fi tted parameters were ˆ a = 1 . 000 and ˆ ν = 1 . 78. Although th e scaling is unaffected, the reduced num b er of degrees of freedom m ay b e captur ing some additional structure n ot account ed for b y th e W atson mo d el, su ch as correlation or spherical asymm etry . With the empirical null, the FDR estimate ( 4 ) is no w replaced by [ FDR + ( u ) = ˆ p 0 ˆ P H 0 [ T ( r ) ≥ u ] ˆ P [ T ( r ) ≥ u ] . (7) Notice th e extra “hat” in the numerator, indicating that the emp irical null is b eing used ins tead of the theoretical null. The FDR analysis is su mmarized in Figure 3 b. T he FDR curve corre- sp ondin g to the theoretical null (dashed) w as computed u sing ( 4 ) with ˆ p 0 = 1. T he FDR curve corresp ond ing to the empirical null curve (solid) w as computed u sing ( 7 ) with the fitted parameters describ ed ab o ve . T he v alue of the curve f or u = 0 is our emp irical null estimate of p 0 , equal to 0.974. Notice that the FDR curve s ha ve a general tendency to decrease as the thresh old increases. Th e empirical n ull giv es b etter FDR v alues th an FDR ANA L YSIS O F BRAIN DIFFU SION DIRECTION MAPS 13 the theoretical null, but that is not necessarily true in general [ Efr on ( 2004 ) pro v id es a counterexample]. The FDR lev el α = 0 . 2 in tersects the empir ical null FDR curve at a thresh - old of 15.92, marke d in the figure as a ve rtical dash ed segment. As a r ef- erence, this threshold corresp onds to an un corrected p -v alue of 3 . 5 × 10 − 4 . The 15.92 thresh old r esulted in 23 interesting vo xels. Alt hough these se- lected vo xels are lo cated in sev eral areas of the white matter, it is in slices z = 23 mm to z = 25 mm that they are closer together and ha v e the h ighest v alues of the W atson s tatistic . These th r ee slices are sho wn in the top ro w of Figure 4 , with the corresp ondin g subset of 8 v oxel s marked in w h ite. T he group d ifference in this region can also b e seen as a lo cal maximum in the test statistic map of Figure 2 a. A hierarc hical clustering analysis of the se- lected vo xels sho w ed that the 23 v o xels can b e group ed into 14 clusters, the largest of whic h has size 3. T hese results are also ind icated in T able 1 . 4.3. Impr ove d p ower by lo c al aver aging. So far, the analysis has b een based on marginal densities and has not tak en into accoun t the information Fig. 4. Inter esting voxels (white) thr esholde d fr om unsmo othe d test statistics at FDR level 0.2 (top r ow) and using kernel si ze b = 5 at FDR level 0. 05 (b ottom r ow). Both analyses ar e b ase d on the empiric al nul l. Shown slic es ar e z = 23 mm (left c ol um n), 25 mm (midd le c olumn) and 27 mm (right c olum n). 14 A. SCHW A R TZMAN, R. F. DOUGH ER TY A ND J. E. T A YLOR T able 1 Inter esting voxels sele cte d at various smo othing sizes b and FDR levels α . Liste d ar e the mask size N , the estimate d empi ri c al nul l p ar ameters, fitting l imit T 90 , FDR level α , thr eshold u α , numb er of sele cte d voxels R ( u α ) , numb er of clusters and size of the lar gest clusters. T he ≤ sign impl ies ther e ar e other smal ler clusters than liste d b N ˆ p 0 ˆ a ˆ ν T 90 α u α R ( u α ) # clu st clust sz 1 20931 0.974 1. 000 1 . 78 4.84 0 . 2 15 . 92 23 14 ≤ 1,2,3 3 20613 0.938 0. 203 8 . 66 3.51 0 . 2 4 . 14 1273 53 ≤ 59,28 2,478 0 . 05 5 . 46 452 25 ≤ 34, 89,192 0 . 01 6 . 80 164 13 ≤ 21, 36,57 5 19856 0.928 0. 091 20 . 01 3.0 3 0 . 2 3 . 23 1609 25 ≤ 90,42 7,711 0 . 05 3 . 90 790 21 ≤ 42, 216,431 0 . 01 4 . 60 345 10 ≤ 33, 86,167 7 18720 0.926 0. 052 36 . 10 2.8 0 0 . 2 2 . 90 1606 18 ≤ 83,50 9,889 0 . 05 3 . 35 829 12 ≤ 17, 256,517 0 . 01 3 . 79 442 8 ≤ 13,108 ,316 9 17050 0.930 0. 035 54 . 31 2.6 6 0 . 2 2 . 76 1410 12 ≤ 11,51 9,852 0 . 05 3 . 13 691 6 ≤ 3,187, 494 0 . 01 3 . 52 227 6 ≤ 4,216 a v ailable in the lo cation ind ex r . Neigh b oring vo x els tend to b e similar b e- cause the an atomical structures visible in DTI are typica lly larger th an the v oxe l size. Th e logical spatial units are the v arious brain structur es, not the arbitrary samp ling grid of vo x els, and th er efore, it is desirable to select clus- ters rather th an individu al vo xels. Sp atial smo othing ma y reduce noise and ma y b etter detect clusters that corresp ond to actual anatomical str uctures. Consider a simple b o x smo other h b ( r ) = 1 ( r ∈ B b ) / | B b | , where th e b o x B b is a cub e of s ide b vo xels and v olume | B b | = b 3 . Conv olution of the test statistic map T ( r ) with the b o x s m o other resu lts in the lo cally a v eraged test statistic map T b ( r ) = T ( r ) ∗ h b ( r ) = 1 | B b | X v ∈ B b T ( r − v ) . (8) In the null regions, the smo othed test statistic T b ( r ) at ev ery v o xel is the a ve rage of b 3 χ 2 (2)-v ariables. If the test statistics were indep end en t, T b ( r ) w ould b e exactly χ 2 (2 b 3 ) /b 3 . It is known th at the sum of identica lly d is- tributed exp onen tially correlated gamma-v ariables can b e well approxima ted b y another gamma-v ariable [ Kotz and Adams ( 1964 )]. Instead of theoreti- cally deriving the parameters of the gamma distrib ution and estimating th e correlation fr om the data, an easier solution is given b y the empirical null. Exp onentia l correlation b eing a reasonable mo del for s p atial data, we tak e the empirical n u ll to b e a scaled χ 2 (gamma). W e then estimate the null FDR ANA L YSIS O F BRAIN DIFFU SION DIRECTION MAPS 15 parameters a and ν directly fr om the histogram of T b ( r ) follo wing the same recip e as in Section 4.2 . A sligh t c hange from the previous analysis of S ection 4.2 is in the size of th e mask. In ord er to minimize edge effects, the lo cal a veragi ng ( 8 ) w as applied to the un mask ed images and the mask reapplied for the p u rp oses of statistica l an alysis. Edge effects du e to some external anatomical f eatures close to our searc h region (suc h as cerebro-spinal fluid) resulted in the exclu- sion of some vo xels, causing a slight r eduction in the size of the mask from the original N = 20931 at b = 1 to N = 17050 at b = 9 (T able 1 ). The lo cally a verag ed test statistic map for b = 5 is sho w n in Figure 2 b. The corresp onding histogram is sh own in Figure 3 c. Notice the n arro win g of the histogram around the global mean v alue 2 as a result of the a v eraging. Figure 3 d sho ws the corresp on d ing FDR curve. The sm o othin g has greatly help ed differentiat e the tw o m a jor comp onen ts of the mixture. Th is time w e can afford to redu ce th e inference lev el subs tantial ly with r esp ect to the previous analysis. Setting α = 0 . 05 resu lts in 1609 in teresting v o xels out of 19856 . Figure 4 , b ottom row, shows th e largest t wo out of 21 disco ve red clusters. These clusters actually extend ve rtically in the br ain all the wa y from z = 5 mm to z = 27 mm. Rep eated analyses for b = 3 , 5 , 7 , 9 result in the selection of t w o large clusters in ab out the same lo cation. The effect of b on the n umb er of selected v oxe ls and cluster size is summarized in Figure 5 . The total fraction of selected v oxe ls out of N increases dr amatically ev en with the least amount of smo othing, but it r eac hes a maximum at b = 7. A similar p latea u effect is also ob s erv ed in the size of the t wo largest clus ters, esp ecially at FDR lev els 0.05 and 0.01. Notice that the second largest cluster disapp ears at b = 9 and FDR lev el 0.01. Increasing b b ey ond 9 is imp ractical d ue to th e limited size of the white matter mask. 5. Discussion. W e h av e compared tw o groups of diffusion direction m aps using a W atson mo del for d irectional data. The inference pr o cedu re wa s built up on vo xelwise test statistics and dep ended only on their marginal distribution. T aking adv an tage of the large num b er of v oxels and the sp atial structure of the data, we were able to impro ve the mo del fit to the data using global p arameters and improv e the statistical p o wer usin g local a ve raging. The c hoice of th e n ull distribution is crucial for the in ference pro cess. Why is th e theoretical n u ll not en ou gh ? The F (2 , 20) theoretical n ull (Section 3.3 ) is a high concent ration asymptotic based on a n ormal approxi mation to the W atson dens ity (see the App endix ). Th e asymptotic density is actually ap- proac hed quickly as κ increases (Figure 6 ). F or example, the 0.001-quan tile is 8.5 for κ = 5 and 9.4 f or κ = 10, compared to 9.9 for the F (2 , 20) d istribu- tion. Sin ce th e 25th and 50th p ercen tiles of the d istr ibution of the estimated κ among all 9203 v o xels are 5.0 and 9.8, we ma y say the h igh concen tration 16 A. SCHW A R TZMAN, R. F. DOUGH ER TY A ND J. E. T A YLOR Fig. 5. Sele cte d voxels as a fr action of total mask size N for FDR levels 0.2 (a) , 0.05 (b) and 0.01 ( c) . Indic ate d ar e the total set of sele cte d voxels and the lar gest two clusters. assumption is reasonable for many v o xels, y et the minorit y that is not highly concen trated ma y hav e an effect on the ov er all mixture. Although not obvious from Figure 6 , the F (2 , 20) density is hea vier tailed than for fin ite κ . Notice in the abov e calculation that th e 0.001- quan tile 9.9 f rom the F (2 , 20) densit y is higher th an it would b e if the tru e con- Fig. 6. Sim ul ate d nul l densities for various values of the c onc entr ation p ar ameter κ . The high-c onc entr ation asymptotic F (2 , 20) is lab ele d as κ = ∞ . FDR ANA L YSIS O F BRAIN DIFFU SION DIRECTION MAPS 17 cen tration we re u sed instead. Since the W atson density has a finite domain on th e sph ere, it is n ecessarily lighte r tailed than the normal density that appro ximates it when κ is large. This effect is s tr onger in the numerator of the W atson statistic ( 3 ), thus making the F distribu tion hea vier tailed than necessary for the data. The empirical n u ll pro vid es the ligh ter tail for fin ite κ , as needed. The discrepancy b etw een th e theoretical and empirical nulls f or lo w v alues of T may b e explained b y the distr ib ution on the sph ere not b eing spherically symmetric. The numerator degrees of freedom in F (2 , 20) corr esp onds to the dimensionalit y of th e normal appr oximati on to the W atson density on the tangent plane w hen κ is large. The num b er of degrees of freedom 1.78 in the empirical null, somewhat smaller than 2, suggests that the p rop er appro ximation may not b e biv ariate n orm al with circular con tours but rather with elliptical conto urs. The change in num b er of d egrees of freedom may also b e a consequen ce of unequal disp ersions b et ween the t wo groups, akin to the scalar case [ Sc h eff ´ e ( 1970 )]. Again, instead of paying extra parameters at eac h vo xel, this is captured globally by the empirical n u ll. The empirical n ull is also effectiv e b ecause it p ro vides a mo del for a m ixture of d istributions from a large num b er of vo xels, adju sting for u n kno wn heteroscedasticit y and correlation b et wee n individual vo xels. As additional n ull v alidation, an analysis w as p erformed in w hic h h alf the s u b jects were swa p p ed b et we en th e tw o group s in order to remo ve the group effect. The histogram and fitted empirical null we re v ery s imilar to the ones obtained for th e original groups. Su rprisingly , ho w ever, some significan t v oxe ls were f ound at th e same FDR lev els as the original group comparison, although substantia lly less in n um b er. T h is m a y b e an indication that the empirical n ull, while it helps sup plemen t the deficiencies of th e theoretical mo del, ma y still not b e enough to explain all the n u ll v ariation in the data. It sh ou ld b e noted that, in general, there is not necessarily a d irect increase in p o w er asso ciated with the empirical null [ Efron ( 2004 ) p ro vides counterex- amples]. The empirical n ull only answ ers a question of mo del v alidit y . An alternativ e option to the empirical null w ould b e to do a p ermuta tion test with the same W atson statistic. In our case the p ermutat ion test h as little p o wer b ecause the lo w est p -v alue attainable with tw o groups of 6 su b jects is 0.001, whic h cannot su rviv e th e m u ltiple comparisons problem with 20931 v oxe ls. Lo cal a v eraging has a tremendous imp act on statistical p ow er b ecause the p o wer at eve ry single v o xel is indeed low. Consid er the p ow er at a single v oxe l with the observ ed p eak separation of 46 . 1 ◦ as the effect size. Sim u lation of the W atson statistic under this alternativ e hyp othesis rev eals that the p o wer of a single test of the F (2 , 20) null at leve l α = 0 . 001 is 0.180 for κ = 5 and 0.804 for κ = 10. A v ery h igh concen tration is r equired in ord er to ha ve sufficient p o w er. Under the assump tion that the signal c hanges slo wly 18 A. SCHW A R TZMAN, R. F. DOUGH ER TY A ND J. E. T A YLOR o ve r space, lo cal av eraging has the effect of reducing v ariance, effectiv ely increasing the concen tration asso ciated with the sm o othed test statistic and th u s increasing p o wer. The redu ction in v ariance pro vid ed by lo cal a ve raging increases w ith the size of the s m o othing kernel. T o o muc h smo othing, how ev er, results in a reduction of the signal. Th is effect is seen in Figure 5 , wher e the d etection rate go es do w n if the k ern el size b is to o large. The sh ap e of the graph s in Figure 5 suggests there ma y exist an optimal k ernel that maximizes p o wer, although the exact c hoice of b migh t not b e cr itical as long as it is within a certain neighborh o o d of the optim u m. Th e c h oice of kernel size is an in teresting question for fu r ther r esearc h and prompts questions ab out the prop er defi n ition of p o wer f or FDR inf erence of sp atial signals. Another in teresting effect is seen in the b eha vior of the estimated p aram- eters of the empirical null as a fun ction of the ke rnel size b (Figure 7 ). While ˆ p 0 resem b les Figure 5 , close insp ection rev eals th at ˆ a and ˆ ν are v ery close to functional forms of b , resp ectiv ely 1 / √ b 3 and 2 √ b 3 . These rates are slo wer than the r ates 1 /b 3 and b 3 w e w ould exp ect if neigh b oring vo x els w ere inde- p endent. Th e actual rates migh t shed light into the correlation structure of the d ata. Despite the apparent success of smo othing, there are some ca v eats. As b increases, s o do es the d ep endence b etw een the test statistics, s h aking the ground on wh ic h the strong control of FDR relies (Section 4.1 ). F urther- more, there is a problem of interpretation of the r esults. The inference after smo othing is no longer ab out the original set of hyp otheses b ut ab out a smo othed set of h y p otheses. W e might gain significance, bu t lo ose spatial lo caliza tion. Also anatomicall y , s m o othing with a k ern el larger than the structures of interest will preven t interpretation of the results as differences in br ain structure. The choic e of smo othing the test statistic map, as opp osed to the original data, was a practical one. T o smo oth th e sub j ects’ d irection maps was prob- lematic b ecause, ev en if the W atson mo del were correct, the mean d irection of a W atson sample is no longer W atson. Smo othing of th e test statistic map is a more general p latform that can b e studied in d ep endently of ho w the test statistics were generated. While significan t differences were found b et ween the t wo groups of princi- pal diffusion direction images, the r esults should b e take n with some caution, as in any other observ ational stud y . A t the core of the vo xelwise compar- ison p arad igm used in this study is the d ifficult y to tell ho w muc h of the effect is anatomical and h o w muc h is d ue to the image alignmen t pr o cess. Not en ough is kn o wn y et ab out the anatomical basis for dyslexia in ord er to in terp ret the results. T o gain insights ab out dyslexia would require tracki ng the n eural connections b etw een the deep w h ite matter regions d isco v ered in FDR ANA L YSIS O F BRAIN DIFFU SION DIRECTION MAPS 19 Fig. 7. Empiric al nul l p ar ameters as a f unction of kernel size b : ˆ p 0 (a) , ˆ a (b) and ˆ ν (c) . Both ˆ a and ˆ ν r esemble explici t functional forms of b . this study and the p eripheral gra y matter r egions inv olv ed in reading. This is a c hallenge b eyo nd the scop e of this pap er. In su mmary , w e ha v e d ev elop ed a metho dology for comparing t wo group s of d iffusion dir ection maps and fi n ding in teresting regions of difference b e- t wee n the tw o group s. Th e W atson m o del w as necessary b ecause of th e direc- tional nature of the data. The inference pro cedur e, on the other hand, wa s built up on vo xelwise test statistics. The key elemen ts in the in ference pro- cedure were the empirical null and smo othin g of the test statistic map . Th e pro cedure can b e applied more generally to other large scale simultaneous h y p othesis testing pr oblems with a con tinuous un derlying spatial structure. The requ ir emen ts are an appr o ximate theoretical n ull d istribution of the test statistics, up on w hic h an empirical null d istribution can b e computed, and a spatial stru cture w here sp atial smo othing of the test statistics is we ll defined. APPENDIX: CO MPUT A TIONS FOR THE BIPO LAR W A TS ON DISTRIBUTIO N The follo win g summary is a r einterpretatio n of material from Mardia and Jupp ( 2000 ), pages 181, 202, 236–240, W atson ( 1965 ) and Best and Fisher ( 1986 ). 20 A. SCHW A R TZMAN, R. F. DOUGH ER TY A ND J. E. T A YLOR It in clud es a new asymp totic appr o ximation for the in tegration constant and a new in terp r etativ e quanti t y called an gle disp ersion. A.1. Int egration constant . Define a sp herical co ordinate system on the unit sphere so that the z -axis coincides with the m ean v ector µ . F or a unit v ector x , let θ b e th e co-latitude angle b et ween x an d the z -axis. Denote the longitude angle b y φ . The W atson d en sit y in th is co ordinate system is giv en by f ( θ , φ ) = C ( κ ) e κ cos 2 θ sin θ dθ dφ, 0 ≤ θ < π / 2 , 0 ≤ φ < 2 π . The restriction of the density to h alf the sp here accounts f or the an tip o d al symmetry . This formulation is slightly d ifferen t from the one in Best and Fisher ( 1986 ), w hic h defines the densit y on the en tire sp here. An expression for C ( κ ) is obtained integrati ng th e d en sit y with the c h ange of v ariable u = cos θ , yielding C ( κ ) = 2 π Z 1 0 e κu 2 du − 1 . The definite integral in the ab o v e expression is a sp ecial case of the Da wson in tegral [ Abramo witz and Stegun ( 1972 ), page 298]. An explicit asymptotic expr ession can b e found in the large concentra- tion case. When κ is large, most of the pr obabilit y d en sit y is concentrat ed around µ and x is close to µ with high probability . I ntuitiv ely , the region of the spher e close to µ lo oks lo cally like a t wo-dimensional plane. A scaled pro- jection of th e d en sit y ont o this plane is obtained with the c hange of v ariable r = √ 2 κ sin θ , giving f ( r , φ ) = 2 π C ( κ ) e κ 2 κ · e − r 2 / 2 r dr dφ 2 π p 1 − r 2 / 2 κ , 0 ≤ r < √ 2 κ, 0 ≤ φ < 2 π . (9) F or large κ the second factor in the density lo oks lik e a biv ariate Gaussian densit y and its integ ral should conv erge to 1. Indeed, another change of v ariable u = r 2 / 2 κ and in tegrating by parts, the second factor in ( 9 ) y ields Z 2 π 0 dφ 2 π Z 1 0 e − κu κ du √ 1 − u = 2 κ 1 − κ Z 1 0 e − κu du √ 1 − u . The b ounds 1 − u 2 − u 2 2 ≤ √ 1 − u ≤ 1 − u 2 , 0 ≤ u ≤ 1 , then lead to 1 + ( κ − 1) e − κ ≤ Z √ 2 κ 0 e − r 2 / 2 r dr p 1 − r 2 / 2 κ ≤ 1 + 2 κ − 3 + 2 κ e − κ . FDR ANA L YSIS O F BRAIN DIFFU SION DIRECTION MAPS 21 Replacing in the inte gral of ( 9 ), w e obtain π C ( κ ) e κ κ ∼ 1 ⇒ C ( κ ) ∼ κ π e κ , κ → ∞ . (10) A.2. Maxim u m lik eliho o d estimates. Let x 1 , . . . , x N b e a random sample from the W atson distr ibution. The log-lik eliho o d is κ N X i =1 ( x T i µ ) 2 + N log C ( κ ) = N { κµ T S µ + log C ( κ ) } , (11) where S is the scatter matrix 2 . F or κ > 0, the MLE ˆ µ is the maximizer of µ T S µ constrained to µ T µ = 1 and is giv en by the eigenv ector of S that corresp onds to the largest eigen v alue γ . A t the maxim u m, ˆ µ T S ˆ µ = ˆ µ T γ ˆ µ = γ . (12) Differen tiation of ( 11 ) with resp ect to κ giv es ˆ µ T S ˆ µ = A ( ˆ κ ), where A ( κ ) = − C ′ ( κ ) C ( κ ) = R 1 0 t 2 e κt 2 dt R 1 0 e κt 2 dt . (13) Using ( 12 ), ˆ κ is th us foun d b y solving A ( ˆ κ ) = γ . (14) The fu nction A ( κ ) is monotonically increasing in the range [1 / 3 , 1) as κ increases from 0 to ∞ . Replacing the asymptotic ( 10 ) in ( 13 ), w e obtain the large concentrat ion appro xim ation A ( κ ) ∼ 1 − 1 κ , κ → ∞ . Setting the disp ersion s = 1 − γ in ( 14 ) and u sing the previous app ro ximation for A ( κ ), we get that at the p oin t of maxim um like liho o d s ∼ 1 / ˆ κ , whic h justifies the int erpretation of s as a measure of disp ersion. W e now obtain an in terp retation of s in terms of angle u n its. Replacing ( 2 ) in ( 12 ), we obtain γ = ˆ µ T S ˆ µ = 1 N N X i =1 ( ˆ µ T x i )( ˆ µ T x i ) T = 1 N N X i =1 cos 2 ˆ θ i , and so s = 1 − γ = 1 N N X i =1 sin 2 ˆ θ i . (15) In other words, s is the a verage sine-squared of the angles that th e samples mak e with the mean dir ection. An in terpretation of s in units of angle is obtained thus b y computing the quantit y arcsin( √ s ), whic h we call angle disp ersion. 22 A. SCHW A R TZMAN, R. F. DOUGH ER TY A ND J. E. T A YLOR A.3. A multi- sample large concen tration test. Given q samp les of sizes N 1 , . . . , N q , we wish to test H 0 : µ 1 = · · · = µ q against the alternativ e that at least one of the means is different. F or simplicit y , we assume that all samp les ha ve the same unkn own large concen tration κ . Consider fir s t the en tire sample of size N = N 1 + · · · + N q with common mean µ and p o oled disp ersion s . Using ( 15 ), w e write the total d isp ersion as 2 κN s = N X i =1 2 κ sin 2 ˆ θ i = N X i =1 ˆ r 2 i , where ˆ r i = √ 2 κ sin ˆ θ i . When µ is k n o wn, the densit y ( 9 ) indicates that eac h r i (without the “hat”) is appro ximately stand ard b iv ariate Gaussian when κ is large. 2 κN s is thus the su m of N indep endent appr oximate ly χ 2 2 random v ariables. Th e estimation of µ r educes t wo degrees of freedom so 2 κN s ∼ H 0 χ 2 2( N − 1) . (16) F or q in dep endent samples of sizes N 1 , . . . , N q and disp ersions s 1 , . . . , s q , 2 q parameters are fitted and w e ha v e the intragroup sum of squares 2 κ q X j =0 N j s j ∼ H 0 χ 2 2( N − q ) . (17) In the “analysis of v ariance” decomp osition 2 κN s = 2 κ q X j =0 N j s j + 2 κ " N s − q X j =0 N j s j # , the asymptotics ( 16 ) and ( 17 ) imply that th e second term on the RHS is appro ximately χ 2 with 2( N − 1) − 2( N − q ) = 2( q − 1) d egrees of freedom and appro ximately ind ep endent of the fir st term. The second term represents the in tergroup d isp ersion. Pro ceeding as in the analysis of v ariance for normal v ariables, we construct the W atson test statistic as the ratio b etw een the in tergroup and the in tragroup terms divided b y th e appropriate num b er of degrees of freedom. Corresp ondingly , the W atson statistic is asymp totical ly F -distributed as T = [ N s − P q j =0 N j s j ] / 2( q − 1) [ P q j =0 N j s j ] / 2( N − q ) ∼ H 0 F 2( q − 1) , 2( N − q ) . Notice th at the actual v alue of κ , although assu med large, is n ot needed in the fi nal form ula of the statistic. FDR ANA L YSIS O F BRAIN DIFFU SION DIRECTION MAPS 23 REFERENCES Abramow i tz, M. and S te gun, I. A. (1972). Handb o ok of M athematic al F unctions with F ormulas , Gr aphs , and Mathematic al T ables , 9th ed. Dov er, New Y ork. MR0208797 Bammer, R., Augustin, M., Strasser-Fuchs, S., Se ifer t, T., Kapeller, P., Stoll- berger, R., Ebner, F., H ar tung, H. P. and F aze kas, F. (2000). Magnetic resonance diffusion tensor imaging for c haracterizing diffuse and fo cal white matter abnormalities in multiple sclerosis. Magnetic R esonanc e in Me di cine 44 583–591. Bammer, R., Auer, M., Keeling, S. L., Moseley, M. E. and F azekas, F. (2002). D if- fusion tensor imaging using single-shot S ENSE-EPI. Magnetic R esonanc e in Me dicine 48 128–136. Basser, P. J. and Pierp aoli, C. (1996). Microstructural and physiologi cal features of tissues elucidated b y qu an titative -diffusion-tensor MRI. J. Magnetic R esonanc e Ser. B 111 209–219. Benjami ni, Y. and Hochberg, Y. ( 1995). Controll ing the false discov ery rate: A p ractical and p ow erful approach to multiple testing. J. R oy. Statist. So c. Ser. B 57 289–300 . MR1325392 Best, D. J. and Fisher, N. I. (1986). Go o d ness-of-fit and d iscordancy tests for samples from t h e W atson distribution on the sphere. Aust r alian J. Statist. 28 13–31. MR0847957 Deutsch, G . K., Dougher ty, R. F., Bammer, R., Siok, W. T., Gabrieli, J. D. E. and W andell, B. (2005). Correlations b etw een white matter microstructure and reading p erformance in children. Cortex 41 354–363 . Efr on, B., Tibshirani , R., Storey, J. D. and Tusher, V. (2001). Empirical Bay es analysis of a microarra y exp eriment. J. Amer. Statist. Asso c. 96 1151–1160. MR1946571 Efr on, B . (2004) Large-scale simultaneous hyp othesis testing: The choice of a null hy- p othesis. J. Amer. Statist. Asso c. 99 96–104. MR2054289 Genovese, C. R., Lazar, N. A. and Nichols, T. E. (2002). Thresholding of statistical maps in functional neuroimaging using the false discov ery rate. Neur oim age 15 870–878 . Ko tz , S . and Adams, J. W . (1964). Distribution of sum of identicall y distribut ed exp o- nentiall y correlated gamma-v ariables. Ann. Math. Statist. 35 277–283. MR0158459 Klingberg, T. , He dehus, M ., T emple, E., Sa lz , T. , G abrieli, J. D., Moseley, M. E. and Poldra ck, R. A. (2000). Microstructure of temp oro-parietal white matter as a basis for reading ability: Ev idence from diffusion tensor magnetic resonance imaging. Neur on 25 493–500. Le Bi han, D., Mangin, J. F., Poupon, C ., Clark, C. A. , P app a t a, S ., Molk o, N. and Chabria t, H. (2001). Diffusion tensor imaging: Concepts and applications. J. Magnetic R esonanc e Imaging 13 534–546. Mardia, K. V. and Jupp, P. E. ( 2000). Dir e ctional Statistics . Wiley , Chichester. MR1828667 P a cifico, M. P., Ge n o ve se, C., V erdinelli, I. an d W asserman, L. (2004). F alse disco very control for random fields. J. A m er. Statist. A sso c. 99 1002–1014. MR2109490 Scheff ´ e, H. (1970). Practical solutions of the Behrens–Fisher problem. J. Amer. Statist. Asso c. 65 1501–15 08. Schw ar tz man, A., Doughe r ty, R. F. and T a ylor, J. E. (2005). Cross-sub ject com- parison of p rincipal diffusion direction maps. Magnetic R esonanc e in Me dicine 53 1423– 1431. MR0273732 Schw ar tz man, A. (2006). Random ellipsoids and false d isco very rates: S tatistics for dif- fusion tensor imaging data. Ph.D. dissertation, Dept . Statistics, Stanford U niv. Storey, J. D., T a ylor, J. E. and Si egmund, D. O. (2004). Strong control, conserv ative p oin t estimation and sim ultaneous conserv ative consistency of false discov ery rates: A unified approach. J. R oy. Statist. So c. Ser. B 66 187–205. MR2035766 24 A. SCHW A R TZMAN, R. F. DOUGH ER TY A ND J. E. T A YLOR W a tson, G. S. (1965). Equatorial d istributions on a sp h ere. Biometrika 52 193–201. MR0207115 Wors ley, K. J., Marrett, S., Neelin, P., V andal, A. C., Friston, K. J. and Ev ans, A. C. (1996). A unified statistical approach for d etermining significan t signals in images of cerebral activ ation. Human Br ain Mapping 4 58–73. A. Schw art zman Dep ar tment of Biost a tistics Dana-F arber Cancer Institute Mailstop L W225 44 Binney Street Boston, Massachusetts 02115 USA E-mail: armins@hsph.harv ard.edu R. F. Dougher ty Dep ar tment of Psychology—Jordan Hall 450 Serra Mall St anford, California 94305 -2130 USA E-mail: bob d@stanford.edu J. E. T a ylor Dep ar tment of St a tistics— Sequoia Hall 390 Serra Mall St anford, California 94305 -4065 USA E-mail: jonathan.ta ylor@stanford.edu
Original Paper
Loading high-quality paper...
Comments & Academic Discussion
Loading comments...
Leave a Comment