Principal component analysis model for machine-part cell formation problem in group technology
In this paper, we consider the problem of forming machine cell in cellular manufacturing (CM). The major problem in the design of a CM system is to identify the part families and machine groups and consequently to form manufacturing cells. The aim of…
Authors: Wafik Hachicha (U2MP), Faouzi Masmoudi (U2MP), Mohamed Haddar (U2MP)
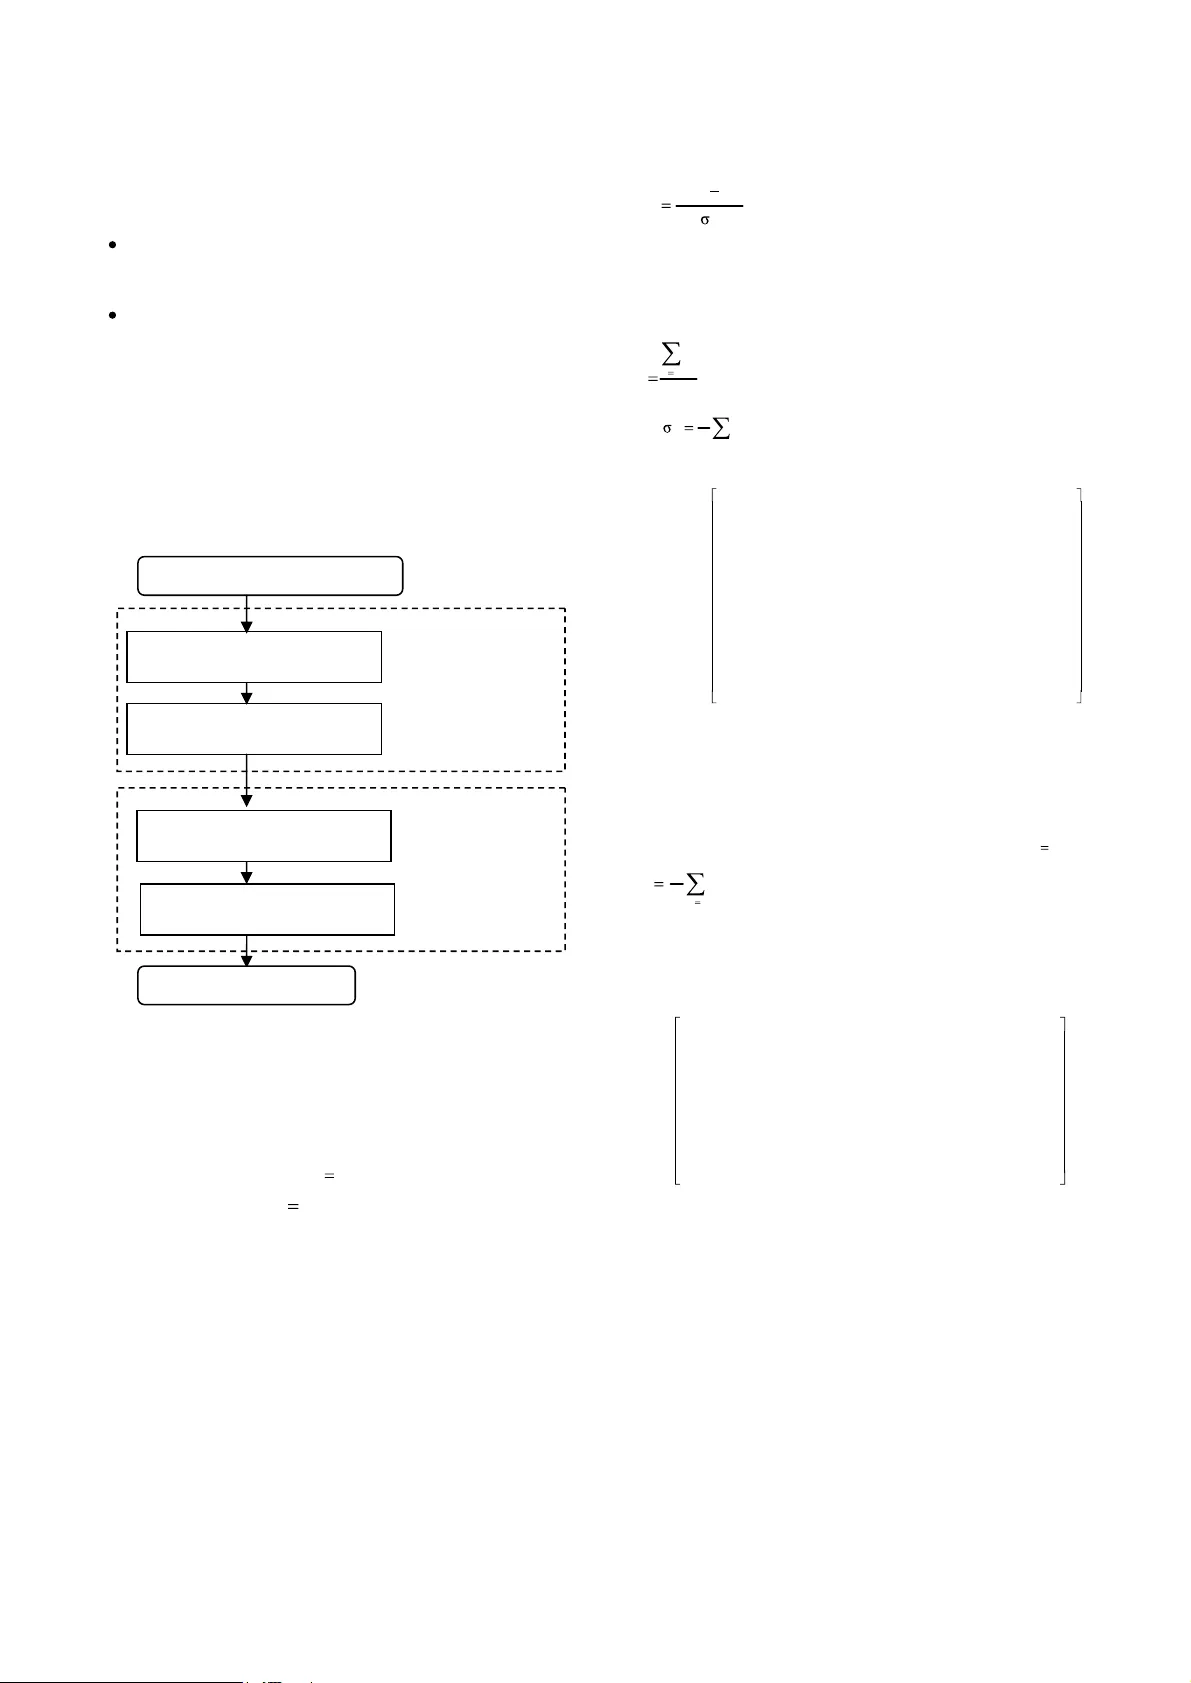
Principal component analysis model for machine - part cell formation problem in group technology Wafik Hachicha a , Faouzi Masmoudi a,b and Mohamed Haddar a,b a Unité de recherche de Mécaniq ue, Modélisation et Production,(U2MP) . b Département de génie mécanique, Ecole Nationale d ingénieurs de Sfax, B.P. W, 3038 Sfax , Tunisia Abstract In this paper, w e consider t he problem of forming machine cell in cel lular ma nufacturing (CM). The major problem in the design of a CM system is to identify the p art families and machine g roups and consequently to form manufacturing cells. The aim of this article is to formulate a multivariate approach based on a correlation analysis for solving cell formation problem. The proposed approach is carrie d ou t in two p hases. In the first ph ase, the correlati on m atrix is used as an original similarity coefficient matrix. In the second phase, Principal Component Analysis (PCA) is applied to find the eigenvalues and eigenvectors on the correlation similarity matrix. A scatter p lot analysis as a cluster analysis is applied to make machine groups while maximizing correlation b etween elements. A numerical example for the design of cell structures is provided in order to illustrate the proposed approach. The results of a comparative stu dy based on multiple performance criteria show that the present approach is very effective, efficient and practical Keywords : cellular manufacturing, cell formation, correlation matrix, Principal Component Analysis 1. Introduction Machine layout in a trad itional production system is mainly process (functional) oriented where machines performing similar processes ar e grouped together. Parts requiring more than one process travel from one section of a production system to another until their operation requirements are completed. Long and uncertain throughput times are usu ally the major problems in such a system [1]. Group technology (GT) has been proposed as a layout approach to circumvent the above - mentioned problems. GT is a manufacturing philosophy that has attracted a lot of attention because of its po sitive impacts in th e batch- type production. In essence, GT tries to retain the flexibility of a job shop with the high productivity of a flow shop. GT whose basic idea is to decompose a m anufacturing process into a set of subsystems for the sake of b etter control possesses a manufacturing philosophy that identifies and exploits the similarities of product design and manufacturing process. This characteristic of GT leads to simplified material flow s, reduced material h andling, redu ced work- in - progress inventory, reduced thro ughput time, improved sequencing and scheduling on the shop floor Cellular manufacturing (CM) is one of the applications of GT principles to manufacturing. In the design of a CM syste m, similar parts are grouped into families and associated machines into groups so that one or more part families can be processed within a single machine group. The process of determining part fam ilies and machine groups is referred to as the cell formatio n (CF) problem. CM has b een r ecognized as one of the most recent technological innovations in job-shop or batch-type production to gain economic advantages similar to those of mass production. Many firms h ave recently st arted to adopt CM systems in order to achieve flexibility and efficiency, which are crucial for survival in today s competitive environment. The main used techniques are classification and coding systems (such as in [2], [3] and others), machine- component group analysis, mathematical and heuristic approaches (such as in [5], [5], [6] and others), similarity coefficient based on clustering methods (such as in [7], [8], and others), graph- theoretic methods, knowledge-based and pattern recognition methods, fuzzy clustering methods, evolutionary approaches (such as in [9] and others) and neural network approaches. A number of researches have published review studies for existing CF literature (refer to [10], [11] and others). Among these techniques, those based on similarity coefficients are more basic and more flexible for dealing with the CF problem [1 1], [13]. Although a number of research papers have used different types of similarity and dissimilarity coefficients for identifying part families and machine cells. A similarity coefficient represents the degree of commonality between two parts or two machines. The binary data based problems consider only assignment information, that is, a part need o r need not a machine to perform an operation. The initial machine-part incidence m atrix is a binar y matrix whose rows ar e machines and columns stand for parts. Where 1 ij a , means that ma chine i ( 1 .m) is necessary to process part j (1 .p) and 0 ij a , otherwise. Many definitions of similarity co efficient have been propo sed for GT problem (such as in [ 4], [6], [12] and others). A clustering algorit hm must transform t he initial machine -part incidence matrix into the final matrix with structured form (blocks in diagonal). We are interested in finding solutions of a CF probl em, which respect the following hypothesis: Each machine is considered as uniq ue: even if two machines are functionally simil ar, they are considered as different in the model. One and only one routing has to be selected for each part type. 2. Description o f the proposed approach This approach consists in solvin g machine- part grouping problem u sing correlation as a new definition of similarity coeff icient and to use the PCA as a cluster method. T hese techni ques all ow the identification o f par t families and machine groups simultaneously. The proposed approach consists in two phases as mentioned in figure 1. 2.1 Phase 1: Similarity coefficient matrix The first phase consists in building a similarity mat rix. The initial machine-part incidence matrix shown in figure 2 is a binary matrix wh ich rows are p arts and colum ns stand for machines. Where 1 a ij if machine j is required to process part i an d 0 a ij otherwise. Note that this proposed definit ion looks like the transpose of classical incidence matrix. In order t o explain the methodology of the proposed approach, a manufacturing system is considered with seven machines (label ed M1-M7) an d eleven parts (la beled P1- P11). This example is provided by (Boctor, [6]). Cell formation problem can be considered as a dimension reduction problem. A large number of interrelated machines are grouped into a smaller s et of independent cells and a lar ge number of interrelated parts a re grouped into families. To make the initial matrix (A) m ore sufficiently meaningful and significant, its standardization is needed.It is expressed by [14]: j j A j B j E M M (1) w here j M is a binary row vector from the matrix A: ] a ,....., a , [a M pj 2j 1j A j E j is the average of the row vector M j , p a E p 1 k kj j (2) a nd p 2 2 j kj j k= 1 1 (a -E ) p (3) 0 1 0 0 0 0 1 1 0 0 1 0 0 0 0 0 0 0 1 0 0 1 0 0 0 0 0 0 0 0 1 0 0 0 1 0 0 0 0 1 1 0 1 0 0 1 0 0 0 0 1 0 1 0 0 0 0 1 1 0 0 0 1 0 0 0 0 1 1 0 0 0 0 0 0 1 1 M7 M6 M5 M4 M3 M2 M1 P11 P10 P9 P8 P7 P6 P5 P4 P3 P2 P1 Figure. 2 . Initial machine - part incidence matrix The proposed similarity coefficient is based on th e simple correlation matrix the incidence matrix. The correlation matrix S is defined as follows : S ij is m x m matrix which elements are given by: 1 S ii and p 1 k jk ik ij b b p 1 S (4) The similarity matrix S is show in figure 3. Detailed description of principal component analysis can be found in the relevant literature such as [15], [16], [17] and others. 1,00 -0,38 -0,29 0,54 -0,38 -0,38 0,46 - 1,00 0,24 0,08 -0,38 -0,38 0,39 1,00 -0,29 -0,29 -0,29 0,62 1,00 -0,38 -0,38 0,46 - 1,00 0,54 0,46 - 1,00 0,04 - 1,00 M7 M6 M5 M4 M3 M2 M1 M7 M6 M5 4 M M3 M2 M1 Figure 3: similarity matrix S 2.2 Phase 2: Clust er analysis for correlation In the second phase of the proposed approach, the machine groups and part families are identified using factor and graphical analysis. The objective is to find machine groups, par t families and parts common machines using some classification scheme given by using Principal component analysis PCA representation of the data. Factor analysis is a powerful multivariate analysis tool used to analyze interrelationships among a large number of Figure.1. Architecture of the proposed approach Initial incidence 0/1matrix Standardization of the initial data (centered & reduced) Construction of the correlation matrix S Application of the ACP method Graphical analysis based in the two first s components Phase 1: Similarity coefficient matrix Phase 2: Cluster analysis for correlation Cell formation solution variables to reduce them into a smaller set of ind ependent variables called factors . Factor analysis was developed in 1904 by Spearman in a study of human ability using mathematical models [ 18]. Since then, most of the applications of factor analysis have been in the psychological field. Recently, its applications have expanded to other fields such as mineralogy, economics, agriculture and engineering. Factor analysis requires having data in form o f correlations, and uses different methods for extracting a small number of factors from a sample corr elation matrix. These methods include: common factor analysis, principal co mponent an alysis, image facto r analysis, and canonical f actor analysis. Detailed description of PCA method can be found in the relevant literature such as in [17], [18] and others. PCA is the most widely used. It is an in vestigated of the data that is largely widespread among users in many areas of science and industry. It is one of the most common methods used by data analysts to provide a condensed descripti on. PCA is a dimension reduction tech nique which attempts to model the total variance of the original data set, via new uncorrelated variables called principal com ponents. PCA consists in determining a small nu mber of principal components that recover as much variability in the data as possible. These components are linear combinations of the original v ariables and account for the total variance of the original data In this application of PCA , the objective is clusteri ng machines in group and parts in families. A binary decision i s applied at each machine and part. Two principal components are enough to analyse co rrelation between eleme nts (machines and p arts). There should be high correlation among machines strongly associated with the same cell, and low correlation among machines that are associated with different cells. The data can be represented by a two dimensional scatter plot (f ig ure. 4) where each machine is represented by a line from the origin and each part is represented by a dot located at its weight in each line (machi ne). Four principal situations for the classification of machines can be recovered: Two neighbor machines which h ave a low angle distance measure, consequently they belong to the same cell. Examples can be illustrated in the figure 4 by (M 4 and M 7 ) and (M 1 and M 5 ). Two machines which the angle d istance measure between them is almost 180°, this means that they are negatively correlated and m ustn t be belong to the same cell. Two machines which the angle d istance measure between them is almost 90°, this means that they independent, then they don t also belong to the same cell. Examples can be illustrated in figure 4 by (M 1 and M 3 ) and (M 4 and M 6 ). If no one of these three cases above is verified, the machine is affected to th e more neighbor than affected othe r machine. In the CF literature problem, this machine is called an exceptional machine. The same method is used for the classification of parts: when a part is close to a line ( machine), it is assigned to the cell which component this machine. Example can be illustrated in the figure 4 by (P 8 and M 7 ). Otherwise, it is an exceptional part which can be illustrated, for example, in the figure 4 by P 4 . In this situation, the exceptional p art is affected to the more neighbor than affected other machine. The part P 4 was affected to machine M 4 . Applying the second phase o f the proposed approach to these data sets yields the result shown in figure 5 . We obtained the following results: The best grouping for the seven machines is to group them into tree cells: cell 1 consists of machines 2 and 3; cell 2 consists of machines 1, 5 and 6; while cell 3 consists of machines 4 and 7. In addition, cell 1 contains parts 1 , 2, 6, and 9, cell 2 contains parts 3, 7, 9 and 11while cell 3 contains parts 4, 5, 8, an d 10. The final solution is shown in Table 1 . Table. 1. Final cell formation M2 M3 M1 M5 M6 M4 M7 P1 1 0 1 P2 1 1 P6 1 1 P9 0 1 P3 1 1 1 P7 1 1 0 P11 1 0 1 P4 1 1 0 P5 1 1 P8 0 1 P10 1 1 3 . C omputational results 3.1 P erformance criteria To evaluate the performance of the proposed approach, three objective criteria widely used in the literature are selected. These criteria are the percentage of ex ceptional elements, machine utilization, and t he grouping efficiency. sc a tter plo t (F 1 and F 2 ) PC = 69 ,65 % P 1 P 2 P 3 P 4 P 5 P 6 P 7 P 8 P 9 P 1 0 P 1 1 M 1 M 2 M 3 M 4 M 5 M 6 M 7 -2 -1 , 5 -1 -0, 5 0 0, 5 1 1 , 5 2 -2 -1 , 5 -1 -0, 5 0 0, 5 1 1 , 5 2 - - C o m p o ne n t F 1 ( 3 6 , 1 1 %) - - > Fig ure . 4 . Graphical illus tration of the scatter plot The first is called the Percenta g e o f Exceptional elements (PE) a nd defined as the ratio of t he num b er of elements to the number of unity elements in the incidence matrix: 100 UE EE PE (5) Where UE denotes the number of unity elements in the incidence (i.e. total number of operations in the data matrix). The second criterion is called Machine Utilization (MU) and indicated the p ercentage of time the machines within the clusters are u sed in production. MU is defined by [19 ] as 100 p m EE - UE MU NCell 1 k k k (6) Where m k and p k denote, respectively, the number of machines in cell k and number of p arts in family k . NCell is the number of cells. The t h ird crit erion is called Grouping Efficacy (G E) and defined by [19 ] as 100 VE UE EE - UE GE (7) Where VE denotes the number of voids elements in the diagonal blocks. A void indicates that a machine assigned to a cell is not required for the processing of a part in the cel l (number of 0s inside the diagonal blocks). 3.2 Performance measure In order to evaluate the proposed approach and to compare its performance with other cell formation methods, five sets of data (problems) have been chosen from the literature. Table 2 summarizes the results of the comparative study and the sources of these data sets, where the performance criteria without asterisks o n the left denote the results from the present approach and the performance criteria with asterisks on the right denote the best- known results in the literature Basically, the results of the proposed approach are the same as those found in recent literature ( [4], [5], [7] ). These recent researches w ere compared w ith former m e thods like R ank O rder Clustering [2], D irect Clustering Algorithm [3] and others. These recent researches d emonstrated to be better in comparative studies. Therefore, it could be said that the proposed approach is valid It is more flexible and able to get correlation information between each machine and part . 4. Final conclusion In this paper, a new approach is p resented for part- family and m achine-cell formation. T he main aim o f this ar ticle is to formulate a correlation analysis model to generate optimal machine cells and part families in GT problems. The correlation matrix for similarity machine and part is used as similarity coefficient matrix. The objective of PCA m ethod is clustering machines in group and parts in families. In addition it can find the optimal number of cells. This approach h as the f lexibility to allow the cell designer to either identify the required num ber of cells in advance, or consider it as a dependent variable. Another aspect of this research, which makes it easily portable into practice, is that it uses algorithms, which are available in many commercial software pack ages. For exam ple, factor analysis can be performed on most statistical packages including SPSS, SPAD, X LSTAT, S-PLUS, and others. The proposed approach has been developed to address some deficiencies in the existing cell formation methods. It remains to be seen how this approach can be extended to address other issues highlighted in the literature. Although the present approach focuses on the compactness of formation solution only, it can readily accommodate other manufacturing information such as production volume, sequence and alternative rou tings. Extending the proposed approach to this directio n is our interesting research perspective. References [1] Singh Nanua, Divakar Rajamani, (1996) Cellular manufacturing systems: Design, Planning and control , First edition, A textbook, ed. CHAPMAN & HALL. [2] K ing, J. R., ( 1980). Machine-component grouping in production flow analysis: an approach using a rank order clustering algorithm. International Journal of Production Research , 18(2), 213 232. [3] Chan, H., & Milner, D., ( 1982). Direct clustering algorithm for g roup formation in cellular manufacturing. Journal of Manufacturing Systems , 1(1), 65 67. [4] A lbadawi, Z., Bashir, H. A., Chen, M., (2005). A mathematical approach for the form ation of manufacturing cell, Computers & Industrial Engineering , 48, 3 - 21. Table 2 Summary of proposed approach results and the best - known results using published incidence matrices * Proposed approach results Best - known results No. Size N Cell PE MU GE PE * MU * GE * Reference 1 5 x 7 2 12.5 0 82.35 73.68 12.5 82.35 73.68 [21] King and Nakornchai (1982) 2 15 x 10 3 00.00 92.00 45.10 00.00 92.00 45.10 [3] Chan and Milner (1982) 3 8 x 20 3 14.75 100.00 85.25 14.75 100.00 85.25 [19] Chandrasekharan, and Rajagopalan (1986) 4 14 x 24 4 3.28 68.60 67.05 3.28 68.60 67.05 [2] King, (1980) 5 24 x 40 7 40.46 59.09 42.16 42.14 53.19 38.07 [19] Chandrasekharan, and Rajagopalan (1986) * The best - know results found in the literature [5] Wang, J., (2003). Formation of machine cells and part families in cellular manufacturing systems using a linear assignment algorithm. Automatica , 39, 1607 - 1615. [6] Boctor F. F., (1991). A linear formulation o f the machine -part cell formation problem. International Journal of Production Research , 2 9, 343 - 356. [7] Cheng, C. H., Goh, C. H., Lee, A., (2001). Designing group technology manufacturing systems using heuristic branching rules. Co mputers & Industrial engi neering , 40, 117 - 131. [8] Mukattash, A., M., Adil, M. B., Tahboub, K., K., (2002). Heuri stic approaches foe part assignment in cell formation. Computers & Industrial Engineering , 42, 329 341. [9] Stawowy, A., (2006) Evolutionary strategy for manufacturing cell design. The international Journal of Management Science: Omega , 34, 1 18. [10] Joines, J. A., King, R., E., Culbreth, C., T., (1996). A comprehensive Review of Production- Oriented Manufacturing Cell Formation Techniques. Research funded by the NCSU Furniture Manufacturing and Management Center , North Carolina State University, DDm - 92 - 15432. [11] Yin, Y., Kazuhiko, K., (2006). Similarity coefficient methods applied to the cell formation problem: A taxonomy and review. International Journal of Production Economics . 101, 329 352. [12] Gupta, T., Saifoddini, H., (1990). Production data ba sed similarity coefficient for machine-component grouping decisions in the design of a cellular manufacturing system. International Journal of Production Research , 28, 1247- 1269. [13] Seifoddine, H., Djassemi, M,. (1995). Merits of the production volu me based similarity coefficient in machine cell formation. Journal of Manufact u ring Systems , 14, 35- 44. [14] Chaea, S. S., W ardeb, W., D, (2005). Effect of using principal coordinates and principal components on retrieval of cluster s. Computational Statistics & Data Analysis. [15] Ledauphin, S., Hanafi, M., Qannari, E., ( 2004). Simplification and signification of p rincipal components. Chemometrics and Intelligent Laboratory Systems, 74, 277 281. [16] Delagarge, J., (2000). « Initi ation à l analyse des données » ; 3 ième édition, Ed Dunod. [17] Labordere, A. H., (1977). « Analyse de données : application et méthodes pratiques ». Ed Masson. [18] Rummel, R. J. (1988). Applied factor analysis. Evanston: Northwestern University Press. [19] Chandrasekharan, M. P., Rajagopalan , R. (1986). An ideal seed n on-hierarchical clustering algorithm for cellular manufacturing. International Journal of Production Research , 24, 451 464. [20] Kumar, K. R., Chandrasekharan, M. P., (1990). Grouping efficacy: a quantitative criterion for goodness of block diagonal forms of binary matrices in group technology. International Journal of Production Research , 28(2), 233 43. [21] K ing J. R., Nakornchai V., (1982). Machine - component group formation in group technology: review and extension, International Journal of Production Research , 20, 117 133.
Original Paper
Loading high-quality paper...
Comments & Academic Discussion
Loading comments...
Leave a Comment