Spreadsheet End-User Behaviour Analysis
To aid the development of spreadsheet debugging tools, a knowledge of end-users natural behaviour within the Excel environment would be advantageous. This paper details the design and application of a novel data acquisition tool, which can be used fo…
Authors: ** Brian Bishop, Kevin McDaid **
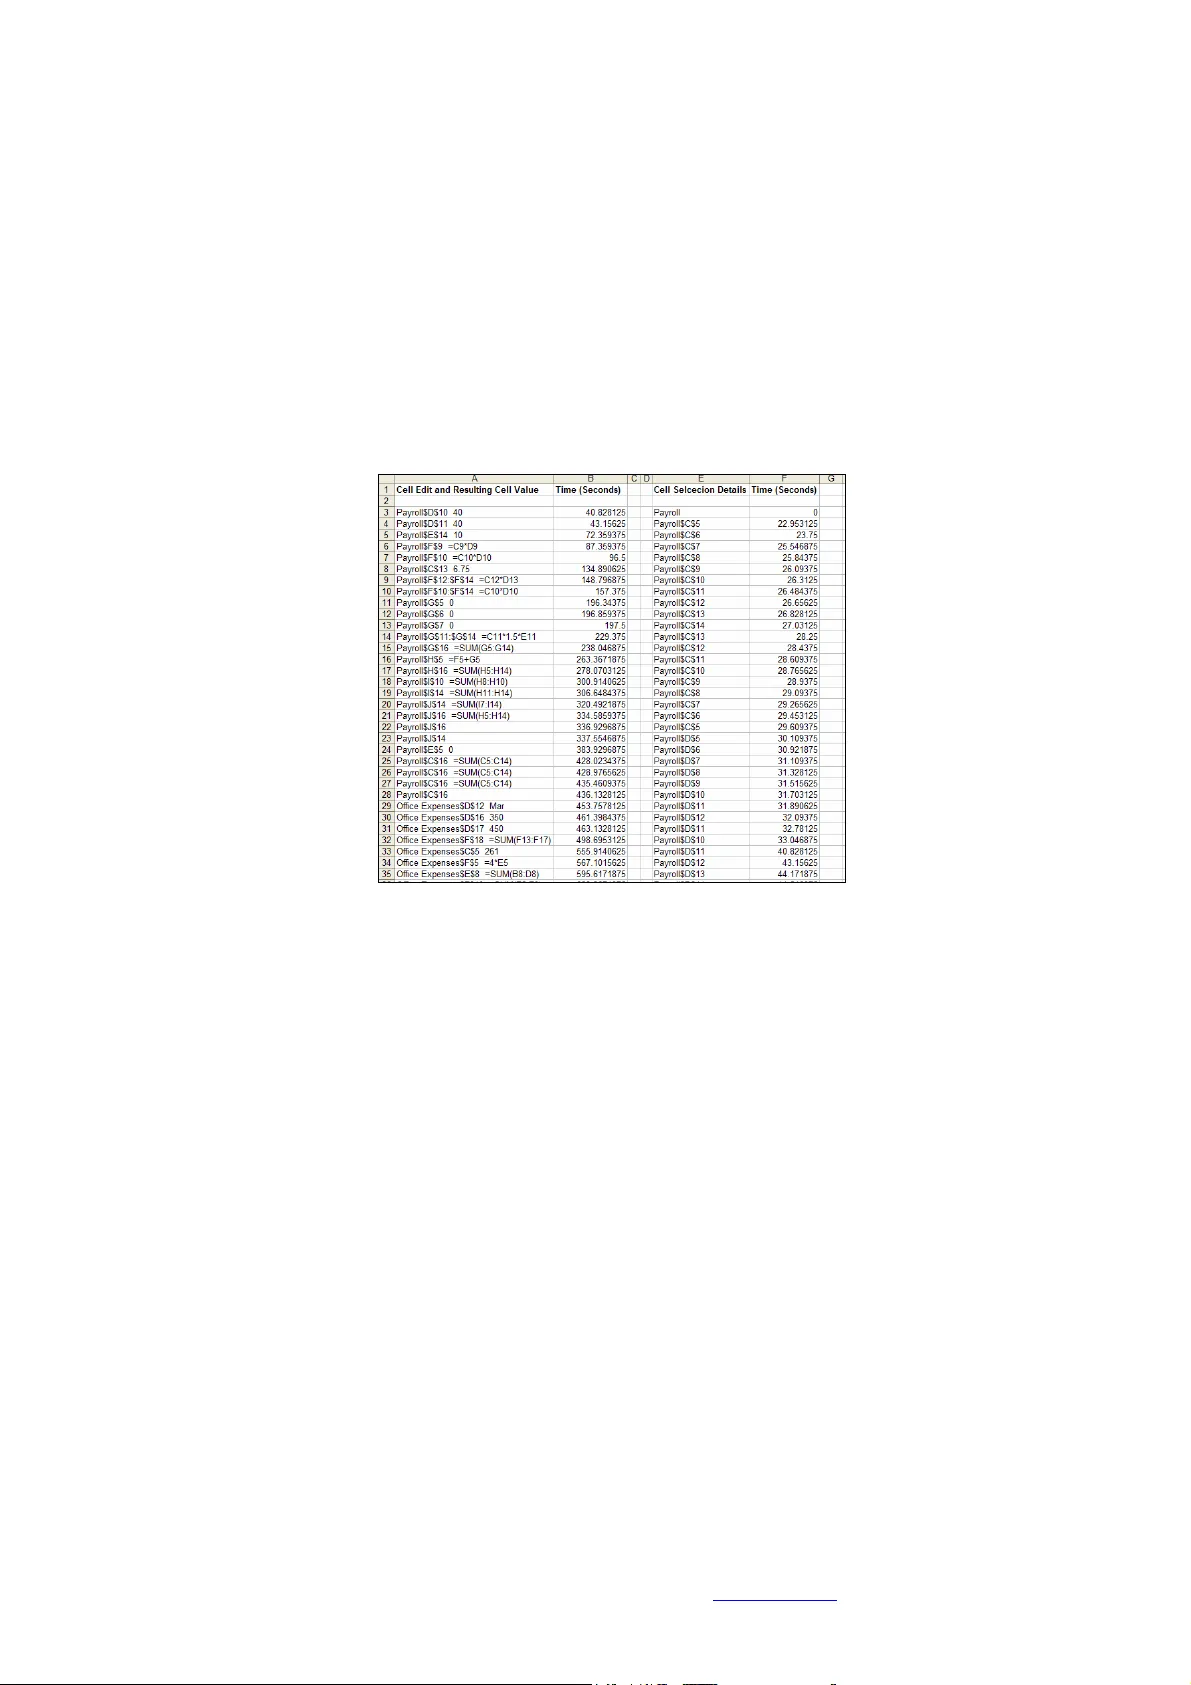
Spreadsheet End-User Beh aviour Analysis Brian Bishop, Kevin McDa id Proce edings of EuSpRIG 2 008 Conference " In P ursuit of Sprea dsheet Excellence " ISBN : 9 78-90561 7-69-2 Copyright © 2008 Europ ean Spreadsheet Risks Interest Group ( www.eusprig.org ) and Autho rs 141 Spreadsheet End -User Behaviour A nalysis Brian Bishop, Kevin McDa id Dundalk Institute of Technology, Dundalk, Ireland brian.bishop@dkit.ie , kev in.m cdaid@dkit.ie ABSTRACT To aid the development of spreadsh eet debuggin g tools, a knowledge of end-users natural behaviou r within the Excel environm ent wo uld be advantageou s. This pap er deta ils the design and applica tion of a novel da ta acquisition tool, which can be used for the u nobtrusive record ing of end-u sers mouse, keyb oard a nd Excel sp ecific action s du ring the d ebugg ing of Exc el sprea dsheets. A debuggin g experiment was con ducted using th is d ata acquisition tool, and based on analysis of end-u sers perfo rmance and behaviour data, the authors developed a ‘ spreadsheet cell coverage feedbac k’ debugging tool. Res ults from the d ebugg ing experiment are p resented in terms o f end- user debug ging performa nce and beha viour, and the ou tcomes of an evaluation e xperiment with the deb ugging tool are d etailed. 1. INTRODUCTION The reported u sage of spreadsheet programs spans a wide variety of job functions, purposes and industries. In a survey of nearly 1600 respondents, Baker et al [2006] found that sp readsheets were used by end-users in various job functions including finance, engineering, m anufacturing, m arketing, sales and administration, and f or many dif ferent purposes, such as m aintaining lists, analysing and tracking data and determining tr ends. Iyengar & Svirbely [2005] reported on the usage of a website that made available medical algorithms in the for m of MS Excel files, and the users o f the website included physicians, nurses, healthc are professionals, computer sc ientists etc. May be more than any other industry , spreadsheets are of critical importance to the finance sector [Croll, 2005]. In a st udy on the use of spreadsheets in organisations in the City of London, Croll [2005] found that with rega rd to the financial m arkets: “Excel is utterly pervasive. Nothing large (good or bad ) happens without it pass ing at some time though Excel.” The most r ecent study that i nvestigated spreadsheet error rates was conducted by Powell, Baker & Lawson [2007], who reported th at of the 50 real-world operational spreadsheets they aud ited, 94% contained errors. T o help alleviate the p roblem of spreadsheet errors, a number of tools are availa ble to aid in the d ebugging of spr eadsheet p rograms. These tools are both academ ic [Burnett et al, 2002], [Abra ham & Erwig, 2007], [Clermont & Mittermeir, 2003] and commercial products such as Spreadsheet Professional (www.spreadsheetinnovati ons.com) a nd R edRover Audit (ww w.redroversoftware.com ). In order to de velop tools that complement end-users natural behav iour, some knowledge of that b ehaviour would be required. T he concept of human-centered development in software enginee ring coul d be app lied to the developm ent of spreadsheet debugging tools. Norman [1999] stated that “At its core, hum an-centered product de velopment requires developers wh o understand people and the tasks they wish to achieve. I t means starting by observing and working with users”. At present, there is very little em pirical Spreadsheet End-User Beh aviour Analysis Brian Bishop, Kevin McDa id Proce edings of EuSpRIG 2 008 Conference " In P ursuit of Sprea dsheet Excellence " ISBN : 9 78-90561 7-69-2 Copyright © 2008 Europ ean Spreadsheet Risks Interest Group ( www.eusprig.org ) and Autho rs 142 data available to researche rs on the processes and actions of end-users while debugg ing Excel spreadsheets. This paper details t he design and application of a novel custom built data acquisition tool. An experiment was conducted with 47 subjects (professionals and students), the aim of which was to record and analyse the perform ance and behaviour of expert and novice end-users while debugging an experimental spreadsheet model. Using the data gathered by the data ac quisition tool, analysis was conducted which led the authors to develop a simple ‘spreadsheet cell coverage feedback’ debugging tool . Res ults from the experi men t are presented in terms of en d-user debugging performance and behaviour, and the outcomes of an evaluation experiment with the debug ging tool are deta iled. The layout of the paper is as fo llows. Section 2 details data acquisition methods currently available and commonly used, and the custom built data acquisition tool developed by the authors. I n Section 3, an experiment in wh ich the data ac quisition tool was utilised is described, and re sults are presented in terms of expert and novice performance and behaviour. The de bugging t ool developed b y the authors i s detailed i n Section 4, along with results of an evaluation of the debugging tool which involved further use of t he data acquisition tool. A conclus ion to the paper is in S ection 5. 2. DATA ACQUISITION IN SPREADSHEET RE SEARC H A number of methods are available for acquiring human computer interaction ( HCI ) data during exp eriments. These in clude v ideo recording, screen recording, thinking-aloud protocol and eye-gaze t racking. These methods require subjects to be onsite with the researcher, or a t t he v ery least for the sub ject t o install some recording software o r equipment on t heir pc or within t heir working environment. A problem with data capture when using the somewhat intrusive data acquisition methods m entioned, is that a person’s behaviour c hanges when they a re aware that t hey are being observed. T his p henom enon is commonly referred to as the obse rver effect, and also as the Panopticon effect or t he Heisenberg effect [Liffick & Yohe, 2001]. To lessen the effects associated w ith using intrusive data acquisition m ethods, a mouse- and-keystroke type r ecording t ool was developed by the a uthors, which could be embedded within an Excel spreadsheet, and as such be used remotely by subjects without the need for the au thor’s presence. One of the main advantages of recording mouse-and- keystroke i nduced UI (user interaction) e vents is that they “ provide exce llent dat a for quantitatively characterising on-line (on-screen) behaviour ” [Hilbert & Redmiles, 2000], and with this type of non- intrusive system monitoring the “ influence on participants by observation is zero ” [Spa nnagel, Gläser-Zikuda & Schroeder, 2005]. The authors be lieve that the influence on pa rticipants would not b e z ero, as subjects should b e c learly informed of the data capture method bei ng used, but nevertheless, the i nfluence would be considerably lower than that o f video recording and think-aloud methods. The next section details the design an d workings of t he data ac quisition tool d eveloped by the authors. 2.1 Custom Built Data Ac quisition Tool: T-CAT The authors developed a ‘ti me- stamped cell activity tracking t ool’ (T -CA T) in V BA, which mak es us e of MS Excel’s macro programm ing e nvironment. The main advantages of dev eloping T-CAT in VBA a re: 1 ) The tool could be embedded in ex perimental spreadsheet models with no software i nstallation required by participants and 2) The tool Spreadsheet End-User Beh aviour Analysis Brian Bishop, Kevin McDa id Proce edings of EuSpRIG 2 008 Conference " In P ursuit of Sprea dsheet Excellence " ISBN : 9 78-90561 7-69-2 Copyright © 2008 Europ ean Spreadsheet Risks Interest Group ( www.eusprig.org ) and Autho rs 143 could easily access MS Excel’s event listeners such as the Workbook functions: Open, BeforeClose, SheetActivate , SheetChange, and S heetSelectionChang e. A fl owchart for T-CAT can be seen in Fi gure 1. T he tool was designed to record the time and detail of all cell selection and cell change actions of individuals when deb ugging a spreadsheet. The T -CAT tool ‘listens’ f or cell activity events, such as: worksheet selections, cell selections and cell edits. When an e vent occurs, the tool records al l the details associated with the event, and stores them to a rrays. When the spreadsheet i s closed, MS Excel’s (VBA’s) BeforeClose event is initiated, a nd the values stored in the details arrays are printed to a hidden worksheet. A popup message box then r equests that the user email the spreadsh eet to the researcher. Figure 1: Flowchar t for T-CAT The data recorded by T-CAT during the debugging proc ess is a s follows: Individual c ells selected, cell ra nges s elected, worksheet selections, i ndividual cells edited and the resulting cell or formula values, cell ranges changed and resulting cel l or formula values. Timestamps are recorded for all of the ab ove (i n seconds and milliseconds). More complex spreadsheet activities can also be identified from the re sulting data l og, including copy and pa ste, undo typing, redo typing and drag-and-fill. I t should be noted that the T -CA T tool does not re cord the use of nativ e Excel debugg ing aids s uch as switching to Formula View or Tracing Pr ecedents/Dependents. As mentioned earlier, t he data recorded by T-CAT is printed to a hidden work sheet within t he experimenta l Spreadsheet End-User Beh aviour Analysis Brian Bishop, Kevin McDa id Proce edings of EuSpRIG 2 008 Conference " In P ursuit of Sprea dsheet Excellence " ISBN : 9 78-90561 7-69-2 Copyright © 2008 Europ ean Spreadsheet Risks Interest Group ( www.eusprig.org ) and Autho rs 144 spreadsheet whe n the spreadsheet is closed. Figure 2 shows a sample of d ebugging data recorded by T-C AT. Looking at c ell ‘A3 ’ from Figure 2, th e value sho ws that the cell ‘D10’ on the ‘Payroll’ worksheet was edited after 40.828125 secon ds, with a resulting cell value of ‘40’. T he process of editing t his cell can be determined by looki ng at ce lls ‘E/F32’ and ‘E/F33’ in the same figure; ‘Payroll D10’ was selected after 33.046875 seconds, was edited, and then the Return key was pressed bringing the control to ‘Payroll D1l’. T he move of cell focus from ‘Payroll D10’ to ‘Payroll D11 ’ (as can be seen from cells ‘E32 - E33’ in the figure) shows that the cell edit was completed after 40.828125 seconds elapsed time. This gives a time for editing cell ‘Payroll D10’ of 7.78125 seconds. Figure 2: Sample of T-CAT Recorded Spre adsheet D ebugging Data 3. T-CAT APPLIED IN A SPREADSHEET DE BUGGING EXPERIMENT The T-CAT data acquisiti on tool was an integral part of a s tudy [Bishop & McDaid, 2007] under taken by the authors that aimed to record and analyse the perform ance a nd behaviour of 47 profession al and student spreadshe et users while debug ging a spreadsheet model seeded with errors. Participants were in structed t o debug the spreadsheet, and each error f ound was to be corrected directly in t he spreadsheet itself. T he spreadsheet model was adapted from a model used in [Howe & Simkin, 2006]. T he names and f unctions of the spreadsheet’s three worksheets were as follows: Payroll , compute typical payroll expenses; Office Expenses , compute office expenses; Projections , perform a 5-year projection of f uture expenses. Each worksheet had different e rror characteristics. Payroll had data entry, rul e violation and formula errors; Office Expenses had clerical, data entry and formula er rors; Proje ctions had m ostly formula er rors. The spreadsheet m odel, experiment methodology and sam ple are presen ted and described in d etail i n [Bi shop & McDaid, 2007 ]. T he updated findings from t his experim ent, which relied heavily on the data captured by T -CA T, are presented below i n term s of debugg ing performance, debugging behav iour, and overall cell cov erage. 3.1 Overall Debugging Performance Formal tests of significance for the difference between the results of student and professional debugging performance were conducted. One si ded hypothesis te sts, based Spreadsheet End-User Beh aviour Analysis Brian Bishop, Kevin McDa id Proce edings of EuSpRIG 2 008 Conference " In P ursuit of Sprea dsheet Excellence " ISBN : 9 78-90561 7-69-2 Copyright © 2008 Europ ean Spreadsheet Risks Interest Group ( www.eusprig.org ) and Autho rs 145 on the Student T distribution and examining whether the mean performance of professionals exceeded the mean pe rformance of students in discovering t he four types of errors, were conducted using a si gnificance le vel of 5%. Gi ven the r elatively lo w number of professional subjects and the uncertainty as t o the nature of the distribution of the number of errors found by individual participants the one sided tests of a difference in the measure of centrality were also conducted using the non param etric Mann- Whitney U- test. Figure 3: Debugging Performance – P rofessional a nd Student From the ev idence of the ov erall resul ts for student s and profes sionals given in Fig ure 3 and t he distinctions between the two group s for each error type, the professional group has been shown to outperform the student group. To determine if the overall difference between the two groups was statistically significant, t-tests were perform ed on the number of errors corrected for both the professionals and st udents, see F igure 3. The P- value of 0.000063, along with a Mann-Whitney U-test P -v alue of 0.001313, indicates that professionals outperform stude nts in spreadsheet debugg ing and that the diff erence is statistically si gnificant. The expert spreadsheet users also completed the debugging of the spreadsheet in a shorter tim e. Expert subjects completed the task i n an average of 28 minutes, while the novice s ubjects completed the debugging t ask i n an average 36 minutes. Overall, the e xpert spreadsheet users were found t o be more efficient and effective spreadsheet debuggers than the novice spreadsheet users. They were found to be significantly better at debu gging Rule Violation an d Form ula errors. 3.2 Debugging Behaviour In order to determine the m ain ar eas within the spreadsheet that t he participants focused on duri ng the debugg ing e xperiment, a ‘ coverage per cell’ data analysis tool was developed which calculates, for e ach cell in the s preadsheet, the percentage of participants that inspected that cell. T here were som e difficulties in quantitatively representing professional and student participant’s main areas of spreadsheet cell f ocus in a manner that would be int uitive and m eaningful. Given that the hum an visual system is very good at c lustering and reco gnising patt erns and trends i n data visualisations [Bealle, 2007], t he data generated dur ing the coverage per cell analysis was collated and represented in the form of colour coding within each of the three worksheets that m ade up the experimental s preadsheet. The colour coding made it e asier to r ecognise the groups of cells that participants inspected and the difference between the student and profe ssional participant’s behaviour. An e xample of the colour coding can be seen for the Projections worksheet i n Figure 5 and Figure 6 (Professional and Student coverage respectively), i n which the individual cells are colour coded t o show what percentage of the participa nts inspected them. Cells that contained column or row headings ha ve been left unmarked, so the structure of the spreadsheet is clear. Cells that contained form ulas, data or seeded errors are represented as fol lows: Spreadsheet End-User Beh aviour Analysis Brian Bishop, Kevin McDa id Proce edings of EuSpRIG 2 008 Conference " In P ursuit of Sprea dsheet Excellence " ISBN : 9 78-90561 7-69-2 Copyright © 2008 Europ ean Spreadsheet Risks Interest Group ( www.eusprig.org ) and Autho rs 146 • F – cell contains a form ula. • D – cell contains a data val ue (numeric data value). • C Error – cell contains a se eded clerical error. • RV Error – cell contains a s eeded rule violat ion error. • D Error – cell contains a se eded data entry error. • F Error – cell contains a see ded formula error. This a nalysis was carried out separately for both the student and profe ssional subjects with the minimum time specified for a cell to be considered inspected set at 0.3 seconds. The minimum specified time of 0.3 seconds was set based on analysis of the minim um time it took participants to inspect a c ell. The colour coding key can be seen in Figure 4. The bands of colour represe nt the percentage o f participants that inspected each cell. Figure 4: Coverag e per Cell Colour C oding Key It was foun d that for all worksheets and both participant groups, form ula cells took precedence over data cells, but a greater percentage of pr ofessional participants l ooked at each cell. Summ ation formula cells and bo ttom- line val ue cells received more attention than othe r form ula cells. Form ula cells that outputted text values were not inspected as much as formula cells that outputted numeric values. This was the case for bo th the professionals and students. A key finding concerned the i nspection rates f or some of the logically equivalent groups of formula cells. Participants check ed the first cells in these groups, either the topmost cells i n the case of v ertically oriented group s o r the leftm ost c ells for hori zontally oriented groups, and a distinct d rop-off in inspection r ates could be seen for the r est of the cells in t hese logically e quivalent groups. This was the c ase for both the professional and student participants, but thi s behaviour was more ev ident for the stud ent (novice) sam ple. Figure 5: Professionals - Project ions Sheet Cov erage Spreadsheet End-User Beh aviour Analysis Brian Bishop, Kevin McDa id Proce edings of EuSpRIG 2 008 Conference " In P ursuit of Sprea dsheet Excellence " ISBN : 9 78-90561 7-69-2 Copyright © 2008 Europ ean Spreadsheet Risks Interest Group ( www.eusprig.org ) and Autho rs 147 Figure 6: Students - Pr ojections Sheet Co verag e 3.3 Overall Cell Coverage In software testing the quality of test suites is often measured through coverage-based measures which are considered to relate closely to test e fficiency. It i s interesting t o investigate whether a similar relationship between coverage and performance might e xist in the context of spreadsheet debugging. Figure 7 shows a scatterplot f or errors corrected versus coverage (blank cells and label cells excluded) including a linear r egressio n model for professionals and students, where the m inimum tim e specified f or a c ell to be considered i nspected/check ed was >0.3 s econds. The statistical outliers are circled; these are participants that had standard residuals o f <-2 or >2. T he R 2 value of 0.6199 indicates a moderate correlation. Figure 8: Errors Cor rected/Cell Co verage (outliers re moved) In an attempt t o determine what effect the statistical outliers were having on t he correlation, the scatterplot in Figure 8 was created. This scatterplot is similar to Figure 7, with the sam e specified minimum time of 0.3, bu t w ith the three statistical outliers circled in Figure 7 rem oved. The R 2 value increased to 0.7107. Although not c onsidered as statistical outliers, the two lowest values on the sc atterplot i n Figure 7, which are two values closest to the bottom -left of that char t, were co nsidered Figure 7: Errors Cor rected/Cell Co verage (outliers circ led) Spreadsheet End-User Beh aviour Analysis Brian Bishop, Kevin McDa id Proce edings of EuSpRIG 2 008 Conference " In P ursuit of Sprea dsheet Excellence " ISBN : 9 78-90561 7-69-2 Copyright © 2008 Europ ean Spreadsheet Risks Interest Group ( www.eusprig.org ) and Autho rs 148 likely t o b e having a significant effect on the relationship present. To determine what t his effect might be, these two values wer e r emov ed. This resulting scatterplot (not shown) represented all the available participants, but with the two lowest performers rem oved. This resulted in an R 2 value of 0.4989, which is c onsidered to be a moderate relationship, indicating that the two lowest perform ers' results were increasing the R 2 value by 0.121. Note that t he equation of the best fitting r egression line for this reduced da ta set was y = 0.7701x + 8.1019, compared with y = 0.769 4x + 8.1536 f or the line in Figure 7, showing that the slope and intercept change little with the r emoval of the outliers. 4. DEBUGGING T OOL DEVELOPMENT From anal ysis carried out on the spreadsheet debugging e xperiment data, see previous section, a c orrelation was shown to exist between the number of cells inspected and edited, and debugging performance. In traditional software development, th e average lines of code inspected and average inspection rates are key m etrics used in the code inspection phase of software V&V [Barnard & Price, 1994]. T he number of cells inspected during de bugging in the spreadsheet parad igm is somew hat equivalent to the lines of code insp ected metric used in traditional software V&V. Based on the findings from the spreadsheet debugging experiment, and the use of lines of code inspected metrics in traditional sof tware V&V, a spreadsheet debugging tool was developed that allows the spreadsheet debugger to view those cells that have and have not been inspected. T he debugging tool runs concurrently with the T-CAT tool, and uses data gathered by T-CAT to give feedback to users on cells that have been inspected during the debugging process. 4.1 Debugging Tool: Ce ll Coverage Feedback The debugging tool can be installed as an Excel add-in. Once installed, a button titled ‘Highlight’ is added to e ach worksheet; see Figure 9. When a user c licks on this butt on, any ce lls that hav e not yet been edited, or selected for a minim um specified t ime of 0.3 seconds, become highlighted. The user can then insp ect the highlighted cells . Again, the minimum specified time of 0.3 sec onds was set based on analysis of the minimum t ime it took participants to ins pect a cell, although future versions of the tool m ight possibly allow for altering of specified time depending on cell inspection spee ds. An example of a worksheet in which the Highlight button has been clicked, with any cells that had not been inspected highlighted in g rey, can be seen in Fig ure 9. Figure 9: Debugging Tool Highlighting Spreadsheet End-User Beh aviour Analysis Brian Bishop, Kevin McDa id Proce edings of EuSpRIG 2 008 Conference " In P ursuit of Sprea dsheet Excellence " ISBN : 9 78-90561 7-69-2 Copyright © 2008 Europ ean Spreadsheet Risks Interest Group ( www.eusprig.org ) and Autho rs 149 The debugging tool was developed using V BA. When the Highlight button is clicked, the debugging tool is a ctivated. Any c urrent highlighting on the worksheet, that was a res ult of the Highlight button having p reviously be en clicked, is c leared. T he current worksheet name i s recorded. Any tim e-stamped cell activity data that has been recorded by the concurrently ru nning T-CAT tool i s retrieved a nd stored t o an array. The array is traversed, and each elem ent o f the a rray (the elements of the ar ray represen t a cell selection or cell edit activity) is checked. If the cell (element) i n question is a formula cell, or a data cell, a nd if the cell ha s not been edited, or has not been selected for >0.3 seconds, then that cell is highlighted. Only those cells f rom the worksheet on which the Highlight button was clicke d can be affected. This pro cess is repeated fo r all recorded cell selection and cell edit actions. If the Highlight button is clicked again, th e highlighting is updated. 4.2 Debugging Tool Evalu ation Experiment In order to evaluate t he debugging tool, a sec ond experiment was conducted. The sample for this second exper iment was made up of 16 fourth year Softwa re Developm ent students. T he students were randomly se lected and assigned to one of two groups. The 8 participants in the control group, Group-A, debugged the spreadsheet w ithout the t ool. The d ebugging t ool was made available t o the 8 participants in the test group, Group- B, and instructions were given to them on how to use the tool. The participant w orked on similar computers using Micros oft Excel 2000. When the spreadsheets were cl osed, all of the d ata relating to any hig hlighting actions (time s Highlight button was clicked, cells affected etc.) w as printed to another workshee t. This data c ould then be analysed t o identify how subjects used and interacted with th e debugging tool. Performance The overall debugging performance categorised by error type for the eight participants not using the debugging tool, Group- A, and t he eight Group- B participants t o whom the debugging tool was available c an be seen i n Figure 10. The test group part icipants who used the cell coverage tool corrected slightly more errors overall, 62%, than th e control group, Group-A , correcting 59% of the errors. Figure 10 : Debugg ing Performance: Gro up-A and Group-B (using cove rage too l) The test g roup corrected 9 % more clerical erro rs, 6% more rule violation errors and 9 % more data entry e rrors. The s ame number of formula errors were corrected by both groups. However, based on a 5% significance level, there is no statistical ly significant evidence that the tool a ids students to find Cle rical/Non- Material, Rules Violation, Data Entry or Formula errors. Following a detailed examination of the b ehaviour of Group B participants i t was found that 25 more errors were det ected and corrected i n cells ide ntified by the t ool a fter Spreadsheet End-User Beh aviour Analysis Brian Bishop, Kevin McDa id Proce edings of EuSpRIG 2 008 Conference " In P ursuit of Sprea dsheet Excellence " ISBN : 9 78-90561 7-69-2 Copyright © 2008 Europ ean Spreadsheet Risks Interest Group ( www.eusprig.org ) and Autho rs 150 participants had chosen t o use the tool on a shee t. This amounted to a 7.4% i ncrease in error correction overa ll. Of cours e, these e rrors may ha ve been found without the use of the t ool. Of t he 25 extra errors corrected, 22 were formula errors, 2 were data entry errors and 1 was a clerical error. It is important t o note that this analysis must be considered i n light of t he chang e in debu gging behaviour of the use r due to the tool. Som e users may consult the tool very r egularly and thus most cells will be highlighted and any errors found may be considered as ones identified by the tool. This work next investig ates the impact of the tool on cell cov erage and the behaviour of the debugg er. Impact of the Tool on Cel l Coverage The cell coverage for participants in Group A and B ca n be se en in the boxplot in Figure 11. The test group using the cell coverage tool achieved a significantly hi gher cell coverage rate than the co ntrol group. The m inimum time specified for a cell to be considered inspected was >0.3 seconds. T he overall average c ell co verag e f or Group B was 90%, 26% higher than Group A, who achieved an overall average cell coverage of 64%. 0 10 20 30 40 50 60 70 80 90 10 0 G rou p A - No Tool Group B - Cov era ge Tool Sam ple Ce ll Cover age Figure 11 : Cell Co verage Boxplot: Group A and B . Subject Behaviour Whi le Using the Debugging Too l Although the 8 Fourth year Software Development st udents who took part in the experiment were given the same instructions for using t he cell coverag e debugging tool during the debugg ing process, there was som e differences in the way eac h student used the t ool. The following figures represent two of the eight e xamples of participant behaviour i n u sing the tool a nd serv e to investigate the impact of the tool o n de bugging behaviour. Figure 12 shows the behaviour of one of the participants using the debugging tool. What can be seen is that the participant clic ked the ‘ Highlight’ button on the ‘Payroll’ shee t after 3285 seconds and 8 cells became highlighted. This process was r epeated f or the ‘Office Expenses’ and ‘Pr ojections’ s heet. T he pa rticipant in t his case had inspec ted almost all of the cel ls in the spreadsheet, and when the highlight b uttons were clicked, only a few cells becam e highlighted. In this case, t he participants de bugg ing behaviour does no t se em to hav e been affected by the tool in that they waited until they had completed the entire task before utilising the tool, and the few cells that were highlighted could be checked by the pa rticipant as desired. Spreadsheet End-User Beh aviour Analysis Brian Bishop, Kevin McDa id Proce edings of EuSpRIG 2 008 Conference " In P ursuit of Sprea dsheet Excellence " ISBN : 9 78-90561 7-69-2 Copyright © 2008 Europ ean Spreadsheet Risks Interest Group ( www.eusprig.org ) and Autho rs 151 0 1 2 3 4 5 6 7 8 9 3280 3290 3300 3310 3320 3330 3340 3350 D e bu g gin g Tim e (s e co nd s ) N umbe r of H ig hli ghted Cel ls P ayr oll Off ice E xpens es P rojections Figure 12 : Debugg ing Tool Behav iour: Subject 1 The behaviour of another participant, as repre sented in Figure 13, appears t o involve the use of the cell coverage d ebugging tool to a greater extent. T he figure shows that the highlight b utton on t he ‘Payroll’ shee t was c licked 4 tim es. I t a lso shows t hat the participant re-inspected the ‘Payroll’ and ‘Office Ex penses’ sheets, using the cov erage tool each time. Using the t ool the participant rechecked the first two sheets before finalising the task. 0 5 10 15 20 25 30 35 40 0 500 1000 1500 2000 2500 3000 3500 D e bug g ing Tim e (s e co nd s ) Num ber of Cells Highlig ht ed P ayr ol l O f f ice E x penses P rojectio ns Figure 13 : Debugg ing Tool User Beha viour: Subj ect 3 Overall, it was found t hat the subjects interacted with the debugging tool in different ways and to d ifferent e xtents. Hence, it m a y be benef icial to ex plore and develop a supporting process which would guide the debugg er in th e use of t he tool in the most advantageous manner. Rese arch is ongoing in this reg ard. 5. CONCLUSION This paper details t he design and successful implementation of a cu stom built data acquisition method and tool (T-CAT) for t he spreadsheet research area. T he T-CAT tool was an integra l part of a spreadsheet debugging exper iment under taken by the authors. Based on findings from anal ysis of debugg ing beha viour recorded by T-CAT, a debugging tool was developed by the authors, and i ts effects on debugging performance were investigated by means of a controlled experiment. Although the debugging t ool was not as e ffective as was initially h oped, the debugging performance of subjects using the tool was slightly higher ov erall, and overall cell covera ge was significant ly higher. The T- CAT data acquisi tion tool was used in both experim ents, and along with increasing the authors understanding of end-users’ natural debugging behaviour, it also aided i n t he design and evaluation of th e debugging tool. Spreadsheet End-User Beh aviour Analysis Brian Bishop, Kevin McDa id Proce edings of EuSpRIG 2 008 Conference " In P ursuit of Sprea dsheet Excellence " ISBN : 9 78-90561 7-69-2 Copyright © 2008 Europ ean Spreadsheet Risks Interest Group ( www.eusprig.org ) and Autho rs 152 REFERENCES Abraham, R. and Erwig, M. (2 007), “GoalDebug: A Spreadsheet Debugger for E nd Users”, In Proceedings o f the 29th international Conference on Software Engineering, May 20 - 26, 2007. Baker, K. R., P owell, S. G., La wson, B. and F oster-Johnson, L. (2 006), “Comparison o f Characteristics and Practices am ong Spreadsheet Users with D ifferent Levels of Experience”, Proceedings of the European Spreadsheet Risks Interest Group , 2006. Barnard, J. Price, A. (1994), “Managing Code Inspection Information”, IEEE So ftwa re, 11 , 2 (Mar. 1994) Bealle, R. (2007), “Supporting serendip ity: Using ambient intelligence to augment user exploration for data mining and we b bro wsing”, International Journal of Human-Compu ter Studies, Volume 65 , Issue 5 , P ages: 421-433. Bishop, B. & McDaid, K. (2007), “An E mpirical S tudy of E nd-User Beh aviour i n Spreadsheet Error Detection & Correction”, P roceedings of the European Spreadsheet Risk Interest Group Conference, 2007. Burnett, M., Shereto v, A., Ren, B. & Rothermel, G. (200 2), ‘Test Homogenous Spreadsheet Grids with th e ‘What You See Is What You Test’ M ethodology’”, IEEE Transaction s on Software Engineering, V ol. 28, No. 6, pp 576-594. Clermont, M. and Mittermeir, R. (2003), “Auditing large sp readsheet pr ograms”, ISIM'03, Proceedings of the 6th International Con ference, pages 87-97, 2003. Croll, G. (2005), “The importance and criticality of spreadsheets in the city of Lond on”, Proceedings of the European Spreadsheet Risks Interest Group, 2005 Hilbert, D. M. and Redmiles, D. F . (2000), “Extracting usability i nformation from u ser interface events”, ACM Computing Surveys, 32(4 ), 2000, pp384-421. Howe, H. and Simkin, M.G. (2006), “Factors Affecting the Ability to Detec t Sp readsheet Errors”, Decision Sciences Journal of Innovative Education, January 2006/Vol.4, No. 1. Iyengar M .S. and Svirbely J. R. (2005 ), “Computer-based m edical algorithms: Overview and experiences”, Technology and Health Care, 13 (5); 403-405. Liffick, B. W. an d Yohe K. L. (200 1), “Using surveillance soft ware as an HCI tool”, P roceedings of ISECON 2001, v 18 (Cincinnati), 2001. Norman, D.A. (1999), The Invisib le Computer, MIT Press Cambridge, MA, USA. Powell, S. G., Baker, K R. & La wson, B. (2007), “Errors in Op erational Spreadsh eets”, [On line], Available: http://mba.tuck.dartmouth.edu/sp readsheet/product_pubs.html [October 2007] Spannagel, C., Gläser-Zikuda, M . and Schroeder, U. (2005), “Application of Qualitative Content Analys is in User-Program Interaction Research”, Foru m: Qualitative Social Research , Vol. 6(2), Art. 29, May
Original Paper
Loading high-quality paper...
Comments & Academic Discussion
Loading comments...
Leave a Comment