Unsupervised empirical Bayesian multiple testing with external covariates
In an empirical Bayesian setting, we provide a new multiple testing method, useful when an additional covariate is available, that influences the probability of each null hypothesis being true. We measure the posterior significance of each test condi…
Authors: ** Egil Ferkingstad, Arnoldo Frigessi, Håvard Rue
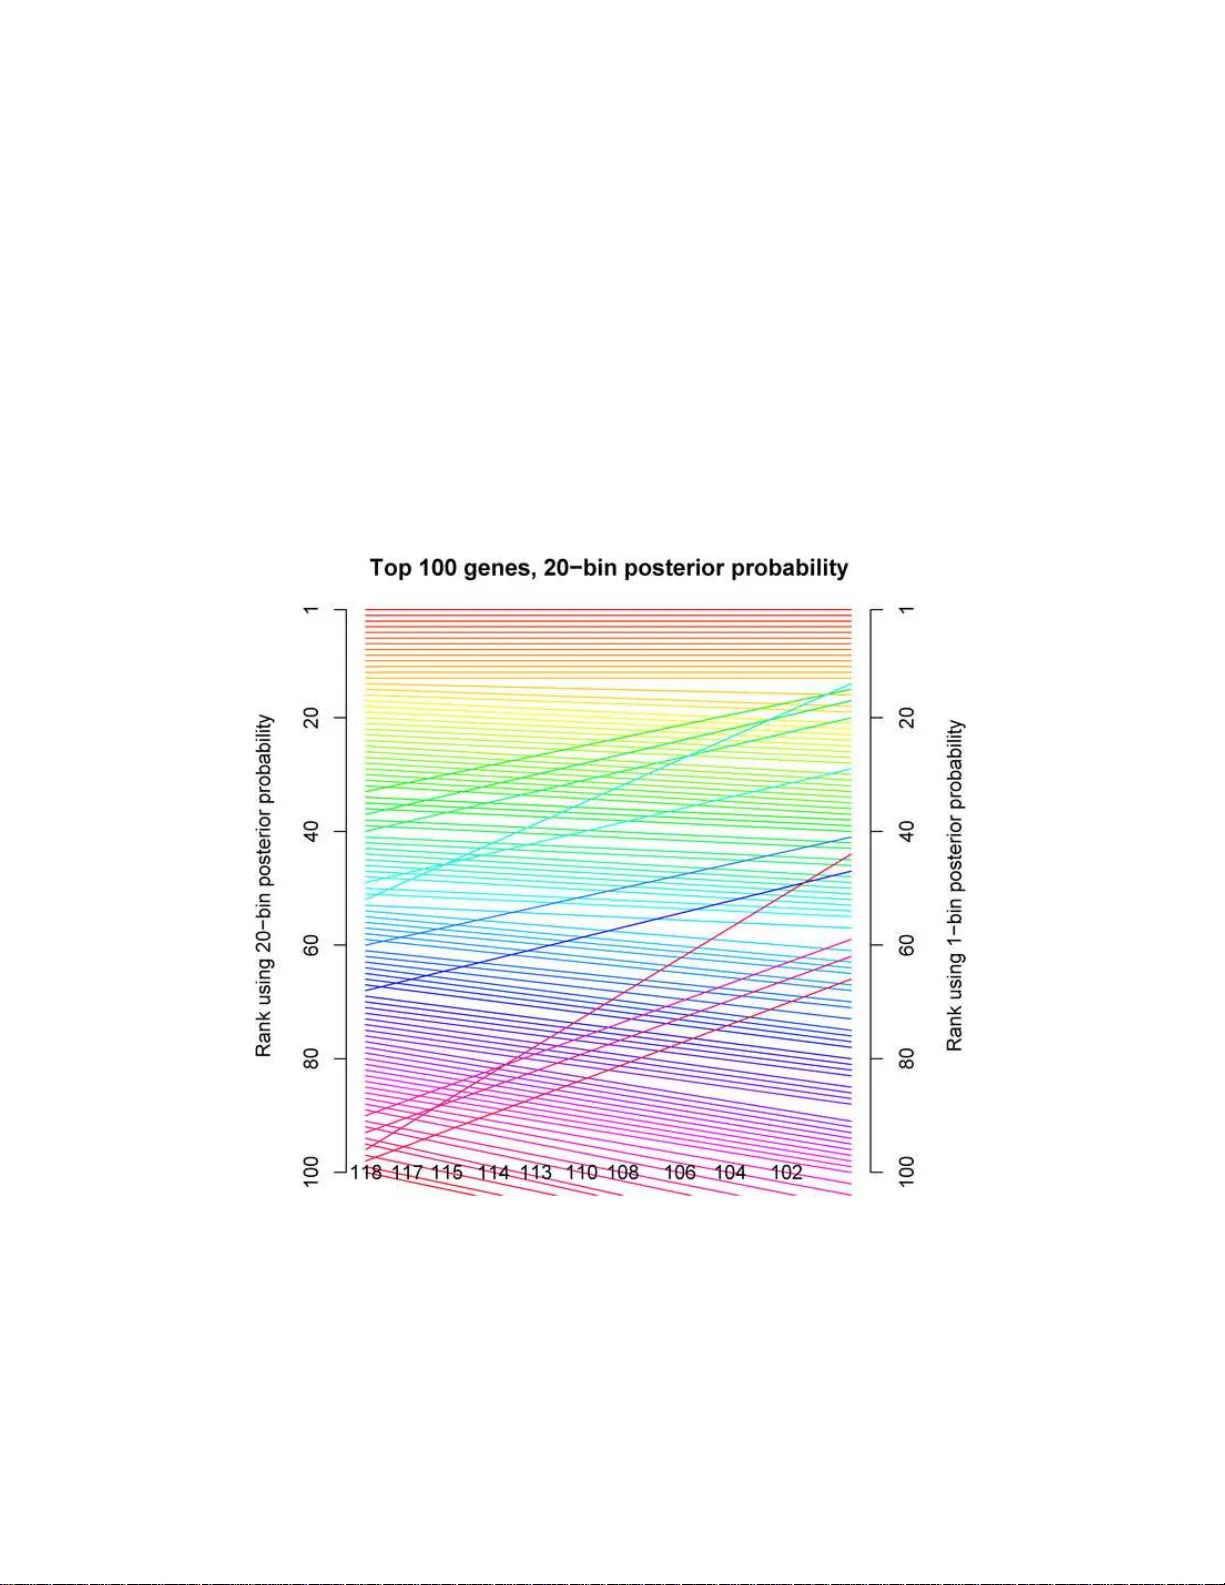
The Annals of Applie d Statistics 2008, V ol. 2, No. 2, 714–735 DOI: 10.1214 /08-A OAS158 c Institute of Mathematical Statistics , 2 008 UNSUPER VISED EMPIRICAL BA YE SIAN MUL TIPLE TESTING WITH EXTERNAL CO V ARIA TES By Egil Ferk ingst ad, 1 Arnoldo Frigessi, H ˚ av ar d R ue, Gudmar Thorleifs s on and A ugustine Kong University of Oslo and Centr e for Inte gr ative Genetics , ( sfi ) 2 —Statistics for Innovation , N orwe gian University of Sci enc e and T e ch nolo gy , De c o de Genetics and D e c o de Genetics In an empirical Bay esian setting, w e provide a new multiple test- ing metho d, useful when an additional co v ariate is av ailable, that influences the probability of eac h null h y p othesis being true. W e mea- sure the posterior significance of eac h test conditionally on the co- v ariate and the data, leading to greater p o w er. Using cov ariate-based prior information in an unsup erv ised fashion, we pro duce a list of significan t hyp oth eses which differs in length and order from the list obtained by method s not taking co v ariate-information into account. Co va riate-modu lated p osterior probabilities of eac h null h yp oth esis are estimated using a fast approximate algorithm. The new metho d is applied to ex pression quantitativ e trait loci (eQTL) data. 1. In tro d uction. Science, indu stry and b usiness p ossess the tec hnology to collect , store and distribute h u ge amoun ts of data efficien tly and often at lo w cost. Sensors and instru men tation, data logging capaci t y and com- m u nication p o wer hav e increased the br eadth and d epth of data. Systems are measured more in detail, giving a more complete but complex picture of pro cesses and phenomena. Also, it is necessary to int egrate many sources of data of differen t t y p e and qualit y . In high-through p ut genomics, large n u m b ers of sim ultaneous comparisons are necessary to d isco v er differen tially expressed genes among thirty thous and measured on es. S im ilarly , in finance, one wishes to monitor prices of thousands of pro ducts and deriv ativ es sim u l- taneously to detect abnormal b eh a vior, or in geoph ysics or brain imaging, questioning thous an d s of 3D v oxel s ab out their prop er ties. Such tests are Received March 2007; revised January 2008. 1 Supp orted by the National program for researc h in functional genomics in N orw ay from the Research Council of Norwa y . Key wor ds and phr ases. Bioinformatics, multiple hyp othesis testing, false disco very rates, data integration, empirical Bay es. This is an electro nic r eprint of the origina l article published by the Institute of Mathematica l Statistics in The Annals of A pplie d S tatistics , 2008, V ol. 2, No. 2, 71 4–735 . This reprint differs from the o riginal in paginatio n and t ypo graphic detail. 1 2 FERKINGST AD ET AL. often dep endent, and the dep endency s tructure is ill sp ecified, so that the ef- fectiv e num b er of indep en d en t tests is unknown. Sometimes, we exp ect that only a small subset of decisions will hav e a p ositiv e r esult: the solution is then sparse in the huge parameter space. T o d isco v er signifi can t cases, it is neces- sary to dev elop new metho ds that either exploit a v ailable a p riori kno wledge on th e structure of the solution, or merge d ifferen t data s ets, eac h addin g information. Benjamini and Ho ch b erg ( 1995 ) prop osed the false disco v ery rate (FDR), wh ic h can adapt automatically to spars ity and h as b een shown to b e asymptotically optimal in a certain minimax sense [Abramo vich et al. ( 2006 )]. FDR adju s tmen ts of p-v alues are n o wada ys routinely p erformed on large scale multiple stud ies in man y sciences and applied areas, from astronom y [Miller et al. ( 2001 )] to genomics [T u sher et al. ( 2001 ); from neu- roimaging [Geno v ese, Lazar and Nic hols ( 2002 )] to ind ustrial organization [Bro wn et al. ( 2005 )]. Ba yesian approac hes are based on the estimation of the p osterior p robabilit y of the null hyp othesis. Efron et al. ( 2001 ) ha v e de- v elop ed the theory of the lo c al false disc overy r ate , b ased on an estimation pro cedure originally deve lop ed by Anderson and Blair ( 1982 ). As the FDR pro v id es a pr obabilit y of misclassification f or sets of tests called signifi can t, the p osterior probability that the null hyp othesis is true pro vid es a similar measure, bu t for a lo cal set ab out the particular v alue of the test statistic. Instead of summarizing the data by a test statistic, hierarc hical Ba y esian ap- proac hes h a ve b een dev elop ed that mo d el p arametrically th e full measur ed data [ Baldi and Long ( 20 01 ), Do, M ¨ uller an d T a n g ( 2005 ), Kend ziorski et al. ( 2006 ), Lonnstedt and Sp eed ( 2002 ), Newton et al. ( 200 4 ), and Storey ( 2007 ) also mak es full use of the data in a h yp othesis testing setting. Both approac hes h a ve their strengths and we aknesses, in terms of v alidit y of the distributional assumptions un der the alternativ e h yp othesis, actual av ailabil- it y of the fu ll d ata, computational sp eed and s im p licit y of the metho dology . This pap er assu mes access to sum mary test statistics for ev ery hyp othesis to b e tested. W e p rop ose a sim p le metho dology wh ic h allo ws mo d ulating the p osterior probabilit y of eac h n u ll h yp othesis based on a p r iori additional external in- formation. Assu m e that for eac h null h yp othesis H 0 i a kno w n co v ariate x i is a v ailable whic h could influence the pr ior probabilit y that H 0 i is true. T yp- ically , the co v ariates x i represent a v ailable kno wledge d eriving from other data and measurement tec hnologies. Our metho d is unsu p ervised and semi- parametric, in the sens e that it is not n ecessary to m o del th e joint d istribu- tion of the test statistics with the co v ariate. By means of empirical Bay es, w e tak e adv an tage of p rior information on th e probabilit y of eac h null h yp othe- sis b eing true, based on such add itional d ata av ailable for eac h single test, to pro du ce a more precise list of rejected n ull hyp otheses. This leads to a mea- sure of the p osterior significance of eac h test i , conditional on the co v ariate x i and the data, often leading to greater p o w er. F urthermore, th e ranking UNSUPER V ISED MUL TIPLE TESTING WITH EXTERN AL COV ARIA TES 3 of the hyp otheses based on th e co v ariate mo dulated p osterior probability is differen t from the order pro vid ed in absence of the external co v ariate. W e estimate the co v ariate mo dulated p osterior prob ab ility of eac h h y- p othesis by bin ning the data according to the external co v ariate, w ith the help of an appro ximate mixtur e mo d el on p-v alues (Section 2 ). In ference is then based on approxima te Ba yesian inferen ce [ Rue and Martino ( 2007 )], in order to redu ce computational time (Section 3 ). In Section 4 w e present the analysis of exp r ession quan titativ e trait loci (eQTL) data, where gene ex- pression measuremen ts obtained b y m icroarra ys are com b ined with genetic link age analysis. Ou r example explicitly considers an imp ortan t case where (1) th e test is not a comparison, (2) the co v ariate cannot b e used f or testing alone, and (3) there is no w ay (that we kno w of ) to pro d uce a full mo del. W e then compare our approac h w ith the recen tly prop osed Optimal Disco ve ry Pro cedure (ODP) [ Storey ( 2007 )], and sho w that our metho d is op timal in the sen s e of Storey , wh en data are av ailable only at test statistic lev el, within eac h co v ariate-determined bin (Sectio n 5 ). S ection 6 includes a sim ulation study , whic h illustrates the effect of external inform ation on the p o we r of the test. Section 7 present s some discussion and extensions. Our metho d pro v id es a simp le unsup ervised wa y of in corp orating differen t information in to th e Ba ye sian hyp othesis testing framew ork, w h en fu ll mo deling of the complete data is not p ractical or reliable. 2. Co v ariate-mo dulated multi ple testing. W e consider the s im ultaneous testing of m h yp otheses: H 0 i vs. H 1 i , i = 1 , . . . , m. F or eac h i , a test statistic Z i = z i is calculated. If H 0 i is tru e, then Z i has a kno wn distribution F 0 [e.g., F 0 could b e N (0 , 1) or a t-distribution]. Here, large Z i are evidence against the null hypothesis. Also, for eac h i , we ha ve a co v ariate x i whic h m a y in fl uence th e prior probability that the null hypoth- esis is true. W e consider the x i , i = 1 , . . . , m , to b e kno wn co v ariates. W e can reasonably assu m e that x i do es not influence the p robabilit y distributions of Z i under H 0 i , so Z i ∼ F 0 under H 0 i no m atter what the v alue of x i is. Ho we v er, for eac h i , the distribution of Z i under H 1 i dep end s on x i . Assume that, f or eac h i , H 1 i = H c 0 i in some space of in terest. Let g ( z i | x i ) b e the d ensit y of Z i giv en x i . F rom the assumptions ab ov e, the follo w ing basic mo d el is deriv ed: g ( z i | x i ) = π 0 ( x i ) g ( z i | H 0 i ) + (1 − π 0 ( x i )) g ( z i | H 1 i , x i ) , (1) where π 0 ( x i ) = P ( H 0 i | x i ). Here, π 0 ( x i ) and g ( z i | H 1 i , x i ), the densit y of Z i giv en x i under H 1 i , are u nkno wn, while the distribution function corresp ond- ing to g ( z i | H 0 i ) is kno w n to b e F 0 . 4 FERKINGST A D ET AL. F or eac h test statistic Z i , th e corresp onding p-v alue P i is giv en by P i = 1 − F 0 ( Z i ). Hence, based on the observe d z i , i = 1 , . . . , m , w e can calculate observ ed p-v alues as p i = 1 − F 0 ( z i ) , i = 1 , . . . , m. W e can wr ite the basic mo del ( 1 ) in terms of p-v alues instead of z-sco res. Let f ( p i | x i ) b e the densit y of p -v alue p i giv en co v ariate x i . Clearly , the distribution of the p-v alue P i under H 0 i is uniform on [0 , 1] and do es not dep end on x i . Accordingly , th e mo del in terms of p-v alues is f ( p i | x i ) = π 0 ( x i ) + (1 − π 0 ( x i )) f ( p i | H 1 i , x i ) . (2) W e d efine the co v ariate-mo dulated p osterior probability of H 0 i as P ( H 0 i | p i , x i ). W e hav e data ( p i , x i ) and need to estimate π 0 ( x i ) and f ( p i | H 1 i , x i ). Di- aconis and Ylvisak er [( 1985 ), Th eorem 1] sho w ed that an y d istr ibution on [0 , 1] can b e we ll appro ximated b y a mixture of b eta d istributions. Allison et al. ( 2002 ) in v estigated this approac h furth er and applied it to estimat- ing the densit y f und er lyin g a sample of p-v alues. In their exp erience with sev eral sets of data, the simplest p ossible mo del, whic h is a mixture of a standard un iform, U [0 , 1], corr esp onding to the tru e null h yp otheses and one b eta comp onen t corresp onding to the alternativ e hypotheses, seemed to b e sufficient ; fur thermore, Park er and Rothenber g [( 198 8 ), Section 3] noted that addin g more b eta comp onen ts will in cr ease the num b er of observed r e- jections. T h erefore, usin g only one single b eta comp onen t corr esp onding to the f alse null h y p otheses can b e seen as a c onservative c hoice, as w e a v oid o ve restimating the prop ortion of false null hyp otheses. W e h a ve c h osen to use a m ixture of a uniform d ensit y and a b eta dens ity as our mo del. T o accoun t for the dep endence on x i in f ( p i | x i ), w e bin the p -v alues int o B sets B 1 , B 2 , . . . , B B increasing in x . W e assume th at bins are small enough so that π 0 ( x ) is n early constant in x for eac h b in B j , that is, π 0 ( x ) = π 0 j for all x ∈ B j , and similarly for the parameters of the b eta d istribution. Thus, w e drop the d ep endence on x within eac h bin. W e assu m e that within eac h bin B j , the u niform-b eta mixtur e mo del holds, so f j ( p i ) = π 0 j + (1 − π 0 j ) Γ( ξ j + θ j ) Γ( ξ j )Γ( θ j ) p ξ j − 1 i (1 − p i ) θ j − 1 (3) for p i ∈ B j , where Γ denotes the gamma function, and ξ j > 0 and θ j > 0 are the p arameters of the b eta density in bin B j . The co v ariate-mod ulated p osterior probabilit y of H 0 i corresp ondin g to a p-v alue p i in bin B j is then P ( H 0 i | p i , x i ) = P ( H 0 i | x i ) f ( p i | x i ) = π 0 j f j ( p i ) . UNSUPER V ISED MUL TIPLE TESTING WITH EXTERN AL COV ARIA TES 5 Since small (la rge) p-v alues should corresp ond to false (tru e) null hy- p otheses, p-v alue den s ities should b e nonincreasing. Hence, we assume th at, in eac h bin j , f j ( p ) is a n on in creasing f unction of p for p ∈ [0 , 1]. [See also W u, Guan and Zhao ( 2006 ), who show that f j ( p ) is alwa ys decreasing for p-v alues from a lik eliho o d ratio test.] In addition, w e mak e the assumption that f j ( p ) is con vex. Th is is done to av oid und erestimation of f j ( p ) near p = 1, whic h w ould lead to und er estimation of π 0 j [since π 0 j = f j (1)]. Without the con- v exit y assump tion, the assum ption of n on-increasingness for a densit y with b ound ed sup p ort may lead to und er estimation du e to a “drop-down effect” near the right en d p oint. S ee Lan gaas, Lindqvist and F erkingstad ( 2005 ) for further d iscussion of the con vexi t y assu mption. It can b e sh o wn that f j ( p ) is n on in creasing an d con vex if and only if ξ j ≤ 1 and θ j ≥ 2. A t this p oin t, we h a ve a separate mod el for eac h bin . The next step is to smo oth o ver the different bins and b orro w strength b et ween neighb orin g bins, leading to imp ro ved estimates. T his can b e done u sing a Ba yesia n approac h, as f ollo ws. Defining a smo othness pr ior on the sequ ence of π 01 , . . . , π 0 B is complicated b y the fact that eac h π 0 j is limited to the interv al [0 , 1] . W e add ress this issu e using reparametrization e π 0 j = log π 0 j 1 − π 0 j , so that e π 0 j is defined on the whole real line. Th e sm o othness pr ior is no w tak en to b e f ( e π 01 , . . . , e π 0 B ) ∝ exp − λ 1 2 B X j =2 ( e π 0 j − e π 0( j − 1) ) 2 ! (4) to encourage the parameter v alues in neigh b oring bins to b e similar. Here, λ 1 is the smo othing parameter. Note that ( 4 ) is imp r op er as it is inv arian t to adding any constan t to its arguments. The remaining t wo p arameter sequences, ξ 1 , . . . , ξ B , and θ 1 , . . . , θ B ha ve similar restrictions, as ξ j ∈ [0 , 1] and θ j > 2 , for eac h j . T he sm o othness pri- ors for { ξ j } an d { θ j } are defined similarly as for { π 0 j } , u sing the reparametriza- tion e ξ j = log ξ j 1 − ξ j and e θ j = log( θ j − 2) . Denote the smo othing parameters as λ 2 and λ 3 , resp ectiv ely . No w, denoting the p -v alues in bin j b y p j 1 , p j 2 , . . . , p j m j , the sim u ltaneous p osterior of in terest is th en f ( { e π 0 j } , { e ξ j } , { e λ j } | λ 1 , λ 2 , λ 3 , data) ∝ f ( { e π 0 j } ) f ( { e ξ j } ) f ( { e θ j } ) 6 FERKINGST A D ET AL. (5) × m j Y h =1 π 0 j ( e π 0 j ) + (1 − π 0 j ( e π 0 j )) × Γ( ξ j ( e ξ j ) + θ j ( e θ j )) Γ( ξ j ( e ξ j ))Γ( θ j ( e θ j )) p ξ j ( e ξ j ) − 1 j h (1 − p j h ) θ j ( e θ j ) − 1 . W e p erform inferen ce on the transformed p arameters as this is an uncon- strained parametrization, bu t can easily transform bac k to the original pa- rameters. F or nearest-neigh b orho o d improp er priors, smo othing is regulated b y the smo othing parameters ( λ 1 , λ 2 , λ 3 ). These n eed to b e estimated or tuned in calibration exp eriments. Among the v arious app roac hes for estimating smo othing p arameters, we mentio n cross-v alidation [Thompson et al. ( 1991 )], estimates based on appro ximate mo d els, and fu lly Ba y esian inference [ Kunsch ( 1994 ), Heikkinen and P en ttinen ( 1999 )]. W e fi nd preliminary estimates of the parameters e π 0 j , e ξ j , e θ j ; j = 1 , . . . , B , withou t smo othing; then we fit a Gaussian mo del to eac h parameter and estimate ( λ 1 , λ 2 , λ 3 ) based on the estimated inv erse v ariances. Thus, ˆ λ 1 = B . B X j =2 ( ˆ e π 0 j − ˆ e π 0( j − 1) ) 2 , and ˆ λ 2 and ˆ λ 3 are defined similarly . In addition, w e consider scaling eac h smo othing parameter by a tuning parameter c > 0, leading to c ˆ λ 1 , c ˆ λ 2 , c ˆ λ 3 . The eQTL d ata analysis in S ection 4 is p erformed for b oth c = 1 and c = 5 for comparison. It is easy to estimate the b eta -mixture mo del from equation ( 3 ) with only one bin , B = [0 , 1], thus d iscarding the inform ation in the co v ariate. W e will refer to this as the “one-bin mo del.” The estimated p osterior probabilities from the one-bin mo del are usefu l for assessing th e u s efulness of the infor- mation con tained in the co v ariate, by comparing the num b er of rejectio ns giv en by the one-bin and B -bin m o dels. Finally , note th at the ordering of tests by significance will often b e dif- feren t for the co v ariate-mo dulated p osterior pr obabilit y metho d than for metho ds n ot taking th e co v ariate in to accoun t, suc h as Ef ron’s lo cal FDR and the one-bin m o del. If, f or example (as in the data set considered in Section 4 ), the co v ariate-mo dulation function π 0 ( x ) is d ecreasing in x , then tests corresp onding to a low v alue of x ma y mo ve d o wn in the s ignifi cance list, and tests corresp onding to a high x may mo ve up in the list. Th is re- ordering of significance will b e illustrated for the eQTL d ata set analyzed in Section 4 . UNSUPER V ISED MUL TIPLE TESTING WITH EXTERN AL COV ARIA TES 7 W e estimate the π 0 j , ξ j , θ j and the co v ariate-mo dulated p osterior prob- abilit y of the H 0 i sim u ltaneously using the app ro ximate Ba yesian metho d describ ed in Section 3 . 3. Computational strategy . This sect ion discusses ho w to devel op an efficien t strategy for doing inf erence from the full p osterior of in terest ( 5 ). Although inference is p ossib le usin g Mark ov c hain Mon te Carlo metho ds, w e need a computationally faster approac h for our pr oblem. T he amount of data in eac h bin, com bined with the Gaussian s m o othing, ju stify to app ro ximate the joint p osterior of { e π 0 j } , { e ξ j } , { e θ j } as Gauss ian. Th e p osterior mean is the mo dal configuration, and the p osterior co v ariance matrix is the inv ers e of the negativ e Hessian at the mo de. Note that the Gaussian app ro ximation is lik ely to b e less accurate without reparametrization, due to the constraints of the p arameters. T o compu te the p osterior mean an d the co v ariance matrix, we need to optimize the log p osterior, that is, the log of ( 5 ). W e d o this in t wo steps; in the fir st step w e compu te reasonable initial v alues for th e parameters in eac h of the B b ins, while in the second step w e start from these initial v alues and optimize the log p osterior with resp ect to all the parameters to lo cate the mo d e: 1. The in itial v alues for th e parameters of int erest are d etermined sequen - tially . W e start with the fir st bin. W e use only th e data in the first b in to optimize the log lik eliho o d with resp ect to e π 01 , e ξ 1 , e θ 1 . Then we go on to the second b in usin g the initial v alues found from th e first bin to initialize the optimization in b in 2. This pro cess contin ues until all th e B bins are pro cessed. 2. The log p osterior is then optimized with resp ect to all the parameters starting from the initial v alues found in the pr evious step. Man y numerical op timization s c hemes can b e u s ed in eac h of the tw o steps, and w e use the classical Newton–Raphson algorithm. The main motiv ation is that b oth the gradient and th e Hessian of the log p osterior (b oth in the fu ll mo del and for eac h b in separately) are r elativ ely easy to compute. F urther, the Hessian matrix of the log p osterior will b e spars e in the full mo del since the parameters in eac h bin are only linked to the previous and follo wing bin. As a side effect, we can inv ert the negativ e Hessian used at the last iteration to obtain the co v ariance matrix. As all th e parameters are (appro ximately) join tly Gaussian, then so are the p osterior marginals for eac h e π 0 j , e ξ 0 j and e θ 0 j , and they can b e found analyticall y . The p osterior densit y of P ( H 0 i | p i , x i ) for bin j can b e computed from the join t p osterior for e π 0 j , e ξ j , e θ j . Such an approac h is feasible bu t cumb er- some using numerical int egration. F or this reason, we attac k this p roblem 8 FERKINGST A D ET AL. using the delta-metho d: Expand P ( H 0 i | p i , x i ) around the p osterior mean of ( e π 0 j , e ξ j , e θ j ), ( e π ∗ 0 j , e ξ ∗ j , e θ ∗ j ), sa y , to obtain P ( H 0 i | p i , x i ) = a + b T (( e π 0 j , e ξ j , e θ j ) − ( e π ∗ 0 j , e ξ ∗ j , e θ ∗ j )) + · · · . W e now app r o ximate the p osterior of P ( H 0 i | p i , x i ) at bin j , by a Gaussian with mean a and v ariance b T Σ j b , wh ere Σ j is the p osterio r co v ariance of ( e π 0 j , e ξ j , e θ j ). W e ha ve ve rified our Gaussian app ro ximations using long runs of an MCMC algorithm without b eing able to detect any relev ant differences. 4. eQTL data. Th rough the collection of phenot ypic and genetic d ata for individuals in family clusters, link age analysis is a standard m etho d to map genetic v ariant s that can in fluence a trait to sp ecific regions of the genome [ Ott ( 1999 )]. Recen tly , there was the recognition that the magni- tude of gene expr ession, m easur ed u sing mo d ern microarray tec hnology for man y genes sim u ltaneously , v aries among ind ividuals and often has a ge- netic comp onen t [ Jansen and Nap ( 2001 ), Sc hadt et al. ( 2003 ), Bry s trykh et al. ( 2005 )]. It hence can b e treated as a quan titativ e genetic trait. The lo ci affecting gene expression are referred to as expression quant itativ e trait lo ci (eQTLs). While the same link age m etho dolog y applies, there are sp e- cific c haracteristics that distinguish the study of eQTLs fr om th e stud y of other more tr ad itional traits. First, often the expressions of tens of thou - sands of genes are studied simultaneously . Second, a v ariant that affects the expression of a certain gene that is lo cated in the imm ediate neighborh o o d of where the gene resides is called a cis-v arian t, whereas a v ariant that can affect the expr ession of the gene, directly or indirectly , b ut is lo cated f ar a wa y (e.g., on a different chromosome), is a trans-v arian t. In general, giv en the phenotypic and genetic data, for eac h trait, a link age score can b e calc u- lated f or ev ery p osition on th e genome (referred to as a genome-scan). Here w e fo cus on the test of whether a cis-v ariant exists so that only the link age score ev aluated at the known lo cation of the gene is used . Th e data in volv e the expr essions of 22317 exp r essed sequence tags (ESTs) for 370 Icelandic individuals clustered into 85 families. Th e data stru cture is s imilar to that of Morley et al. ( 2004 ) and Monks et al. ( 2004 ), the d ifference b eing that we ha ve a larger sample s ize and th e gene expressions are m easured in blo o d instead of lym p hoblastoid cell lines. Denote the gene expression (p henot yp e) data by E an d the genot yp e data b y G . Using link age analysis, the join t data ( E , G ) is used to test the null h y p othesis H 0 : No cis-v ariant is affecting E , UNSUPER V ISED MUL TIPLE TESTING WITH EXTERN AL COV ARIA TES 9 through the cond itional distribution P ( G | E ), for eac h ES T (index drop p ed here for simplicit y). In a link age analysis, as opp osed to an asso ciation anal- ysis, we do not u se the correlation b et w een th e genot yp e data G and E directly . Rather, the genot yp e data are used to trac k the segmen ts of c hr o- mosomes that are sh ared b y relativ es identica l by d escen t. Evidence of link- age of a phenot yp e to a genomic region sho w s u p when relativ es h aving similar p henot yp es s hare a r egion b y descent in excess of what is exp ected based on their kno wn relationships, and relativ es with phenot yp es that are substanti ally different ha ve a deficit of sharing. T he test w e u sed is partic- ularly simple. Un der H 0 , G is indep enden t of E , or P 0 ( G | E ) = P ( G ), and the distribu tion of any test statistic has a k n o wn d istribution under H 0 with no nuisance parameters. S p ecifically , what we used h er e is an allele-sharing score, an extension of that describ ed in Kong and C ox ( 1997 ) and closely re- lated to the metho d of S h am et al. ( 2002 ). Through exp onenti al tilting which leads to a one-parameter alternativ e distribu tion for the allele-sharing s core, a simple lik eliho o d ratio test is u sed for eac h E ST. The link age score is cal- culated u sing th e p rogram Allegro [Gudb jartsson et al. ( 2000 )]. Sim u lation sho w s th at the p -v alues calculated using the c hi-squ are distr ib ution as the reference are v ery wel l calibrated, as exp ected. While lin k age analysis inv olv es the stud y of the co-segregatio n of ph eno- t yp es and genetic material, the phenot yp e data alone can b e used to estimate heritabilit y , that is, the strength of the correlation of ph enot yp es among rel- ativ es can b e used to estimate the fraction of the phenot yp e v ariance that is p oten tially accoun ted for by genetic v ariants. Denote the estimated h er- itabilit y b y H ( E ), wh ic h we compute from E using the program SOLAR [ Almasy and Blangero ( 1998 )] for eac h of th e 22317 EST s. It might ap p ear that w e ha ve artificially partitioned the ov erall informa- tion captured by the join t distrib ution P ( G, E ) int o t wo p arts, one b ased on the conditional distr ib ution P ( G | E ) , and one based on P ( E ) . Ho w ever, in this case, as in m an y other r eal data problems, there is su bstan tial asym- metry b etw een the information captured by P ( G | E ) and P ( E ). As noted ab o ve, the test we used to d irectly test H 0 and compute p-v alues is simple and straigh tforward. It is v ery d ifferen t f or H ( E ). S p ecifically , H ( E ) can b e significan tly and su bstan tially different fr om zero for at least four differen t reasons: (A) There exists cis-v ariant s that affect E . (B) There exist trans-v arian ts (v arian ts that are lo cated in regions of the genome that are aw a y from the gene for which the expression is mea- sured) that, d ir ectly or in directly , affect E . (C) H ( E ) is capturin g familial clustering/similarities that result from shared en viron m en t among relativ es in stead of genetic factors. 10 FERKINGST A D ET AL. (D) Sub jects and families are often not collected completel y at rand om. Nonrandom ascertainmen t with resp ect to traits such as ob esity , which are associated with some of the expression ph enot yp es, could lead to bias in the estimate of h eritabilit y . Reason (A) ab o v e is the alternativ e for H 0 as sp ecified ab ov e, but E or H ( E ) cannot b e used to d irectly test H 0 against th e tru th of (A). T h erefore, we are not able to use H ( E ) directly to compute p-v alues. Ho wev er, there are ob vious reasons to b eliev e that the pr obabilit y for (A) b eing true is correlated with H ( E ). Making as little assump tions as p ossible, our approac h is to use H ( E ) thr ough a semi-parametric empirical-Ba y es pro cedur e to provide a prior distr ib ution for H 0 and (A). Co v ariate-mo dulated p osterior pr obabilities w ere calculate d as d escrib ed in Sections 2 and 3 . Twen t y bins w ere used , with bin 1 con taining the p- v alues with corresp onding heritabilit y estimated exactly equ al to zero, and the other b in s chosen to con tain an appro ximately equal n u m b er of p-v alues. Smo othing scaling f actors c = 1 and c = 5 were used. R esu lting estimates in four of the bins, for c = 5 , with 0.95 p oint wise s ymmetric cred ib ilit y inter- v als, are sho wn in Figure 1 . Here w e see that, for any giv en v alue of p , the co v ariate-modu lated p osterior pr obabilit y of H 0 decreases for increasing bin index (increasing heritabilit y). Th is effect seems to b e qu ite strong. The one-bin mo del was used to assess the effects of co v ariate-mo dulation. Figure 2 sho ws a comparison b etw een the results of the co v ariate-mod ulated p osterior probab ility metho d and the one-bin, n o-co v ariate metho d. This plot sh ows a 2-dimensional h istogram of the (co v ariate, test statistic) p air for eac h of th e 22317 ES Ts. A higher density of tests (ESTs ) is indicated by a darker gra y tone in the histogram. Ass u me that a test is called significan t if the p osterior prob ab ility of the null hypothesis is smaller than 0.05. T he step-lik e s olid curv e is the signifi cance threshold at lev el 0.05 for the 20- bin co v ariate-mo dulated p osterior probabilit y based metho d. The d ashed line sho ws the significance th reshold, also at lev el 0.05, for the one-bin , nonco v ariate based, p osterior p robabilit y . A total of 818 tests w er e called significan t by b oth metho d s, while 704 tests were called significan t b y th e 20-bin metho d only . 53 tests (corresp ond in g to EST ’s w ith low heritabilit y) w ere calle d significan t by th e one-bin metho d, but d iscarded as suc h by the co v ariate-mo dulated 20-bin method . T hese results are for smo othing scale c = 5 . Results for smo othing s cale c = 1 are similar, with 817 tests called significan t for b oth method s, 738 tests called significan t for the 20- bin metho d only , and 54 tests called significant for the one-bin metho d only . The imp act of using her itabilit y information is huge. Lo oking at Fig- ure 2 , it is eviden t that there is a large d ifference when u sing th e co v ariate- mo dulated metho d compared to the no-co v ariate m etho d. In Figure 2 the 53 tests in the r egion b elo w the 20-bin threshold and ab o v e the one-bin UNSUPER V ISED MUL TIPLE TESTING WITH EXTERN AL COV ARIA TES 11 Fig. 1. Estimate d c ovariate-mo dulate d p osterior pr ob abilities of H 0 in bins 1 , 7 , 13 and 20 . The solid line shows the estimate, whil e the dashe d l ines ar e appr oximate p ointwise 95% symmetric cr e dibility intervals. threshold are considered b y the co v ariate-based m etho d as false discov er- ies, obtained err oneously b y a no-co v ariate metho d . T h ese p oin ts are in a region of low er heritabilit y , wh ile th e 704 p oin ts b elo w the one-bin signifi- cance line and ab o v e the 20-bin significance curve (whic h are “gained” b y in tro ducing co v ariate-mo dulation) are in the r egion w ith higher heritabilit y . As exp ecte d, th e tests with lo w h er itabilit y are effectiv ely d own-w eigh ted b y the 20-bin metho d , wh ile tests with high heritabilit y are up-weigh ted, in a nonsup ervised f ash ion b y the Ba yesia n rule. Thus, there are t wo p oten- tial gains of using our metho d: Higher o ve rall p o w er , and b etter fo cus on individual fi ndings supp orted by add itional information. It may also b e of inte rest to study the estimated co v ariate-mo dulated functions (i.e., the estimated π 01 , π 02 , . . . , π 0 B ) directly . A plot of π 0 j vs. co- v ariate x for is shown in Figure 3 . Clearly , the dep enden ce on the co v ariate, heritabilit y , is very stron g. The co v ariate-modu lation function also illustrates the effect of smo othing. The ab o v e plot sho ws the case c = 1, while the b elo w plot shows the case c = 5. In this case, smo othing c = 5 s eems most appro- priate, based on the degree of smo othness and the a pr iori exp ectation th at the co v ariate-mo dulation fu nction should b e decreasing in x . 12 FERKINGST A D ET AL. Fig. 2. Two-dimensional histo gr am of p ai rs of c ovariate (heritability) and test statistic (z-sc or e) for e ach of the 22317 tests (EST ’ s). A darker gr ay tone i ndic ates a higher density of p oi nts (tests ) in e ach pixel. T he solid step-like curve shows the signific anc e thr eshold using the c ovariate-mo dulate d, 20-bin p osterior pr ob abil ity of H 0 . The dashe d line shows the signific anc e thr eshold for the no-c ovariate, one-bin p osterior pr ob ability. Both thr esholds ar e at p osterior pr ob abili ty level 0.05. 53 tests fal l in the signific anc e r e gion of the one-bin metho d, but outside the signific anc e r e gion of the 20-bin metho d, 704 tests fal l i n the signific anc e r e gion of the 20-bin metho d, but outside the signific anc e r e gion of the one-bin metho d, while 818 tests ar e within the signific anc e r e gi on of b oth metho ds. Using heritability has a very lar ge i mp act. The one-bin mo d el giv es the p osterior estimate ˆ π 0 = 0 . 701, with approx- imate symmetric 95% credibilit y inte r v al (0 . 687 , 0 . 714), for the o v erall pro- p ortion of tr ue null hyp otheses π 0 . By comparison, the estimates ˆ π s 0 of Storey ( 2002 ) and ˆ π c 0 of Langaas et al. ( 2005 ) are ˆ π s 0 = 0 . 601 and ˆ π c 0 = 0 . 615, resp ec- tiv ely , so it is p ossible that the one-bin u niform-b eta mixture mo del giv es a conserv ative estimate in this case. As m entioned in Section 2 , the ranking of genes according to the p osterior probabilit y of the alternativ e h yp othesis may b e differen t for the co v ariate- mo dulated p osterior p robabilit y and for the one-bin, no-co v ariate p osterior UNSUPER V ISED MUL TIPLE TESTING WITH EXTERN AL COV ARIA TES 13 Fig. 3. Covariate- mo dulation functions for the eQTL data: Estimate d π 0 j versus c ovari- ate (heritability) x . The steps c orr esp ond to bins. Two de gr e es of smo othing ar e shown (sc ali ng factors c = 1 and c = 5 , r esp.). Pointwise 95% symmetric cr e dibi lity intervals ar e shown as dashe d lines. probabilit y . T his is illustrated in Figure 4 , w hic h sho ws the change in rank- ings for the top 100 genes for the 20-bin, co v ariate b ased metho d . Reshuf- fling is quite evident. Rank information is imp ortan t for fur ther analysis 14 FERKINGST A D ET AL. and exp erimen ts on the most promising ES T ’s, with p oten tial impact on drug-disco very plans. 5. Connections to other metho d s and optimalit y . Sev eral multiple test- ing metho ds use, for eac h test, the full lik eliho o d of the d ata rather than a one-dimensional p-v alue/statistic su mmary . Use of the full lik eliho o d im- plies that tests are r eordered with resp ect to plain p -v alue ranking, thanks to in formation not conv ey ed by th e corresp onding un iv ariate p -v alues. T h is happ ens also in our approac h, b ut th e additional information comes from Fig. 4. Comp arison of r anks b ase d on no-c ovariate (1-bin) p osterior pr ob abili ty versus c ovariate-mo dulate d (20-bin) p osterior pr ob abil ity for the eQTL data. The EST ’ s with low- est c ovariate-mo dulate d p osterior pr ob ability of H 0 ar e r anke d along the left y-axis. Each se gm ent ends on the right y-axis of the plot on the r ank given to that EST by the one-bin metho d. Se gments moving down indic ate EST ’ s which ar e mor e str ongly cis-r e gulate d ac- c or ding to the c ovariate-mo dulate d p osterior pr ob ability, whi l e se gments m oving up i ndic ate the opp osite. R eshuffling of r anks is due to the m er gi ng of expr ession data with heritability know le dge. Some lines esc ap e the plot; for these the final r ank is written on the se gment. UNSUPER V ISED MUL TIPLE TESTING WITH EXTERN AL COV ARIA TES 15 external co v ariates, wh ile in the full-lik eliho o d (FL) metho ds there is a b or- ro win g of strength b etw een tests (in ternally). In some cases our “external co v ariate” may b e incorp orated into the like- liho o d mo del (and thus b ecome “in tern al” in our terminology), and the FL metho ds describ ed b elo w may b e used directly . How ev er, in many cases this will b e imp ossible, impr actical or unnatural. Our eQT L application b elo w is an example wh er e it wo u ld b e inapp ropriate to use the cov ariate in this w ay , as wa s explained in Section 4 . Our method has the adv ant age that since ev erything is done conditionally on the cov ariate, no mo del for the co v ariate is needed. In this sense, our approac h uses a min im al set of assumptions to pro vide a generally applicable w ay of us in g co v ariate information. FL m etho ds are cur r en tly implement ed for k -class comparisons (like the d ifferen tial expr ession problem), while our metho dology may readily b e applied for any m ultiple testing p roblem wh ere external cov ariate information is av ailable. Recen tly , Storey ( 2007 ) and Storey , Dai and Leek ( 2007 ) in tro duced a fre- quen tist FL metho d called the Optimal Disco v ery Pro cedure (ODP). The ODP is a theoretically optimal p ro cedure b ased on a generalized lik eliho o d ratio thresholdin g function. Th e optimalit y goal is that of maximizing the exp ected n u m b er of true p ositiv es for eac h fi xed exp ected n u mb er of f alse p ositiv es, where the former exp ectation is calculat ed u nder the s ubset where the alternativ e is true and the latter exp ectation is calculated und er th e su b - set wher e the null is true. In the O DP metho d, t wo main steps are distinguished: 1. ordering tests b y significance, and 2. c ho osing a cutoff to obtain a sp ecified err or rate. The pr o cedure is d efined as follo ws. Supp ose that we ha v e m s ignifi cance tests p erformed on observ ed data sets y 1 , y 2 , . . . , y m , where y i is the v ector of data for test i . T est i has densit y f i under H 0 and density g i under H 1 . As- sume that H 0 i is true for i = 1 , . . . , m 0 and H 1 i is true for i = m 0 + 1 , . . . , m . The ODP for test i is then giv en by the follo win g significance thresholding function: S ODP ( y i ) = f 1 ( y i ) + · · · + f m 0 ( y i ) + g m 0 +1 ( y i ) + · · · + g m ( y i ) f 1 ( y i ) + f 2 ( y i ) + · · · + f m 0 ( y i ) , (6) rejecting null hyp othesis H 0 i if and only if S ODP ( y i ) ≥ λ . Notice that step 1 ab o ve is here accomplished b y the sp ecificatio n of th e thresholding fu n c- tion ( 6 ), while step 2 is done by c ho osing λ . In our app roac h the cut- off is immediate to find, sin ce w e rank according to p osterior probabili- ties. Since the expression ( 6 ) for S ODP ( y i ) in v olv es seve ral unknown quant i- ties, the actual pro cedure is based on an estimated thresholding function 16 FERKINGST A D ET AL. ˆ S ODP ( y i ). Storey , Dai and Leek ( 2007 ) prop ose to assume norm ality for the y i , and plug the m axim um lik eliho o d estimat e in to th e Gaussian den- sit y functions to estimate g i . [Note th at ˆ g m 0 + j ( y i ) is estimated using data y m 0 + j .] In addition, in the p resence of n uisance parameters, it is necessary to pro v id e a p reliminary estimate of the summation of the tru e null densities. This ma y b e done by ranking the tests b y ord inary univ ariate significance criteria (e.g., p-v alues), estimating the prop ortion π 0 of tr u e null hypothe- ses, and then deciding that the m (1 − ˆ π 0 ) tests with sm allest p-v alues hav e a true H 1 , wh ile the rest ha ve a true H 0 . Op timalit y is lost at this p oin t, but satisfactory r esults are rep orted in pr actice . Ch oice of λ is d one using a b ootstrappin g pro cedur e, describ ed in the Onlin e Supp lemen t of Storey , Dai and Leek ( 2007 ). The ODP p ro cedure is closely r elated to our metho d . T o see this, first disregard the presence of the external co v ariate, and assu m e that eac h null h y p othesis H 0 i has the same p r obabilit y π 0 of b eing tru e. In this case, it is sho wn in Storey ( 2007 ) (p age 364) that the ODP thresholding function is equiv alent to the th r esholding f unction given by the p osterior probabil- it y that the alte rnativ e hypothesis is tru e giv en th e data y i . This implies that the ranking usin g this p osterior pr obabilit y is optimal in the ODP sense. No w, consider the use of external co v ariates. Our method is based on the p osterior probability of H 1 i giv en a one-dimensional (p-v alue/test statistic) summary of the data and the co v ariate x i . Thus, our metho d may b e seen as a version of the ODP metho d in the setting where we only us e a p-v alue/test statistic sum mary . T h erefore, b y optimalit y of the ODP , our metho d is optimal within e ach bin among m etho ds based on one-dimensional summary statistics, bu t optimalit y o ver all bins is n ot guarante ed . It should b e noted that al l metho d s that are based on the p osterior probabilit y of the H 0 i ( H 1 i ) can b e seen as v arian ts of the ODP method in this general sense. It is a disadv an tage of the ODP m etho d to assume n ormalit y (or an y other sp ecific parametric mo del und er H 1 ) of th e measurement s y and mak e an ad ho c preliminary guess of the status of eac h n ull hyp otheses. In addition, the use of p lug-in estimation is an iss ue. O u r metho d is based on m uc h fewer assumptions, basically only that v alid p-v alues may b e calculated, and that p-v alues/test statistics are indep enden t of the co v ariate under the n ull. In this sense, our approac h is u nsup ervised and data driv en, and allo ws to incorp orate co v ariates in a very simple and intuitiv e w a y . F urth er m ore, our co v ariate-mo dulation id eas may b e combined with the full-lik eliho o d version of the ODP in at least t wo w a ys. On e approac h is to bin the data y i b y the co v ariate and estimate the ODP separately in eac h bin , extending a suggestion in Storey ( 2007 ) (p age 353 ) to an exter- nal co v ariate. A problem with this approac h is that is not clear how one could smo oth b et we en bins, wh ic h should b e b eneficial. Another approac h UNSUPER V ISED MUL TIPLE TESTING WITH EXTERN AL COV ARIA TES 17 is to first apply the ODP metho d to the data ignoring the co v ariate, cal- culate ODP-based adjusted p -v alues [as describ ed in the Su p plemen tary Material of Storey , Dai and Leek ( 2007 ), equation (10), page 5], and fin ally apply our metho d using the ODP-based p-v alues and the external co v ari- ate. Other FL metho ds are based on hierarchical Ba yesia n mixtu r e mo d eling. Relev ant references include Baldi and Long ( 2001 ), Do, M ¨ uller and T ang ( 2005 ), Kendziorski et al. ( 2006 ), Lonnstedt and Sp eed ( 200 2 ), Newton et al. ( 2004 ). As in our approac h , inference is b ased on p osterior probabilities of the null and alternativ e hypotheses. These metho ds require fu ll Ba y esian mo deling and distribu tional assumptions, which are lo ok ed at with skep- ticism b y practitioners used to un sup er v ised testing. As for the ODP , the hierarc h ical Ba y esian m ixture m o dels m ay b e combined w ith our approac h. This can agai n b e done by b in ning, and in the Ba y esian approac h s m o othing b et ween bin s is no w more immediately applicable. Ho wev er, the use of our approac h in a fully Ba yesian setting m a y b ecome computationally demand - ing. The one-bin mo del d iffers from Efron’s lo cal FDR in that the one-bin mo del assumes a sp ecific parametric mixtur e mo del for the p-v alues, whereas in the lo cal FDR metho d the densit y of the p -v alues is estimated using para- metric smo othing of the p-v alue histogram. A b y-pro duct of the estimation of the one-bin mo del is an estimate of π 0 , the probabilit y that a giv en null h y p othesis is tru e (or, equiv alen tly , the p r op ortion of tru e null hyp othesis). This is an inte resting quan tit y in its o wn righ t, and several metho ds ha ve b een prop osed for its estimatio n , suc h as th e estimato r of Storey ( 200 2 ), and the con v ex d ecreasing estimator of Langaas, Lind qvist and F erkingstad ( 2005 ). When estimating th e full B -bin mo d el, similarly an estimate of π 0 j can readily b e found using the method s of Storey ( 2002 ) or Langaas, Lind qvist and F erkin gstad ( 2005 ) in eac h bin j , and this ma y b e compared to the estimated π 0 j from the B -bin mo del. 6. Sim u lation exp eriment. This sim ulation exp erimen t sho ws that the estimated co v ariate-mo dulated p osterior probabilities of the null hyp othe- ses are close to the true v alues in a con trolled setting, and visualizes the effect of v arying degrees of co v ariate mo d u lation. Simulati ons we re d one for v aryin g degrees of co v ariate-dep en dence and v arying ov erall prop ortions of true null h yp otheses. The main pro cedure for the generation of eac h sim u lated d ata set is as follo ws: First, co v ariates x i , i = 1 , . . . , m , are sampled iid from Unif [0 , 1], m = 30000. A cov ariate-modulation function π 0 ( x ) is sp ecified (see b elo w). F or eac h i , we let H 0 i b e tr u e with probabilit y π 0 ( x i ), and let H 1 i b e true with pr obabilit y 1 − π 0 ( x i ). W e sample z i from N (0 , 1) if H 0 i is true, and 18 FERKINGST A D ET AL. sample z i from N (2 , 1) otherwise. The samp led z i are then test statistics f or m tests of H 0 i : θ = 0 vs. H 1 i : θ = 2, where Z i ∼ N ( θ , 1). As a first step in c ho osing a suitable cov ariate-modu lation function, w e decide on an ov erall lev el for the p r op ortion of tru e null hyp otheses, that is, w e set ¯ π 0 ≡ R 1 0 π 0 ( x ) dx to some fi xed num b er. Th e strength of the d ep en- dence on the cov ariate is determined by the steepness of th e function π 0 ( x ). W e ha ve c hosen the follo wing parametric f orm for π 0 ( x ): π 0 ( x ) = exp( − α − ( β − α ) x γ ) , (7) where α , β and γ are p ositiv e constan ts, and π 0 ( x ) is d ecreasing if and only if α > β . W e ha ve confined our sim ulation exp eriment to decreasing π 0 ( x ). F or eac h v alue of ¯ π 0 , w e set the strength of the co v ariate-dep endence by c ho osing appropriate α and β , implicitly setting π 0 (0) and π 0 (1) since α = − log( π 0 (0)) and β = − log( π 0 (1)), an d then c h o osing γ s uc h that R 1 0 exp( − α − ( β − α ) x γ ) dx = ¯ π 0 . The sim ulation results rep orted b elow are all from 100 0 run s of the al- gorithm d escrib ed in S ection 3 . Po in twise medians, 5% qu an tiles and 95% quan tiles were calculated based on the 1000 run s. In eac h run a total num- b er of 30000 test statistics were simulat ed. In eac h case, one-bin no-co v ariate and 10-bin co v ariate-mo dulated p osterior probabilities were calculated for the same data sets. T rue p osterior p r obabilities w ere calculated as d escrib ed in the S upplementary Material [F erkingstad, F rigessi, Rue, Th orleifsson and Kong ( 2008 )]. W e first consider tw o sim ulated data sets with relativ ely wea k co v ariate- mo dulation. W e c ho ose α , β and γ in ( 7 ) such th at ¯ π 0 = 0 . 5, π 0 (0) = 0 . 55 and π 0 (1) = 0 . 45. Th e top ro w in Figur e 5 show the estimated p osterior probabilities for the 10-bin and one-bin metho ds, compared to the true p os- terior probabilities, in b ins 1, 3, 5, 7 and 9. Th e red cu rv es sh ow the median estimated co v ariate-modu lated p osterior p robabilities (solid lines) together with 0.05 and 0.95 quan tiles (d ashed lines) f rom the 1000 run s. The green curv es sho w the tru e p osterior probabilities. On ly p osterior p robabilities for p-v alues in th e range [0 , 0 . 1] are sho w n, sin ce th e p osterior probabilities are to o high to b e of interest outside th is ran ge. Notice first th at the one-bin p osterior probability is inv arian t o ve r different bins, since this d o es not de- p end on co v ariate-information. Ho we v er, the estimated co v ariate-mo dulated p osterior pr obabilit y and the tru e p osterior probabilit y v ary o v er different bins. F rom the t wo top ro ws of Figure 5 , we see that the estimated 10-bin p osterior probability is v ery close to the truth. The one-bin estimated p os- terior pr obabilit y is a go o d estimate for bin s corresp on d ing to a mo d er ate v alue of the co v ariate (bin 5), but deteriorates for more extreme v alues of the cov ariate (other bins). This is as exp ecte d : Since co v ariate mo d ulation is quite wea k, the in formation in the co v ariate should not c h ange the dis- co v eries. This result is consisten t with w hat we sa w for a second real data UNSUPER V ISED MUL TIPLE TESTING WITH EXTERN AL COV ARIA TES 19 Fig. 5. Simulate d data sets. The top r ow shows estimate d p osterior pr ob abil ities for ¯ π 0 = 0 . 5 wi th we ak c ovariate-mo dulation, the m i dd le r ow shows r esults for ¯ π 0 = 0 . 9 wi th we ak c ovariate-mo dulation and the b ottom r ow shows r esults for ¯ π 0 = 0 . 5 with str ong c o- variate-mo dulation. T en bins wer e use d i n the c alculations, but only bins 1, 3, 5, 7 and 9 ar e shown her e. F or e ach bin, the b old gr e en curve shows the true p osterior pr ob abili ti es. The r e d curves show estimate d 10-bin c ovariate-mo dulate d p osterior pr ob abili ties, wher e the soli d curve is the me dian of the 1000 sim ulations, and the dashe d curves ar e 0.05 and 0.95 quantiles. Simi larly, the blue curves show estimate d no-c ovariate (one-bin) p osterior pr ob abilities (me dian with 0.05 and 0. 95 quantiles). set, as r ep orted in the Sup plemen tary Material [F erkingstad, F rigessi, Rue, Thorleifsson and Kong ( 2008 )]. As the second case of we ak cov ariate-modu lation, we c ho ose ¯ π 0 = 0 . 9, π 0 (0) = 0 . 95 and π 0 (1) = 0 . 85. Results, shown in the middle ro w of Fig- ure 5 , are similar to what we sa w in the first case. Again, it is seen that the co v ariate-based estimation metho d give s a very close appro ximation to the truth, while the nonco v ariate-based m etho d misses off sligh tly , particularly for th e bins corresp onding to extreme (particularly small or large) v alues of the co v ariate. 20 FERKINGST A D ET AL. Finally , we consider a sim ulated data set where there is strong co v ariate- mo dulation. Here, w e ha v e chosen ¯ π 0 = 0 . 5, π 0 (0) = 0 . 9 and π 0 (1) = 0 . 1. The results are sh o wn in the b ottom ro w of Figure 5 . W e again see that the es- timated 10-bin co v ariate-mod ulated p osterior probabilities are v ery close to the true v alues. Clearly , the co v ariate-mo dulation metho d do es we ll in cap- turing the information in the co v ariate in this case. Th ere is a big d ifference b et ween the 10-bin p osterio r probab ility an d the no-co v ariate metho d. The no-co v ariate metho d d o es n ot work well in any b ins (except p ossibly b in 5). When co v ariate information is a v ailable, using it, ev en in an un s up ervised fashion, h as a p oten tially imp ortan t impact. 7. Discussion. W e defin ed the co v ariate-modu lated p osterior probabil- it y as P ( H 0 i | p i , x i ), where p i is the i th p-v alue and x i the corresp onding co v ariate for i = 1 , . . . , m hypothesis tests. More generally , we can consider P ( H 0 i | p i , x ), where x = ( x 1 , x 2 , . . . , x m ) is a vec tor of co v ariates. W e use the assump tion that g ( z i | H 0 i , x i ) = g ( z i | H 0 i ), wh ere g denotes the densit y of th e test statistics. Ho we v er, th e metho d could also b e adapted to the case w here g ( z | H 0 i , x i ) is known as a function of x i . F urth er m ore, additional b eta comp onen ts can b e ad d ed to the mixture ( 3 ). Also, it is p ossible to incorp orate m easuremen t error in the co v ariate, by adding a further lev el to the Ba yesian hierarchical mo del. In the Supplement ary Material [F erkingstad, F rigessi, R u e, Th orleifsson and Kong ( 2008 )] w e test for d ifferen tially expr essed genes, b et w een breast cancer tumors with and w ithout a mutation in the gene TP53. Here, we use genome-wide CGH copy num b er alteration as the co v ariate mo dulating the a priori b elief in eac h null hyp othesis. This d ata set is c hosen to illustrate a case wh ere the information con tained in the co v ariate is limited, but its use do es not corrupt the r esults. An imp ortan t application w here a co v ariate can pla y an imp ortan t r ole is genome-wide asso ciation stud ies where h u ndreds of thousands of SNPs (sin- gle nucleo tide p olymorph isms) are tested for asso ciation to quanti tativ e or qualitativ e traits. With gene expression traits, p-v alues calculated for SNPs residing in the n eigh b orho o d of the corresp ond ing genes (cis-v ariants) could again b e ev aluated u sing our app roac h. Here b oth the heritabilit y and the cis link age score could b e u sed as co v ariates, either individually or join tly . A r e- lated application is an asso ciation study for a disease trait (e.g., diab etes). Here the notion of a cis v ariant do es n ot apply and it is exp ected that a large n u m b er of SNPs, but n onetheless a very small fraction of all the SNPs typ ed, could b e associated to the disease. A common design is a case-con trol stu d y , and the asso ciation scores for the hundreds of thousands of SNPs genot yp ed and tested ha ve to b e ev aluated taking multiple comparisons into accoun t. Indeed, it has b een prop osed that the link age scores resulting from a family study of the disease could b e used to assist the analysis through d ifferen tial UNSUPER V ISED MUL TIPLE TESTING WITH EXTERN AL COV ARIA TES 21 w eighting of the p-v alues [Ro ed er et al. ( 2006 ), Genov ese et al. ( 2006 )] with the wei gh ts working like prior probabilities. The metho d we p rop osed here is an alternativ e to the weigh ting metho d. This application also raises th e p ossibilit y that instead of mo deling the distr ibution of th e p-v alues und er H 1 directly , one can mo del the effect sizes of the asso ciation; giv en a d istribu- tion of the effect sizes, there is a corresp onding distribution for the p-v alues. Mo deling this w a y can in theory pr o vide for eac h SNP , at the end of the analysis, not only the p robabilit y th at the alternativ e hyp othesis is tru e, but also the p osterior d istribution of its effect size. Th e shrink age c haracteristics of such metho d s could b e a p oten tial solution to the w in ner’s curse, wher e the observe d effect sizes for the SNPs that sho wed the strongest associations tend to b e biased upw ard ev en when they are tru e p ositiv es. Ac kn o wledgment s. W e than k the Editor, an Asso ciate E ditor and an anon ymou s referee for h elpful commen ts that h a ve led to an impro ved pap er. SUPPLEMENT AR Y MA TERIAL Unsup ervised empirical Bay esian m ultiple testing with external co v ari- ates (doi: 10.121 4/08-A OAS158 S UPP ; .p df ). REFERENCES Abramovich, F. , B enjamini , Y. , Donoho, D. L. and Johnstone, I. M. ( 2006). Adapt - ing to un known sparsit y by controlling the false disco very rate. Ann. Statist. 34 584–653. MR2281879 Allison, D. B. , Ga dbur y, G . L. , Heo, M. , Fern ´ andez, J. R. , Lee, C. , Proll a, T. A. and Weind ruch, R. (2002). A mixture mo del approac h for the analysis of microarray gene expression data. Comput. Statist. Data Anal. 39 1–20. MR1895555 Almasy, L. and Blangero, J. (1998). Multip oint quantitativ e-trait link age analysis in general p edigrees. Am. J. Hum. Genet. 62 1198–1211. Anderson, J. A. and Blair, V. (1982). P enalized maximum likelihood estimation in logistic regression and discrimination. Bi om etrika 69 123–136. MR0655677 Baldi, P. and Long, A. ( 2001). A Ba yesian framew ork for t he analysis of microarra y expression d ata: Regularized t-test and statistical inferences of gene changes. Bioinf or- matics 17 509–519. Benjami ni, Y. an d Hochberg, Y. (1995). Con t rolling t he false discov ery rate: A practical and p ow erful approach to multiple testing. J. R oy. Statist. So c. Ser. B 57 289–300. MR1325392 Bro wn, L. , Gan s, N., Ma ndelbaum, N. G. A. , Sak ov, A. , Shen, H . , Zel tyn, S . and Zhao, L. (2005). Statistical analysis of a telephone call center: A queueing-science p erspective. J. Am. Statist. Asso c. 100 36–50. MR2166068 Bystr y kh, L. , W eersing, E. , Dontje, B. , Sutton, S. , Pletcher, M. T. , W il tshir e , T. , Su, A. I. , Vellenga, E. , W an g, J. , Manl y, K. F. , Lu, L. , Chesler, E. J. , Alber ts, R. , Jansen, R. C. , Wi lliams, R. W. , Cooke, M. P. and de H aan, G. (2005). U ncov ering regulatory pathw ays that affect hematop oietic stem cell function using “genetical genomics.” Nat. Genet. 37 225–232. 22 FERKINGST A D ET AL. Diaconis, P. and Yl visaker, D. (1985). Quantifying prior opinion (with discus- sion). In Bayesian Statistics 2 ( V alencia , 1983 ) 133–156. North- Holland, Amsterd am. MR0862488 Do, K. , M ¨ uller, P. and T ang, F. (2005). A Bay esian mix ture mo d el for differential gene expression. J. Roy . Statist. So c. Ser. C 54 627–644. MR2137258 Efr on, B. , Tibshirani, R. , Storey, J. and Tush e r, V. (2001). Empirical Ba yes analysis of a microarray exp erimen t. J. Amer. Statist. Asso c. 96 1151–1160. MR1946571 Ferkingst ad , E., Frige ssi, A . , Rue, H., Thorleifsson, G. and K ong, A. (2008). Supplement to “Unsup ervised empirical Bay esian multiple testing with external co v ari- ates.” DOI: 10.1214/08-A OAS158SUPP . Genovese, C. R. , Laz a r, N. A . and Nichols, T. (2002). Thresholding of statistical maps in functional neuroimaging using the false disco very rate. Neur oImage 15 870– 878. Genovese, C. R. , Roeder, K. and W asserman, L. (2006). F alse disco very rate con trol with p -v alue weigh ting. Biometrika 93 509–524. MR2261439 Gudbjar tsson, D. F. , Jonasson, K. , Frigge , M. L. and Kong, A. (2000). Allegro, a new computer p rogram for multipoint link age analysis. Nat. Genet. 25 12–13. Heikkinen, J. and Pentti nen, A. (1999). Bay esian smo othing in the estimation of the pair p otential function of gibbs p oint processes. Bernoul li 5 1119–113 6. MR1735787 Jansen, R. C. and N ap, J. P. (2001). Genetical genomics: The added v alue from segre- gation. T r ends Genet 17 388–91. Kendziorski, C. , Che n, M . , Yuan, M. , Lan, H. and A ttie, A. (2006). S t atistical metho d s for exp ression quantitativ e trait lo ci (eQTL) m ap p ing. Biometrics 62 19–27. MR2226552 Ko n g, A . and Co x, N. J. (1997). Allele-sharing mo dels: LO D scores and accurate link age tests. Am. J. H um . Genet. 61 1179–11 88. Kunsch, H . (1994). R obust priors for smo othing and image restoration. Ann. Inst. Statist. Math. 46 1–19. MR1272743 Langaas, M. , Lindqvist, B. H. and Ferkingst ad, E. (2005). Estimating th e proportion of true null hyp otheses, with application to DNA microarra y data. J. R. Stat. So c. Ser. B Stat. Metho dol. 67 555–572. MR2168204 Lonnstedt, I. and Speed , T. (2002). Replicated microarray data. Statist. Sinic a 12 31–46. MR1894187 Miller, C. J. , Genovese, C. , Ni chol, R. C. , W a sse rm an, L. , Connoll y, A. , Re- ichar t, D . , H opkins, A . , Schneider, J. and Moore, A. (2001). Control ling the false disco very rate in astrophysi cal data analysis. Astr on. J. 122 3492–3505 . Monks, S. A. , Leonardson, A. , Zhu, H. , Cundiff, P. , Pietrusiak, P. , Edw ards, S. , Phillips, J. W. , Sachs, A. and Schadt, E. E. (2004). Genetic inheritance of gene expression in human cell lines. Am. J. Hum. Genet. 75 1094–1105. Morley, M. , Molony, C. M. , Weber, T. M. , Devlin, J. L. , Ewens, K. G. , Spie lma n , R. S. and C heung, V. G. (2004). Genetic analysis of genome-wide v ariation in human gene expression. Natur e 430 743–747 . Newton, M. , Noueyri, A. , Sarkar, D. and Ahlquist, P. (2004). Detecting d ifferenti al gene expression with a semiparametric h ierarc hical mixt u re meth o d. Biostatistics 5 155–176 . Ott, J. (1999). A nalysis of Human Genetic Linkage , 3rd ed . Johns Hopk ins Un iv. Press, Baltimore. P arker, R. A. and Rothenber g, R. B. ( 1988). Id entifying imp ortant results from mul- tiple statistical t ests. Stat. Me d. 7 1031–10 43. UNSUPER V ISED MUL TIPLE TESTING WITH EXTERN AL COV ARIA TES 23 Ro eder, K. , B acanu, S.-A. , W a sserman, L. and Devlin, B. (2006). Using link age genome scans to improv e p ow er of association in genome scans. Am. J. Hum. Genet. 78 243–252. Rue, H. and Mar tino, S . ( 2007). Approximate-Ba yesian inference for hierarc hical Gaussian Marko v random field mo dels. J. Statist. Plann. Infer enc e 137 3177 –3192. MR2365120 Schadt, E. E. , M onks, S. A. , Drake, T . A. , Lusis, A. J. , C he, N. , Colina yo, V. , Ruff, T. G. , Milligan, S. B . , Lamb, J. R . , Ca ve t, G. , Linsley , P. S. , Mao, M. , Stoughton, R. B. and Fri end, S. H. (2003). Gen etics of gene expression survey ed in maize, mouse and man. Natur e 422 297–302. Sham, P. C. , Purcell, S. , C herny, S. S. and Abecasi s, G. R. (2002). Po werful regression-based q uantitativ e-trait link age analysis of general p edigrees. Am. J. Hum. Genet. 71 238–253. Storey, J. D. (2002). A direct approach to false disco very rates. J. R. Stat. So c. Ser. B Stat. Metho dol. 64 479–498 . MR1924302 Storey, J. D. (2007). The optimal disco very p rocedu re: A new approach to simultaneo us significance testing. J. R. Stat. So c. Ser. B Stat. Metho dol . 69 347–368. MR2323757 Storey, J. D. , Dai, J. Y. and Le ek, J. T. (2007). The optimal disco very p rocedu re for large-scale significance testing, with applications to comparative microarra y exp er- iments. Bi ostatistics 8 414–432. Thompson, A. , Bro wn, J. , Ka y, J. and Titterington, D. ( 1991). A study of meth- ods of choosing the smooth in g parameter in imagerestoration by regularization. IEEE T r ans. Pattern Anal. Machine Intel l. 13 326–339. Tusher, V. G. , T ibshirani, R. and Chu, G. (2001). Significance analysis of microarra ys applied to th e ionizing radiation resp onse. PNAS 98 5116– 5121. Wu, B. , G uan, Z. and Zh ao, H. (2006). Para metric and nonparametric FDR estimatio n revisited. Biom etrics 62 735–744. MR2247201 E. Ferkingst ad Dep ar tment of Biost atis tics University of Oslo PO box 1 122 Blindern N-0317 Oslo Nor w a y E-mail: egil.ferkingstad@medisin.uio.no A. Frigessi (sfi) 2 —St a tistics for Inn ov at ion The Nor wegian Computing Centre PO box 1 14 Blindern N-0314 Oslo Nor w a y E-mail: arnoldo.frigessi@medisi n.uio.no H. Rue Dep ar tment of Ma thematic al S ciences Nor wegian University of S cience and Technology N-7194 Trondheim Nor w a y E-mail: ha v ard.rue@math.nt n u. no G. Thorleifsson A. Kong Decode Genetics Sturluga t a 8 IS-101 Reykja vik Iceland E-mail: gudmar.thorleifsson@decode.is augustine.k ong@decode.is
Original Paper
Loading high-quality paper...
Comments & Academic Discussion
Loading comments...
Leave a Comment