QR-Adjustment for Clustering Tests Based on Nearest Neighbor Contingency Tables
The spatial interaction between two or more classes of points may cause spatial clustering patterns such as segregation or association, which can be tested using a nearest neighbor contingency table (NNCT). A NNCT is constructed using the frequencies…
Authors: Elvan Ceyhan
T ec hnical Rep ort # KU -EC-08-5: QR-Adjustmen t for Clustering T ests Based on Nearest Neigh b or Con tingency T ables Elv an Ceyhan ∗ No ve m b er 1, 2018 Abstract The spatial interaction b et ween tw o or more classes of points ma y cause spatial clustering patterns such as segregation or association, which can b e tested using a nearest neigh b o r contingency table (NNCT). A NN C T is constru cted using the frequ en ci es of class typ es of points in nearest neighbor (NN) pairs . F or tests based on NN C Ts (i.e ., NN CT - tests), the null pattern is either complete spati al randomness (CSR) of the p oin ts from tw o or more classes (called CSR indep endence) or random lab eli ng (RL). The RL pattern implies th at the lo cations of the p oin t s in the study region are fix ed, while the CSR indep endence pattern implies that they are random. The distributions of the NNCT-test statistics dep end on the num b er of reflexive NN s ( denoted b y R ) an d the num b er of shared NNs (d enoted by Q ), b oth of whic h dep end on the allocation of the points. Hence Q and R are fixed quantities under RL, but random v ariables under CSR indep endence. How ever given the d ifficult y in calculating the exp ected v alues of Q and R under CSR indep endence, one can use their observed v alues in NN CT analysis, whic h makes the distribu tio ns of th e NNCT-test statistics conditional on Q and R under CSR indep endence. In this article, I use the empirically estimated exp ected v alues of Q and R under CSR indep endence pattern to remo ve the conditioning of NNCT-tests (suc h a correction is called th e QR-adjustment , henceforth). I present a Monte Carlo sim ulation study to compare the cond iti onal NNCT-tests (i.e., tests with th e observed v alues of Q and R are used) an d un cond itio nal NNCT-tests (i.e., empirically QR-ad justed tests) u nder CSR independ ence and s egregation and asso ciation alternativ es. I d emo nstrate that QR - adjustment do es not significantly impro ve the empirical size estimates u nder CSR indep endence and p o wer estimates u nder segregation or association alternatives. F or illustrativ e p urposes, I app ly th e conditional and empirically corrected t ests on tw o example data sets. Keywor ds: Asso cia tion; complete spatial randomness; conditional test; nearest n ei gh b or con tingency table; random labeling; spatial clustering; spatial pattern; segregation ∗ correspondin g author. e-mail: elceyh an@ku.edu.tr (E. Ceyhan) ∗ Departmen t of Mathematics, Ko¸ c Uni v ersity , 34450 Sarıyer, Istan bul, T urke y 1 1 In tro duction Spatial patterns have b een studied extensively a nd have imp ortan t implica tions in many fields such as epidemiology , p opulation biolog y , a nd ecology . It is o f practica l interest to study the univ aria te spatia l patterns (i.e., patterns of only one cla ss) as well as m ultiv ariate patterns (i.e., pa tt erns o f m ultiple classes) (Pielou (1961), Whipple (1980), and Dixon (1994, 2 002 )). F o r conv enience and generality , I call the different t yp e s of p oin ts as “class es”, but a cla ss lab el ca n stand for a n y c ha racteristic of a measurement at a par ticular lo cation. F or example, the spatial segreg a tion pattern has b een investigated for sp e cies (Diggle (2003)), age classes of plants (Hamill and W right (198 6 )), fish sp e cies (H erler and Patzner (2005)), and sex es o f dio ecious plants (Nanami et al. (1999)). Man y of the epidemiological a pplications are for a tw o-clas s system of case and cont rol lab els (W aller and Gotw ay (2 004 )). In this a rticle, for simplicity , I describ e the spatial p oint pa tterns for tw o clas ses only; the extensio n to mult i-class ca se is straightforw a rd. The null pattern is usually one of the t wo (random) pattern type s : c omplete sp atial r andomness (CSR) of tw o o r more clas ses or r andom lab eling (RL) of a se t of fixed points with tw o classe s. That is, when the p oints from each class a re assumed to be uniformly distributed ov er the region of interest, the the null hypothesis is the CSR of p oin ts fr om tw o classes . This type of CSR pa ttern is also referred to as “p opulation indep endence” in litera ture (Goreaud and P´ elissier (20 03 )). In the univ a riate spatial analy sis, CSR refers to the pattern in which lo cations o f points from a si ngle class are ra ndom over the study area. T o distinguish the CSR of p oin ts from t wo-class e s and CSR of points from o ne cla ss, I call the former as “CSR indep endence” and the la tter as “CSR”, henceforth. Note that CSR indep endence is equiv alent to the case that RL pro cedure is applied to a given set o f points from a CSR pa tter n in the sens e that after po in ts a re generated unifor mly in the region, the class labels are assigned randomly . When only the la beling of a set of fixed points (the allocatio n of the points could b e r egular, ag gregated, or clustered, or of lattice t yp e) is r andom, the null hypothes is is the RL pattern. Many tests of spatial segrega tion hav e b een developed in literature (Orton (19 8 2 )). These include co m- parison of Ripley ’s K ( t ) or L ( t ) functions (Ripley (2004)), comparison of near est neighbor (NN) distances (Diggle (2003), Cuzick a nd Edwards (1990)), and analysis of near est neighbor contingency tables (Pielou (1961), Meagher and Burdick (1980)). Nearest neighbor cont ingency ta bles (NNCTs) are constructed using the fr e quencies of classes of po in ts in NN pairs. Kulldorff (2 006) provides an ex tens iv e review of tests o f spatial ra ndomness that adjust for an inhomog eneit y of the densities of the underly ing populations. P ielou (1961) prop osed v arious tests and (Dixon (1994)) intro duced a n overall test o f segregatio n, cell-, a nd cla ss- sp ecific tests based on NNCTs for the tw o-class ca se and extended his tests to m ulti-cla ss c ase (Dixon (2002)). These tes ts based on NNCTs (i.e., NNCT-tests) w ere des igned for tes tin g the RL of points. P ielou (1961) used the usua l Pearson’s χ 2 -test of indep endence for detecting the segreg ation of the t wo classes . Due to th e ease in computation and in terpr e ta tion, P ielou’s test of segregation is frequently used for bo th CSR indep endence and RL patterns. How ever it has b een shown that Pielou’s test is not a ppr opriate for testing RL (Meagher and Burdick (1980), Dixon (1 994)). Dixon (199 4 ) derived the appro priate (asymp- totic) sampling distribution of cell counts using Mora n join count statistics (Moran (1948)) and hence the appropria te test which als o has a χ 2 -distribution (Dixon (199 4 )). F o r the tw o-clas s case, Ceyhan (2006) compared these tests, extended the tests for testing CSR indep endence, a nd demonstra ted that Pielou’s tests are o nly a ppropriate for a r andom sample of (base , NN) pairs. F ur thermore, Ceyhan (2007) prop osed three new ov erall segreg ation tests. Since Pielou’s test is not appr opriate, NNCT-tests o nly refer to Dixon’s ov era ll test and the thr ee new segrega tion tests pro p osed b y Ceyha n (2007). Howev er the distr ibutions o f the NNCT-test statistics dep end on the num b er of reflexive NNs (denoted by R ) and the n umber of shared NNs (denoted by Q ), both of which depend on the allo cation of the po in ts. Hence Q and R are fixed un der RL, but random un der CSR indep endence. But expectatio ns of Q and R seem to b e not a v ailable analytically under the CSR indep endence, so their obse r v ed v alues were used by Ceyhan (2007). In this a r ticle, I r eplace the expectations of Q and R b y their empirical estimates under CSR independence. Such a correction for removing the conditiona l nature of NNCT-tests is calle d “QR-a djustment”, henceforth. The NNCT-tests a r e designed for testing a more general null hypo thes is, namely , H o : r andomness in t h e NN structu r e , which usually results from CSR indep endence or RL. The distinction b e t ween CSR independenc e and RL is very imp ortant when defining the a ppropriate null model for each empirical case, i.e., the n ull model depends on the particular context. Gorea ud and P´ elissier (2003) discuss the differences 2 betw een these tw o null hypotheses and demonstrate tha t the misinterpretation is very common. They assert that under CSR independence the (lo cations o f the points from) tw o classes ar e a priori the result of different processes (e.g., individua ls o f diff e r en t sp ecies or age cohorts), wherea s under RL some pro cesses affect a p osteriori the individuals of a single p opulation (e.g., diseased v ersus non-dis e a sed individuals of a single species). Notice that although CSR independence and RL are not sa me, they lead to the same null mo del (i.e., r andomness in NN structure) for NNCT-tests, since a NNCT does not re q uire spatially-ex plic it information. I cons ide r t wo ma jor t yp e s of (biv ariate) s pa tial clus ter ing patterns, namely , asso ciation and se gr e gation as a lternativ e patterns. Asso ciation o ccurs if the NN of a n individual is more likely to b e from another class. Se gr e gation o ccurs if the NN of an individual is more likely to be of the sa me cla s s a s the individual; i.e., the mem ber s of the same class tend t o be clump ed or clustered (see, e.g., Pielou (1961)). F or more detail on these a lternativ e patterns , see (Cey han (2007)). I assess the effects of QR-adjustmen t o n t he size o f the NNCT-tests under CSR indep endence a nd on the power of the tests under the segrega tion o r asso ciation alternatives by an extensiv e Monte Car lo study . Throughout the ar ticle I ado pt the conv ent ion that random quantities are denoted by ca pital letters , while fixed quant ities ar e denoted b y low er case letters . I descr ibe the construction of NNCTs in Section 2.1, provide Dixon’s tests in Sections 2.2 and 2.4, empirical significance levels of the tests in Section 3, t wo illustrative exa mples in Section 5, and discussion and conclusions in Section 6. 2 Nearest Neigh b or Con tingency T ables and Relate d T ests 2.1 Construction of the N ea rest Neigh b or Contingency T ables NNCTs are constructed using the NN frequencies of classes. I describ e the construction of NNCTs for tw o classes; extension to multi-class case is stra igh tforward. Consider tw o clas ses w ith la b els { 1 , 2 } . Let N i be the num ber of p oint s from class i for i ∈ { 1 , 2 } and n be the to ta l sample size, so n = N 1 + N 2 . If I record the class of each po in t and the class of its NN, the NN r elationships fall in to four distinct c a tegories: (1 , 1 ) , (1 , 2); (2 , 1) , (2 , 2) where in cell ( i, j ), clas s i is the b ase class , while clas s j is the cla ss of its NN . That is, the n p oin ts constitute n (base, NN) pairs. Then ea c h pair can be categorized with res pect to the base lab el (row ca tegories) and NN lab el (co lumn categ ories). Denoting N ij as the frequency of cell ( i, j ) for i, j ∈ { 1 , 2 } , I obtain the NNCT in T a ble 1 where C j is the sum of co lumn j ; i.e., num b er of times class j po in ts serve as NNs for j ∈ { 1 , 2 } . F urthermore, N ij is the cell co un t for cell ( i, j ) that is the sum of all (base, NN) pairs each o f which has lab el ( i, j ). Note also that n = P i,j N ij ; n i = P 2 j =1 N ij ; and C j = P 2 i =1 N ij . By co nstruction, if N ij is lar ger (smaller) than expe c ted, then class j s erv es a s NN mor e (less) to class i than exp ected, which implies (lack of ) seg regation if i = j a nd (lack of ) asso ciation o f class j with cla ss i if i 6 = j . Hence, column sums, cell coun ts are random, while row sums and the ov era ll sum are fixed quantities in a NNCT. NN class class 1 class 2 sum class 1 N 11 N 12 n 1 base class class 2 N 21 N 22 n 2 sum C 1 C 2 n T able 1: The NNCT for tw o classes . Observe that, un der segregation, the diagonal entries, N ii for i = 1 , 2, tend to be larger than exp ected; under asso ciation, the off-diagonals tend to b e larger than expected. The general alternative is that some cell counts ar e different than exp ected under CSR independence o r RL. In the tw o-clas s case, Pielou (19 6 1) use d Pearson’s χ 2 -test of indep endence to detect an y deviation fro m CSR independence or RL. But, under CSR independence or RL, this test is lib eral, i.e., has larger size than the nominal level (Ceyhan ( 2006)), hence not considered in this article. Dixo n (1994) prop osed a series of 3 tests for segre gation based on NNCTs. He first devis ed four cell-sp ecific tests in the t wo-class case, and then combined them to form a n ov erall test. F or his tests, the pr obabilit y o f a n individual from class j ser ving as a NN of an individual from class i depends only on the class sizes (i.e., row sums), but not the total num b er of times class j serves a s NNs (i.e., column sums). 2.2 Dixon’s Cell-Sp ecific T ests The level of segreg ation is estimated by comparing the o bs erv ed cell counts to the expec ted cell co unts under RL of p oin ts that a re fixed. Dixon demo ns trates that under RL, one can write down the cell frequencies as Moran join count statistics (Moran (1948)). He then derives the mea ns, v ar iances, and co v ar iances o f the cell counts (frequencies ) in a NNCT (Dixon (1994, 2002)). The n ull hypo thesis under RL is given by H o : E [ N ij ] = ( n i ( n i − 1) ( n − 1) if i = j , n i n j ( n − 1) if i 6 = j . (1) Observe that the exp ected cell counts dep end only on the size of each class (i.e., row sums), but not on column sums. The cell-sp e cific test statistics s ug gested by Dixo n are given by Z D ij = N ij − E [ N ij ] p V ar [ N ij ] , (2) where V ar [ N ij ] = ( ( n + R ) p ii + (2 n − 2 R + Q ) p iii + ( n 2 − 3 n − Q + R ) p iiii − ( n p ii ) 2 if i = j , n p ij + Q p iij + ( n 2 − 3 n − Q + R ) p iij j − ( n p ij ) 2 if i 6 = j , (3) with p xx , p xxx , and p xxxx are the probabilities that a randomly pick ed pair, tr iplet, or quartet of points, resp ectiv ely , a re the indicated classe s and are given by p ii = n i ( n i − 1) n ( n − 1) , p ij = n i n j n ( n − 1) , p iii = n i ( n i − 1) ( n i − 2) n ( n − 1) ( n − 2) , p iij = n i ( n i − 1) n j n ( n − 1) ( n − 2) , (4) p iijj = n i ( n i − 1) n j ( n j − 1) n ( n − 1) ( n − 2) ( n − 3) , p iiii = n i ( n i − 1) ( n i − 2) ( n i − 3) n ( n − 1 ) ( n − 2) ( n − 3) . F urthermore , Q is the num b er of p oints with shared NNs, which o ccur when tw o or more points shar e a NN and R is t wice the num b er o f reflexive pairs. Then Q = 2 ( Q 2 + 3 Q 3 + 6 Q 4 + 10 Q 5 + 1 5 Q 6 ) where Q k is the num b er of p oint s that serve a s a NN to o ther p oints k times. One - sided and tw o-side d tests are p ossible for each cell ( i, j ) using the as ymptotic normal approximation of Z D ij given in Equa tion (2) (Dixon (19 9 4 )). The test in Equation (2) is the s a me as Dixo n’s Z AA when i = j = 1; same as Z B B when i = j = 2 (D ixon (1994)). Note also that in Equation (2) four different tests are defined as there are four cells and each is testing the deviation from the null case in the resp ectiv e cell. These four tests are combined and used in defining an ov era ll test o f segr egation in Section 2.4. Under CSR indep endence, the null hypothesis , the test statis tics , and the v aria nces a re as in the RL case for the cell-sp ecific tests, ex cept for the fact that the v aria nce s are conditional on Q and R . 2.3 The Status of Q and R under CSR Indep endence and RL Note the difference in status o f the v aria bles Q and R under CSR indep endence and RL models. Under RL, Q a nd R are fixed q ua n tities; while under CSR indep endence, they are random. The quan tities g iv en 4 in Equatio ns (1), (3), and a ll the quantities dep ending o n these exp ectations also dep end on Q and R . Hence these expressions are appr opriate under the RL patter n. Under CSR indep endence pattern they are conditional v ar iances and cov ar ia nces obtained by using the observed v alues of Q and R . The unconditional v ariances and cov a riances can be o btained by replacing Q a nd R with their expectations. Unfortunately , given the difficulty of ca lculating the exp ectations o f Q and R under CSR indep en- dence, Ceyhan (200 7) employed the conditional v aria nces and cov ar iances (i.e., the v aria nces and cov ari- ances for whic h o bserv e d Q and R v alues ar e used) even when assessing their behavior under CSR inde- pendenc e pattern. Alternatively , I can estimate the v alues of Q and R empirica lly as follows. I genera te n ∈ { 10 , 20 , 30 , 40 , 50 , 100 , 500 , 1000 } points that a re iid (indep enden tly and ident ically distr ibuted) fr o m U ((0 , 1 ) × (0 , 1)), the uniform distribution on the unit squa re. I rep eat this pro cedure N mc = 1000 000 times. A t each Monte Carlo r eplication, I calculate Q and R v alues, and record the ratios Q/n and R/n . I plot these ratios in Figure 1 as a function of sa mple size n . Observe that the ratios seem to conv er ge as n increase s. F or homogeneous plana r Poisson pattern, I have E [ Q/ n ] ≈ . 6327 860 and E [ R/ n ] ≈ 0 . 62112 00. Hence, I r eplace Q and R by 0 . 63 n and 0 . 62 n , resp ectiv ely , to obtain the QR-adjusted v ar ia nces and cov ar ia nces. 0 200 400 600 800 1000 0.628 0.630 0.632 0.634 0.636 0.638 Estimate of Q n under two−class CSR sample size (n) Estimated Q n 0 200 400 600 800 1000 0.619 0.620 0.621 0.622 0.623 0.624 0.625 Estimate of R n under two−class CSR sample size (n) Estimated R n Figure 1: Plotted are the empirically estimated exp ectations E [ Q/n ] (left) and E [ R/ n ] (right) as a function of total sample size n . 2.4 Dixon’s Ov erall Segregation T est Dixon’s overall test of segre gation tests the hypothes is that exp ected cell co un ts in the NNCT a re as in Equation (1) . In the tw o -class case, he ca lculates Z ii = ( N ii − E [ N ii ]) p V ar [ N ii ] for b oth i ∈ { 1 , 2 } and combines these test s tatistics in to a statistic that is a symptotically dis tr ibuted as χ 2 2 under RL (Dixon (1994)). The sugges ted test statistic is given by C = Y ′ Σ − 1 Y = » N 11 − E [ N 11 ] N 22 − E [ N 22 ] – ′ » V ar [ N 11 ] Cov [ N 11 , N 22 ] Cov [ N 11 , N 22 ] V ar [ N 22 ] – − 1 » N 11 − E [ N 11 ] N 22 − E [ N 22 ] – , (5) where E [ N ii ] are as in Equation (1), V ar [ N ii ] are as in Equation (3), and Co v [ N 11 , N 22 ] = ( n 2 − 3 n − Q + R ) p 1122 − n 2 p 11 p 22 . (6) Dixon’s C sta tis tic giv en in Equatio n (5) can also b e wr itten as C = Z 2 AA + Z 2 B B − 2 rZ AA Z B B 1 − r 2 , where r = Co v [ N 11 , N 22 ] . p V ar [ N 11 ] V ar [ N 22 ] (Dixon (1994)). Under CSR independence, the exp ected v alues, v aria nces and cov a riances are as in the RL case . How ever, the v a r iance and co v a riance terms include Q and R whic h are random under CSR independence and fixed 5 under RL. Hence Dixon’s test statistic C as ymptotically has a χ 2 1 -distribution under CSR indep endence conditional on Q and R . Replacing Q and R by their empirical estimates given in Section 2.3, I obtain the QR-adjusted version of Dixon’s test which is denoted b y C qr . 2.5 V ersion I of the New Segregation T ests Ceyhan (2 0 07 ) prop osed tests based on the correc t s ampling distribution o f the c e ll counts in a NNCT under CSR indepe ndence or RL. In defining the new segre g ation or clustering tests, I follow a tra c k similar to that of Dixon’s (Dixon (1994)) where he defines a cell-sp ecific test statistic for each cell a nd then combines these four tests into an ov er all test. F or cell ( i, j ), let T I ij = N ij − n i C j n and then let N I ij = T I ij p n i c j /n = ( N ij − n i c j /n ) p n i c j /n . (7) F urthermore , let N I be the vector of N I ij v alues co ncatenated row-wise and let Σ I be the v ariance- co v ar ia nce matrix of N I based on the co rrect sa mpling distr ibution o f the cell coun ts. Tha t is, Σ I = Co v N I ij , N I kl where Co v N I ij , N I kl = n √ n i c j n k c l Co v [ N ij , N kl ] with Co v [ N ij , N kl ] is as in Eq uation (3) if ( i, j ) = ( k , l ) a nd as in Equa tio n (6) if ( i, j ) = (1 , 1) and ( k , l ) = (2 , 2 ). Since Σ I is not inv er tib le, I use its genera liz ed inv e rse whic h is denoted by Σ − I (Searle (2006)). Then the first version of seg r egation tests sugges ted b y Ceyhan ( 2007) is X 2 I = N ′ I Σ − I N I (8) which as y mpt otically has a χ 2 1 distribution. Under CSR independence, the exp ected v alues , v ariances, and cov ariances rela ted to X 2 I are as in the RL case , except they a r e no t only conditional on co lumn s ums (i.e., on C j = c j ), but also conditional on Q and R . Hence X 2 I has a symptotically χ 2 1 distribution conditional o n column sums, Q and R under CSR independenc e . Repla cing Q and R by their empirical estimates given in Section 2.3, I obtain the Q R- adjusted version of this test which is denoted by X 2 I ,q r , whic h is still co ndit ional on column sums. 2.6 V ersion I I of the New Segregation T ests F or cell ( i, j ), let T I I ij = N ij − n i n j n and then let N I I ij = T I I ij p n i n j /n = ( N ij − n i n j /n ) p n i n j /n . (9) F urthermore , let N I I be the vector of N I I ij concatenated row-wise and let Σ I I be the v aria nc e -co v ar iance matrix of N I I based on the cor rect sampling distribution of the cell counts. That is , Σ I I = Co v N I I ij , N I I kl where Co v N I I ij , N I I kl = n √ n i n j n k n l Co v [ N ij , N kl ] . Since Σ I I is not inv er tible, I use its generalized inverse Σ − I I . Then second version of the tests pro posed b y Ceyhan (2007) is X 2 I I = N ′ I I Σ − I I N I I (10) which asymptotically has a χ 2 2 distribution under RL. Note that Σ I I can b e o btained from Σ used in Equation (5) b y m ultiplying Σ entry-wise with the matrix C I I M = n √ n i n j n k n l . This v ersio n of the segrega tion test is asymptotically equiv alent to Dixon’s seg regation test. 6 Under CSR indep endence, the exp ectations, v aria nces, and co v ar iances re lated to X 2 I I are as in the RL case, but the v ar iances and cov a riances are conditiona l on Q and R . H ence, the asymptotic distribution of X 2 I I is also conditional on Q and R . Repla cing Q and R with their empirical estima tes , I obtain the QR-adjusted version of this test which is denoted by X 2 I I ,q r and is not conditional any mor e. 2.7 V ersion I I I of the New Segregation T ests Notice that version I is a conditional test (co nditional on column s ums), while version I I is asymptotically equiv alent to Dixon’s test, F urthermo r e, both Dixon’s test a nd v ersio n I I incorp orate o nly ro w sums (i.e., class sizes) in the NNCTs. Ceyhan (2007) sugges ts another test statistic which uses b oth the column sums (i.e., n umber of times a class serves as NN) and row sums and is not co nditio na l on the column sums. Let T I I I ij = ( N ij − ( n i − 1) ( n − 1) C j if i = j , N ij − n i ( n − 1) C j if i 6 = j . (11) Let N I II be the vector of T I I I ij v alues co ncatenated row-wise and let Σ I I I be the v ar ia nce-co v ariance matrix of N I II based on the correct sampling distribution of the cell coun ts. That is, Σ I I I = Co v T I I I ij , T I I I kl where the explicit for ms of Cov T I I I ij , T I I I kl are provided in (Cey han (2007)). Since Σ I I I is not inv er tible, I use its gener a lized inverse Σ − I I I . The n the propo sed tes t statistic b y (Ceyhan (2007)) for ov er all segr egation is the quadratic form X 2 I I I = N ′ I II Σ − I I I N I II which asymptotically has a χ 2 1 distribution. Under CSR indep endence, the discussion r elated to and der iv ation of X 2 I I I are as in the RL cas e ; ho w ever, the v a riance and co v ariance terms (hence the asymptotic distributio n) are conditional o n Q a nd R . Replacing Q and R with their empirica l estimates, I o bt ain the QR- adjusted version of this test which is denoted by X 2 I I I ,q r . R emark 2.1 . Extensio n to Multi-Class Case: So far, I ha ve describ ed the se gregation tests for the two class cas e in which the co rresponding NNCT is o f dimens io n 2 × 2. The cell count s for the diag onal cells hav e asymptotic nor ma lit y . F or the off-diagonal cells, although the a symptotic normality is supp orted by Mo n te Carlo simulation results (Dixon (2 002)), it is not rig o rously pr o ven yet. Nevertheless, if the a symptotic normality held for a ll q 2 cell co un ts in the NNCT, under RL, Dixon’s test and version II w ould have χ 2 q ( q − 1) distribution, versions I and II I w o uld have χ 2 ( q − 1) 2 distribution asymptotically . Under CSR independence, these tests will hav e the corr esponding asymptotic distributions conditional on Q and R . The QR-a dj usted versions can b e obtained b y r eplacing Q and R with their empiric a l estimates. 3 Empirical Significance Lev els of NNCT-T ests under the CSR Indep endence F or the n ull case, H o : CSR ind ep e ndenc e , I sim ulate the CSR case only with classes 1 and 2 (i.e., X and Y ) of sizes n 1 and n 2 , respe ctiv ely . At each of N mc = 10 000 replicates, I generate data for s ome sample size combinations of n 1 , n 2 ∈ { 10 , 30 , 50 , 100 } p oin ts iid from U ((0 , 1) × (0 , 1)). These sample size combinations are chosen so that one can examine the influence of small and la rge samples, and the relative abundance o f the classes on the tests. The cor r esponding tes t statistics are recorded at eac h Monte Ca rlo replication for eac h sample size co m bination. Then I rec ord how many times the p -v alue is at o r b elo w α = . 0 5 for eac h test to estimate the empiric al size. I pr e s en t the empir ical sizes for NNCT-tests in T able 2, where b α D is the empirica l significance level for Dixon’s test, b α I , b α I I and b α I I I are for versions I, I I, and I II, r espectively , and b α D,q r , b α I ,q r , b α I I ,q r and b α I I I ,q r are for the c o rrespo nding Q R-adjusted v er s ions. The empirical sizes sig nifican tly smaller (larger) than .05 are ma r k ed with c ( ℓ ), which indicate that the corr esponding test is c o nserv a tiv e (liber al). The asymptotic normal appr o ximatio n to prop ortions is used in determining the significance o f the deviations of the empirical size estimates from the nominal level of .05. F o r these prop ortion tests, I also use 7 α = . 0 5 to test ag ainst empirical size b eing equal to .05. With N mc = 10000 , empirical sizes less ( greater ) than .0464 (.0536) are deemed conserv ative (lib eral) at α = . 0 5 level. Observe that the (unadjusted) NNCT-tests are ab out the des ired level (or siz e ) when n 1 and n 2 are b oth ≥ 3 0 , and mostly conserv ative o therwise. The same tr e nd holds for the Q R-adjusted versions. F urther mo re, comparing the empirical sizes of QR-adjusted v ers io ns with those o f unadjusted ones, I see tha t for a lmost all cases they are not significantly different (a t α = . 05 base d on tests on equality of the pro portions). Empirical significance levels of the NNCT-tests conditional (i.e., unadjusted) unconditional (i.e., QR-a djusted) ( n 1 , n 2 ) b α D b α I b α I I b α I I I b α D,q r b α I ,q r b α I I ,q r b α I I I ,q r (10,10) .0432 c .0593 ℓ .0461 c .0439 c .0470 .0595 ℓ .0486 .0365 c,< (10,30) .0440 c .0451 c .0421 c .0410 c .0411 c .0465 .0381 c .0461 c,> (10,50) .0482 .0335 c .0423 c .0397 c .0497 .0345 c .0411 c .0431 c (30,10) .0390 c .0411 c .0383 c .0391 c .0402 c .0423 c .0379 c .0436 c (30,30) .0464 .0544 ℓ .0476 .0427 c .0492 .0552 ℓ .0478 .0409 c (30,50) .0454 c .0507 .0481 .0504 .0411 c .0517 .0464 .0515 (50,10) .0529 .0326 c .0468 .0379 c .0510 .0334 c .0428 c .0402 c (50,30) .0429 c .0494 .0468 .0 469 .0405 c .0518 .0466 .0492 (50,50) .0508 .0 494 .0497 .0499 .0528 .0494 .05 24 .0488 (50,100 ) .0560 ℓ .0501 .0564 ℓ .0516 .0556 ℓ .0493 .0573 .0494 (100,50 ) .04 8 3 .0 463 c .0492 .0479 .0495 .0 457 .0501 .04 60 (100,10 0) .0504 .0524 .0519 .0 489 .0513 .0524 .0523 .0463 c T able 2: The empirical significance levels for Dixon’s, and the new versions of the NNCT-tests by (Ceyhan (2007)) as well as their Q R-adjusted versions ba s ed on 10 0 00 Mont e Carlo simulations of CSR indep endence pattern. b α D stands for the empirical significance level fo r Dixon’s test, b α I , b α I I and b α I I I for v er sions I, II, and I II, resp ectively; and b α D,q r , b α I ,q r , b α I I ,q r and b α I I I ,q r stand for the co rrespo nding QR-adjusted v ersions. ( c ( ℓ ): the empirical size is significa n tly smaller (lar ger) than .05 ; i.e., the test is conserv a tiv e (liber al). < ( > ): the empirical size of QR-adjusted version is s ig nifican tly smaller (larger) than that of unadjusted version.) 4 Empirical P o w er An al ysis T o ev aluate the p ow er p erformance of the QR-adjusted and unadjusted NNCT-tests, I o nly consider alter- natives against the CSR pattern. That is, the points a re generated in s uch a w ay that they are from an inhomogeneous P oisson pr o cess in a region of interest (unit square in the simulations) for at lea st one cla ss. F urthermore , the tests cons idered in this article seem to hav e the desired no minal level for large samples under CSR, and QR-a djustm ent is not necessa ry under the RL patter n. Hence I av oid the a lternativ es against the RL pattern; i.e., I do not consider non-r andom labeling of a fixed set of p oin ts that would result in segreg ation o r ass ociation. 4.1 Empirical Po w er Analysis under Segregation Alternativ es F or the segreg ation alternatives (aga ins t the CSR pattern), three cases are considered. I generate X i iid ∼ U ((0 , 1 − s ) × (0 , 1 − s )) for i = 1 , 2 , . . . , n 1 and Y j iid ∼ U (( s, 1) × ( s, 1)) for j = 1 , 2 , . . . , n 2 . In the pattern generated, appropriate choices of s will imply X i and Y j to b e mor e s egregated than ex pected under CSR. That is, it will be more lik ely to hav e ( X, X ) NN pairs tha n mixed NN pairs (i.e., ( X, Y ) or ( Y , X ) pairs). The three v alues of s I consider constitute the three segreg ation alternatives: H I S : s = 1 / 6 , H I I S : s = 1 / 4 , and H I I I S : s = 1 / 3 . (12) Observe that, from H I S to H I I I S (i.e., as s incr e ases), the segreg ation gets s tronger in the sens e that X and Y po in ts tend to form one-cla ss clumps o r clusters . By constr uction, the p oint s are uniformly generated, hence 8 exhibit homogeneity with resp ect to their supp o rts for each class, but with re s pect to the unit square these alternative patterns are ex amples of departures fr om first-order homog eneit y which implies seg regation of the classes X and Y . The simulated segregatio n patterns ar e symmetric in the sense that, X and Y class e s are equally segre g ated (o r clustered) fr o m each other . 0.0 0.2 0.4 0.6 0.8 1.0 0.0 0.2 0.4 0.6 0.8 1.0 A realization of H S I : s = 1/6 0.0 0.2 0.4 0.6 0.8 1.0 0.0 0.2 0.4 0.6 0.8 1.0 A realization of H S II : s = 1/4 0.0 0.2 0.4 0.6 0.8 1.0 0.0 0.2 0.4 0.6 0.8 1.0 A realization of H S III : s = 1/3 Figure 2: T hr ee realizations for H I S : s = 1 / 6, H I I S : s = 1 / 4, and H I I I S : s = 1 / 3 with n 1 = 1 00 X p oin ts (solid squares ) and n 2 = 100 Y p o in ts (triangles △ ). The pow e r estimates against the s ample size com binations are pr esen ted in Figure 3, where b β D is for Dixon’s test, b β I , b β I I , and b β I I I are for versions I, I I , and I II, resp ectiv ely , and the QR-a djusted v e r sions are indicated by q r in their subscripts. Observe that, as n = ( n 1 + n 2 ) gets larg er, the pow er estimates g et larger . F or the same n = ( n 1 + n 2 ) v a lues, the p ow er estimate is lar g er for classes with s imilar sample sizes. F urthermore , as the segreg ation gets stronger , the power estimates get larg er. The NNCT-tests hav e ab out the s ame pow er p erformance under these segreg a tion a lternativ es . Notice a lso that for small sa mples the power estimates of the QR-adjusted versions a r e slightly larger bu t for other sample size combinations the power estimates for the QR-a djusted versions a nd the unadjusted versions are virtually indistinguishable. 4.2 Empirical Po w er Analysis under Asso ciation A lt erna tiv es F or the asso ciation alternatives (aga inst the CSR pattern), I also consider three cases . First, I g enerate X i iid ∼ U ((0 , 1) × (0 , 1)) for i = 1 , 2 , . . . , n 1 . Then I generate Y j for j = 1 , 2 , . . . , n 2 as follows. F or each j , I pick a n i ra ndomly , then generate Y j as X i + R j (cos T j , sin T j ) ′ where R j iid ∼ U (0 , r ) with r ∈ (0 , 1) and T j iid ∼ U (0 , 2 π ). In the pattern ge nerated, appropr iate choices of r will imply Y j and X i are mor e asso ciated than exp ected. That is, it will be mor e likely to ha ve ( X, Y ) NN pairs than self NN pairs (i.e., ( X, X ) or ( Y , Y )). The three v alues of r I consider constitute the three asso ciation a lternativ es: H I A : r = 1 / 4 , H I I A : r = 1 / 7 , and H I I I A : r = 1 / 1 0 . (13) 9 2 4 6 8 10 12 0.0 0.2 0.4 0.6 0.8 1.0 H S empirical power H S I H S II H S III β ^ D β ^ D,qr 2 4 6 8 10 12 0.0 0.2 0.4 0.6 0.8 1.0 H S empirical power H S I H S II H S III β ^ I β ^ I,qr 2 4 6 8 10 12 0.0 0.2 0.4 0.6 0.8 1.0 H S empirical power H S I H S II H S III β ^ II β ^ II,qr 2 4 6 8 10 12 0.0 0.2 0.4 0.6 0.8 1.0 H S empirical power H S I H S II H S III β ^ III β ^ III,qr Figure 3: E mpirical p o wer estimates for the QR-adjusted and unadjusted NNCT-tests based on 10 000 Mon te Carlo replicatio ns under the s e g regation alternativ es. The n um ber s in the horizontal axis labels r epresen t sample (i.e., class) size combinations: 1= (10,10), 2=(10,30), 3=(10,50 ), 4=(30,10), 5=(30,30 ), 6=(30,50), 7=(50,1 0), 8= (50,30), 9= (50,50), 10=(50 ,100), 11=(10 0 ,50), 12=(100 ,100). 10 Observe that, from H I A to H I I I A (i.e., as r decreases ), the ass o ciation gets stronger in the sense tha t X and Y po in ts tend to o ccur together more and more freq uen tly . By co nstruction, X p oint s are fr o m a homogeneo us Poisson pro cess wit h respec t to the unit squa re, while Y points exhibit inhomogeneity in the same re g ion. F urthermore , these alternative patterns are examples of departures fro m second-or de r homogeneity which implies asso ciation o f the class Y with class X . 0.0 0.2 0.4 0.6 0.8 1.0 0.0 0.2 0.4 0.6 0.8 1.0 A realization of H A I : r = 1/4 0.0 0.2 0.4 0.6 0.8 1.0 0.0 0.2 0.4 0.6 0.8 1.0 A realization of H A II : r = 1/7 0.0 0.2 0.4 0.6 0.8 1.0 0.0 0.2 0.4 0.6 0.8 1.0 A realization of H A III : r = 1/10 Figure 4: Three realizations for H I A : r = 1 / 4, H I I A : s = 1 / 7, and H I I I A : r = 1 / 10 with n 1 = 20 X p oin ts (solid squares ) and n 2 = 100 Y p o in ts (triangles △ ). The p ower estimates under the a s sociation alterna tiv es ar e pr e sen ted in Fig ure 5, wher e labeling is as in Figure 3. Observe that, for similar sa mple sizes as n = ( n 1 + n 2 ) g ets larger, the power estimates get larger at ea c h asso ciation alterna tive. F urthermore, as the a ssociatio n gets s tronger, the p o wer estimates g et larger at ea c h sample size combination. The NNCT-tests hav e about the same power estimates under thes e asso ciation alter nativ es. F ur thermore the QR-adjusted v er sions of the tests virtually ha ve the same p o w er estimates as the unadjusted versions; for the smaller samples QR- adjusted version has sligh tly lower p o w er estimates. R emark 4.1 . M ain R esult of M on te Carlo Simulation Analysis: Based on the simulation results under CSR indep endence of the po ints, I observe that none of the NNCT-tests I consider has the desired level when at least one sample size is small so that the cell count(s) in the co rrespo nding NNCT have a high proba bility of b eing ≤ 5. This usually c orrespo nds to the case that at least one sample size is ≤ 10 or the sample sizes a re very different in the simulation study . When sample sizes are small (hence the corresp onding cell counts are ≤ 5), the asymptotic approximation of the NNCT-tests is not appropr iate. So Dixon (1 994) recommends Monte Carlo randomiza tion for his test when some cell coun t(s) a r e ≤ 5 in a NNCT. I e xtend this rec o mmendation for a ll the NNCT-tests discuss ed in this article. F urthermore, amo ng the NNCT-tests, Dixon’s a nd v er sion II I tests seem to be affected b y the QR-adjustment more than the o ther tests in terms o f empirical size. But QR-adjustment doe s not nece s sarily improv e the results of the NNCT-analysis under CSR independenc e , as t he empirica l sizes of the adjusted and unadjusted v ersions a re not significantly different. F urthermore , the QR-adjustmen t do es not significantly impro ve the pow er per formance under segregation and asso ciation alterna tiv es. In fact the pow er estimates of Q R-adjusted and unadjusted tests were about the same under these alternatives. 11 2 4 6 8 10 12 0.0 0.2 0.4 0.6 0.8 1.0 H A empirical power H A I H A II H A III β ^ D β ^ D,qr 2 4 6 8 10 12 0.0 0.2 0.4 0.6 0.8 1.0 H A empirical power H A I H A II H A III β ^ I β ^ I,qr 2 4 6 8 10 12 0.0 0.2 0.4 0.6 0.8 1.0 H A empirical power H A I H A II H A III β ^ II β ^ II,qr 2 4 6 8 10 12 0.0 0.2 0.4 0.6 0.8 1.0 H A empirical power H A I H A II H A III β ^ III β ^ III,qr Figure 5 : Empirical power estimates for the QR-adjusted and unadjusted NNCT-tests under the asso ci- ation alternatives. The num b ers in the horiz o n tal axis lab els represent sa mple (i.e., c la ss) s ize co m bina- tions: 1=(10 ,1 0), 2 =(10,30), 3=(10 ,50), 4=(30,10 ), 5=(30,30), 6=(30,50 ), 7= (50,10), 8=(50,3 0), 9 = (50,50), 10=(50 ,100), 11=(100 ,50), 12 =(100,100). 12 5 Examples I illustra te the tests o n tw o examples: an ecolo gical data set, namely swamp tree data (Go od a nd Whipple (1982)), and an artificial data set. 5.1 Sw amp T ree Data Go od and Whipple (1982) considered the spa tia l patterns of tree sp ecies along the Sav a nnah River, South Carolina, U .S.A. F rom this data, Dixon (2002) used a single 50 m × 200m rectangula r plot to illus tr ate his tests. All live or dead trees with 4.5 cm or more dbh (diameter a t breast heig ht) were recorded tog ether with their spec ie s. Hence it is an e x ample o f a realization of a marked m ulti-v a riate point pattern. The plo t contains 13 different tree sp ecies, fo ur o f whic h comprise over 9 0 % of the 734 tree stems. The rema ining tr ee stems were catego r ized a s “ other trees”. T he plot co nsists o f 215 water tupelo ( Nyssa aquatic a ), 205 blac k gum ( Nyssa sylvatic a ), 156 Carolina ash ( F r axinus c ar oliniana ), 98 bald cypres s ( T axo dium distichum ), and 60 stems of 8 additio nal sp ecies (i.e., other s pecies). I will only consider liv e trees from the tw o mo st freq ue nt tree sp ecies in this data set (i.e., w a ter tupelos and black g ums). So a 2 × 2 NNCT-analys is is conducted for this data set. If segr egation among the less frequent species w ere impor tan t, a mor e detailed 5 × 5 or a 12 × 12 NNCT-analysis should be p erformed. The lo cations of these trees in the study reg ion a re plotted in Figure 6 and the co rrespo nding 2 × 2 NNCT together with per cen tages bas e d on row a nd gr and sums ar e pr o vided in T able 3. F o r exa mple, f or water tup elo as the base sp ecies and black gum as the NN sp ecies, the cell count is 54 which is 26 % of the 211 black g ums (whic h is 5 4 % o f all 3 94 trees). O bserv e t hat the p ercent ages and Figur e 6 are sug gestiv e of segrega tion for all three tree spe c ies since the observed p ercentages of sp e c ies with themselves as the NN are muc h large r than the row p ercentages. 0 50 100 150 200 0 10 20 30 40 50 Swamp Tree Data x coordinate (m) y coordinate (m) Figure 6: The scatter plot o f the lo cations of w a ter tup elos (circles ◦ ) and black gums (triang les △ ). NN spec ie s W.T. B.G. sum W.T. 157 (74 %) 54 (26 %) 211 (54 %) base sp ecies B.G. 52 (28 %) 131 (72 %) 183 (46 %) sum 209 (53 %) 185 (47 %) 394 (100 %) T able 3: The NNCT for swamp tree data and the corresp onding p ercentages (in pa r en theses), wher e the cell p ercent ages ar e with resp ect to the row sums and margina l p ercentages are with resp ect to the total size. W.T. = water tupe lo s and B.G. = blac k gums. The lo cations of the tree sp ecies ca n be view ed a priori resulting from different pro cesses so the more appropria te null hypothesis is the CSR indep endence pa tt ern. Hence our inference will be a conditional one (see Section 2.3) if I use the o bs erv ed v alues of Q and R . I observe Q = 270 and R = 236 for this data 13 set, and the empirical estimates for these sample s izes are Q = 249 . 68 and R = 24 4 . 95. I present the tests statistics and the asso ciated p -v alues for NNCT-tests in T able 4. Obser v e that the test statistics a ll decreas e with the Q R-adjustmen t, howev er this decr ease is not substan tial to alter the conclusions. Base d on the NNCT-tests, I find that the s egregation betw een b oth sp ecies is significant, since a ll the tests co nsidered yield significant p -v alues, and the diag onal cells (i.e., cells (1 , 1) and (2 , 2 )) ar e larger than exp ected. NNCT-test statistics and the asso ciated p -v alues for swamp tree data C X 2 I X 2 I I X 2 I I I 52.72 52.08 52.14 52.66 ( < . 00 01) ( < . 00 01) ( < . 00 01) ( < . 0001) C qr X 2 I ,q r X 2 I I ,q r X 2 I I I ,q r 51.98 51.35 51.41 51.92 ( < . 00 01) ( < . 00 01) ( < . 00 01) ( < . 0001) T able 4: T est sta tistics and the a ssociated p -v alues (in pa ren theses) for NNCT-tests for the swamp tree data set. C stands for Dixo n’s ov era ll test, X 2 I , X 2 I I , and X 2 I I I stand for v ersions I, I I, and I II of the tes ts by Ceyhan (2007). C qr , X 2 I ,q r , X 2 I I ,q r , and X 2 I I I ,q r are the QR-adjusted versions o f these tests. 5.2 Artificial Data Set In the sw a mp tree example, although the test statistics for unadjusted and QR-adjusted versions ar e different for Pielo u’s and Dixon’s tests and p -v alues for QR-adjusted v ersions are larger than unadjusted ones, I hav e the same conclusion: ther e is strong evidence for segregation of tree s pecies. B elo w, I present an artificia l example, a random s ample of s ize 100 (with 50 X -p oin ts and 50 Y -p oin ts uniformly generated o n the unit square). The q ue s tion of in teres t is the spatial interaction betw ee n X and Y c la sses. I plot the lo cations of the p oin ts in Figur e 7 a nd the corresp onding NNCT to gether with percentages ar e provided in T a ble 6. Observe that the p ercent ages are s uggestiv e of mild seg regation, with equa l degree for bo th clas ses. 0.0 0.2 0.4 0.6 0.8 1.0 0.0 0.2 0.4 0.6 0.8 1.0 Artificial Data x coordinate y coordinate Figure 7: The s catter plot of the loca tions of X (cir cles ◦ ) and Y p oin ts (triangles △ ) in the a rtificial data set. The data is generated to resemble the CSR indep endence pa ttern, so I a ssume the n ull pattern is CSR independenc e , which implies that our inference will be a conditional one if I use the observed v a lues of Q and R . I observe Q = 7 0 and R = 60 for this data s et, and the empirical estimates for these s ample siz es are Q = 63 . 37 a nd R = 6 2 . 17. I present the tests statistics and the ass ociated p -v a lues for NNCT-tests in 14 NN class X Y sum X 3 0 (60 %) 20 (40 %) 50 (50 %) base class Y 19 (38 %) 31 (62 %) 50 (50 %) sum 49 (49 %) 51 (51 %) 1 00 (10 0 %) T able 5: The NN CT f or the artificia l data and the corresp onding per cen tages (in pare ntheses), wher e the cell p ercent ages ar e with resp ect to the row sums and margina l p ercentages are with resp ect to the total size. T able 6. O bserv e th at the test statistics all decrease with the QR-a dju stment , how e v er this dec r ease is not substantial to alter the conclusions. Based on the NN CT-tests, I find that the spatial in teraction betw een X and Y is not sig nifican tly differen t from CSR independence. In both examples although QR-adjustment did not change the conclusions, it migh t make a difference if the pattern is a c lose call b et ween CSR indep endence and segrega tion/asso ciation. That is, if a segregation test has a p - v alue a bout .05, after the QR- adjustmen t, it might get to be significant or insignificant, dep ending on the case. NNCT-test statistics and the asso ciated p -v alues for the artificial data C X 2 I X 2 I I X 2 I I I 3.36 3.02 3.07 3.30 (.1868) (.0825 ) (.2152) (.0693 ) C qr X 2 I ,q r X 2 I I ,q r X 2 I I I ,q r 3.32 2.97 3.04 3.25 (.1906) (.0846 ) (.2192) (.0713 ) T able 6: T est s tatistics and the asso ciated p -v alues (in parentheses) for NNCT-tests for the ar tificial data set. The notation for the tests is as in 4. 6 Discussion and Conclusions In this a rticle, I discus s the effect of QR-a dj ustmen t on segr egation o r clustering tests base d o n nearest neighbor contingency tables (NNCTs). These tests include Dixon’s overall tes t (Dixon (199 4)), and the three new ov e rall seg regation tests in tr oduced b y (Ceyhan (200 7)). QR-adjustment is perfo r med o n thes e tests bas ed on NNCTs (i.e., NNCT-tests) when the null case is the CSR of t wo classes of points (i.e., CSR independenc e ), since under CSR independence, the NNCT-tests depe nd on num b er o f reflexive NNs (denoted by R ) and the num ber of shar ed NNs (denoted by Q ), b oth of whic h depe nd on the allo cation of the points. When the observed v alues of Q and R a re used, the NNCT-tests are conditional tests, which mig h t bias the results of the analy sis. Given the difficult y in calculating the e x pected v alues of Q and R under CSR independenc e , I estimate them empirically based o n extensive Monte Carlo sim ulations, a nd substitute these estimates for exp e cted v alues of Q and R (which is calle d the QR- a djustmen t in this article). I compare the empirica l sizes and p ow er estimates of the NNCT-tests with extensive Monte Car lo simu- lations. B ased on the Monte Carlo analysis, I find that QR-adjustment do es not a ffect the empirical s iz es o f the tests. Mo reo ver, Q R-adjustmen t does not ha ve a s ubstan tial influence o n these NNCT-tests under the segrega tion o r asso ciation alter nativ es. Thus, o ne can use the QR-adjusted o r the una dju sted versions of the NNCT-tests. 15 References Ceyhan, E. (2006). On the us e of nearest neighbor contingency tables for testing spatia l segreg ation. A c c epte d for p ublic ation in Envir onmental and Ec olo gic al Statistics. Ceyhan, E. (2007 ). New tests for spatial segre gation bas ed on nearest neighbor con tingency tables. Under r eview. Cuzick, J. a nd Edwards, R. (19 90). Spatial clustering for inho mogeneous po pulations (with discussion). Journal of the Ro yal Statistic al So ciety, Series B , 52:73–1 04. Diggle, P . J. (2003 ). St atist i c al Analysis of Sp atial Po int Pa t terns . Ho dder Arnold P ublishers, Lo ndon. Dixon, P . M. (199 4). T esting spatia l segrega tion using a nea rest-neigh bo r contingency table . Ec olo gy , 75(7):194 0–1948. Dixon, P . M. (20 02). Nearest-neig h b or co n tingency table analysis of spatial segre g ation for several sp ecies. Ec oscienc e , 9(2):14 2 –151. Go od, B. J. and Whipple, S. A. (19 82). T ree spatial patterns: South Car olina bottomland and swamp forests. Bul letin o f the T orr ey Botanic al Club , 10 9:529–536 . Goreaud, F. and P´ e lis sier, R. (2003). Av oiding misinterpretation of biotic in teractions with the intert yp e K 12 -function: p opulation ind ep e ndenc e vs. random labelling hypotheses. Journal of V e getation Scienc e , 14(5):681 –692. Hamill, D. M. and W r igh t, S. J. (1986 ). T esting the disp ersion of juveniles rela tiv e to adults: A new ana ly tical metho d. Ec olo gy , 67 (2):952–957. Herler, J. and Patzner, R. A. (2005). Spatial segregatio n of tw o common Gobius sp ecies (Teleostei: Go biidae) in the Northern Adriatic Sea. Marine Ec olo gy , 26(2):121–1 29. Kulldorff, M. (2006). T ests for spa tial randomness adjusted for an inho mogeneit y: A g eneral framework. Journal of the Americ an S tatistic al Asso ciation , 101(47 5):1289–130 5 . Meagher, T. R. and Bur dic k, D. S. (19 80). The use o f near e st neighbor frequency a nalysis in studies of asso ciation. Ec olo gy , 61 (5):1253–125 5. Moran, P . A. P . (1948). The interpretation o f s tatistical maps. J o urnal of the Roy al Statistic al So ciety, Series B , 1 0:243–251 . Nanami, S. H., Kaw a guc hi, H., and Y amakura, T. (1999). Dio ecy-induced spatial patterns of tw o co dominan t tree spe c ies, Po do c arpus nagi a nd Ne olitse a aciculata . Journ al of Ec olo gy , 87(4 ):678–687. Orton, C. R. (1982 ). Sto c hastic pro cess a nd archeologica l mechanism in spatial analysis. Journal of Ar che- olo gic al Scienc e , 9 :1–23. Pielou, E. C. ( 1961). Segreg ation and symmetry in t wo-sp e cies po pulations as studied b y nearest-neighbor relationships. Journal o f Ec olo gy , 4 9 (2):255–269. Ripley , B. D. (200 4). Sp at ial Statistics . Wiley-Interscience, New Y ork. Searle, S. R. (2006). Matrix Algebr a U sef ul f or Statistics . Wiley-Intersciences. W aller, L. A. and Gotw ay , C . A. (200 4). Applie d Sp atial Statistics for Public He alth Data . Wiley-In terscience, NJ. Whipple, S. A. (19 8 0). Population disper sion patterns of trees in a Southern Louisiana ha rdw o o d forest. Bul letin o f the T orr ey Botanic al Club , 10 7:71–76. 16
Original Paper
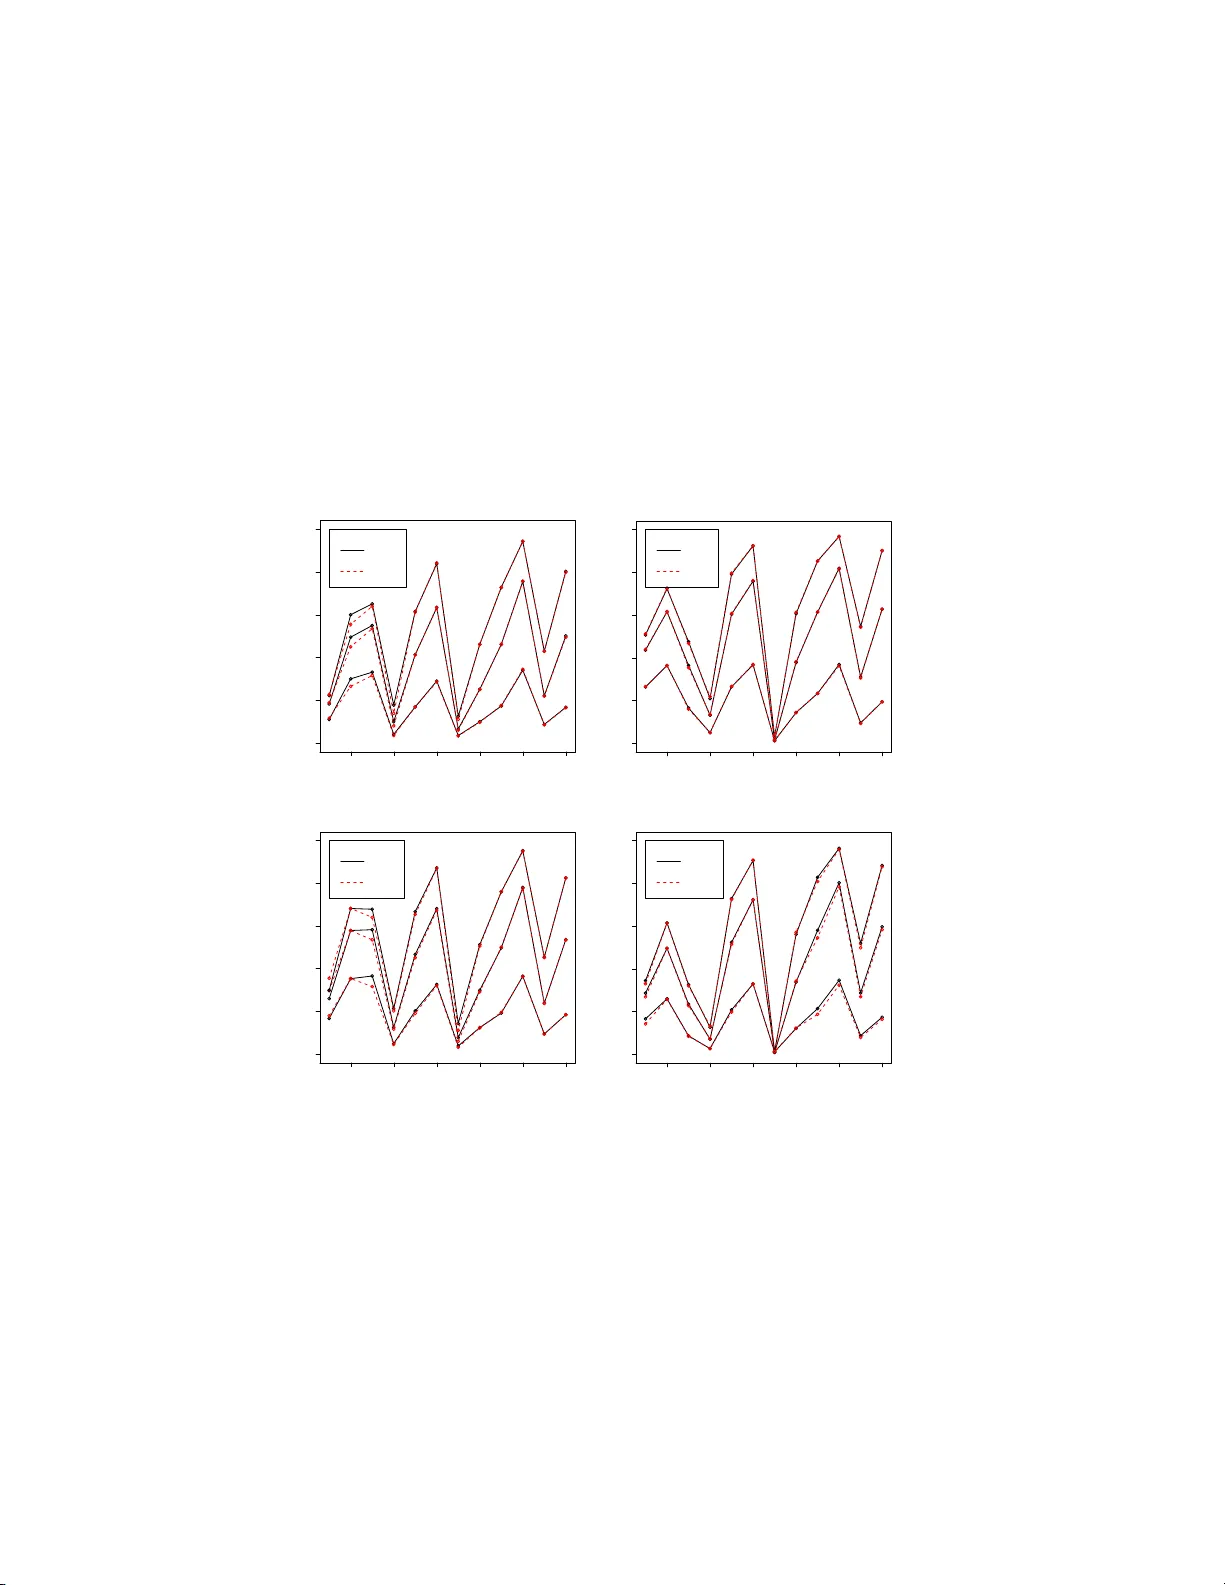
Loading high-quality paper...
Comments & Academic Discussion
Loading comments...
Leave a Comment