On Affinity Measures for Artificial Immune System Movie Recommenders
We combine Artificial Immune Systems 'AIS', technology with Collaborative Filtering 'CF' and use it to build a movie recommendation system. We already know that Artificial Immune Systems work well as movie recommenders from previous work by Cayzer an…
Authors: Uwe Aickelin, Qi Chen
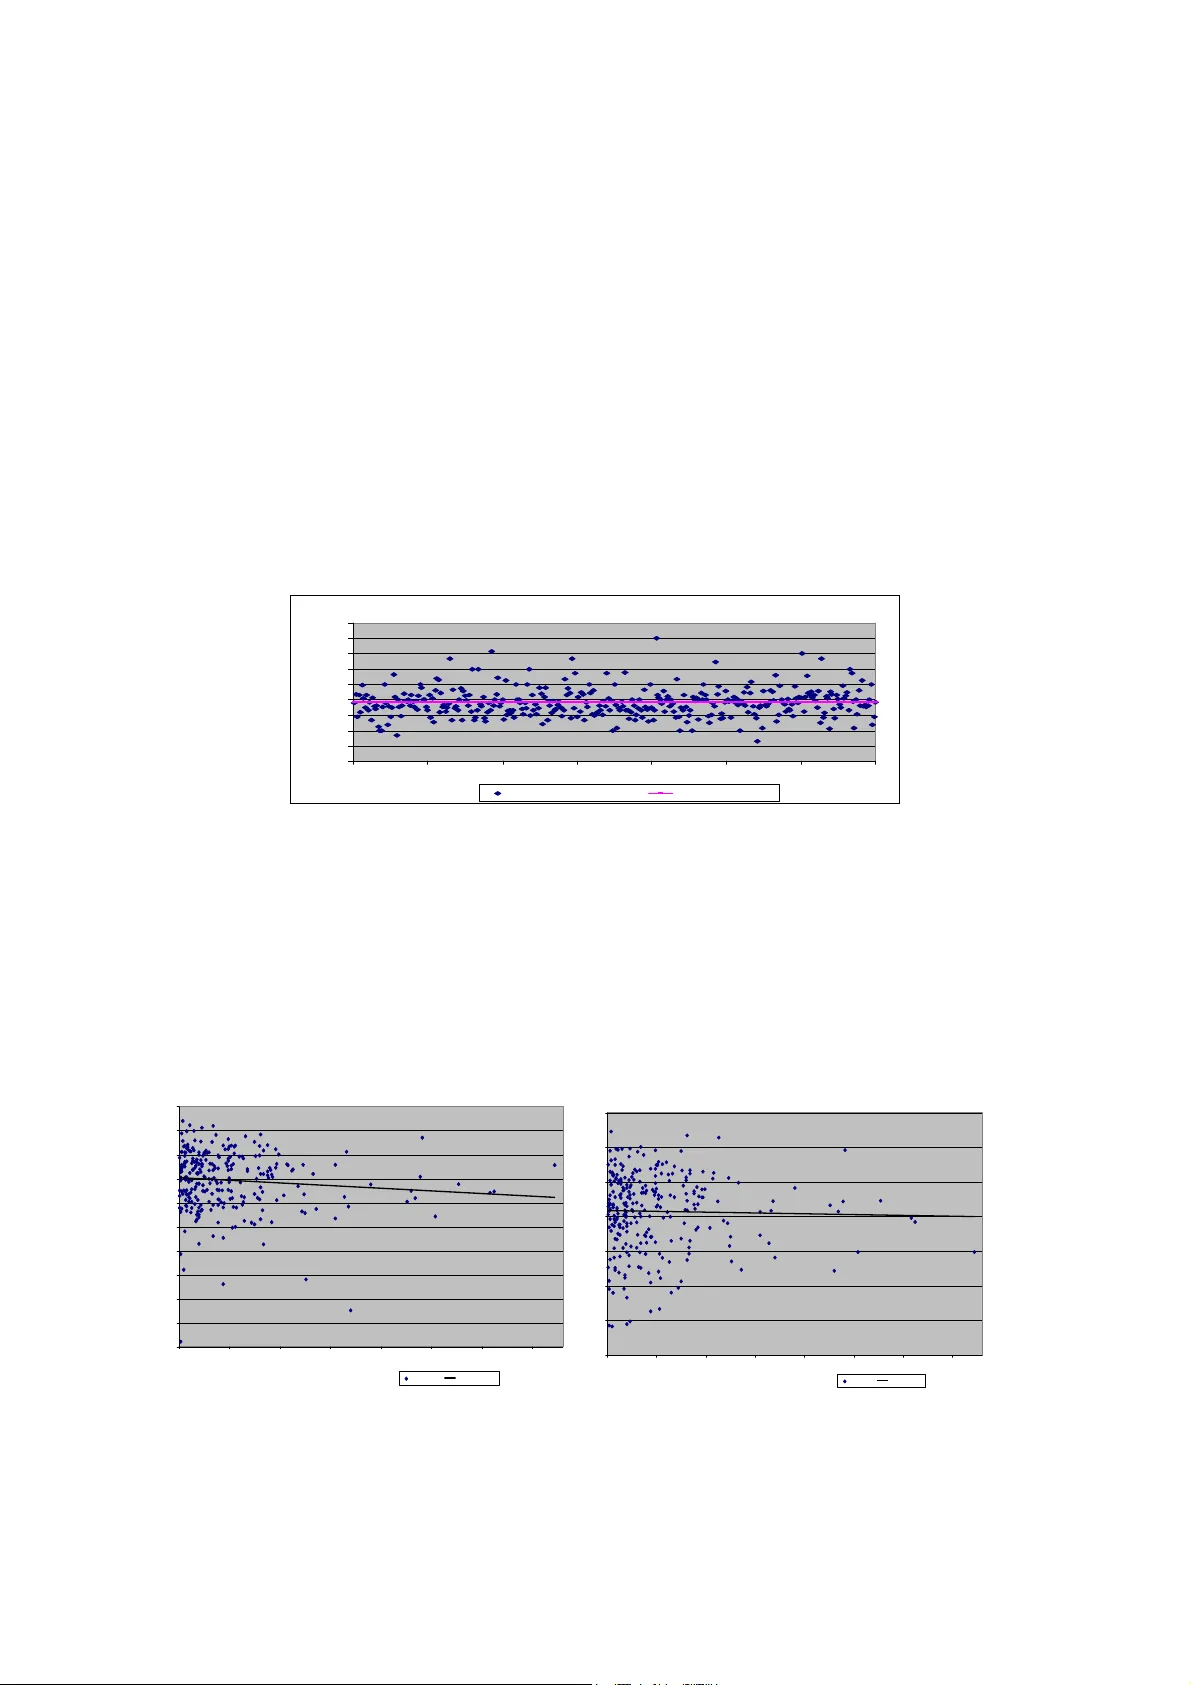
On Affinity M easures for Artificial Immune Syste m Mo vie Recommenders Proceedings RASC -2004, The 5th International C onference on: Rec ent Advances in Soft Computing, Nottingham, UK, 2004. Uwe Aickelin and Q i Chen, School of Computer Sci ence and IT, University of Nottingham , NG8 1BB, UK {uxa, qxc}@cs.nott.ac.uk , Abstract . We combine Artificial Immune Systems (AIS) technology with Collabor ative Filtering (CF) and use it to build a movie recommendation system. We already know t hat Artificial Immune Systems work well as movie recom menders from previous wo rk by Cayzer and Aickelin ([3], [4] , [ 5]). Here our aim is to inv estigate the effe ct of different affinity measure algorithms f or the AIS. Two different affinity measures, Kendal l’s Tau and Weighted K appa, are used to calculate the co rrelation coefficients for the movie recommender. We compare the results with those published previously and show that that Weighted Kappa is more suitable t han others for movie problems. We also show that AIS are generally robu st movie recommenders and that, as l ong as a suitable affinity measure is chosen, results are good. Keywords: Artificial Imm une System, Recomm endation System, Af finity Measure, Correlation. 1 Intr oduction Cayzer and Aickelin have previously shown that Artificial Imm une System (AIS) perform well as movie r ecomm endation tools([3], [4],[5]). Their research also provided som e insight into how certain parameters, such as overlap or the neighbourhood size, influence the AI S r esults. In this paper we intend to extend their work by focusing on a yet uncovered issue, the ch oice of the affinity measure. We will sh ow how the choice of affinity measure will influe nce the AIS results, and tr y to answer the more general question i f there is such a thing as a ‘best’ affinity measure for the movie recomm endation problem. We use Collaborative Filt ering (CF) technology [2] and an AIS [7] to create mov ie recommendations in our project. CF works by offer ing the t arget user recommendations based on ot her users who have similar preferences [2]. It of fers the user recomm endations even though specific information regarding the movie is unknown. A group of users, known as a neighbourhood, who have similar preferences to the target user, determine the recommendations. In t his project, we use an A IS to choose the members of the neighbourhood. Two affinity measure algorithm s, Wei ghted Kappa and Kendall’s Tau, are adopted respectively to calculate the correlation coefficients between the users. We compare the results obtained from these systems to those obtained previously [5] and achieve an impressive improvement choosing the most suitable measure. The paper concludes with our ass essm ent of why certai n methods work better than others and a general re commendation as to which affi nity m easure is the most suitable. 2 AIS and Imm une Network Models AIS are distributed adap tive systems for problem solv ing using models and princi ples derived from the Human Immune S ystem [7]. T he Immune S ystem is the defence system of our body, which can produce and secrete antibodies used to protect us ag ainst infection through an antigen re cognition process ([8], [9], [13]). Many di fferent AIS al gorithm models ha ve been built, including bone marrow models, thym us models, clonal selection algor ithms and imm une network models [7]. In this project, we will use the immune network m odel suggested by Farmer et al [8] a nd modified and extended by Cayzer and Aickelin ([3], [ 4], [5]) a nd by Morrison and Aickelin [11]. In t his model, the interaction between antibodies and antibodies, and the interaction between the antibodies and antigens control the system , and maintain a distributed adap tive system with diversity. Farmer’s Immune Network Model is ba sed on matching, di versity, and distributed control ([5], [10]). Matching is the binding between t he antibodies and antigens. Diversity has the objective of achieving optimal antigen space coverage and is based on t he premise that antibodies can match other antibodies as well as antigens. Distributed control means that t here is no central control in the Immune Net work Model, as the model is controlled by local interactions between antibodies and antigens. The users in the database are viewed as candidate antibodies, and the target user who uses the mov ie recomm endation system is the antigen. Using statistical correlation methods we will calculate the correlations (also term ed affinities) between th e antigen- antibodies and antibodies- antibodies [5]. Briefly, the AI S model used in this project wo rks as follows: (1) Choose a fixed num ber (n=100) of antibodies as th e initial AIS . (2) Calculate the concentration of the antibodies in the AIS based on their affinity to the antigen and all the other antibodies. (3) Remove any ant ibodies with a concentration below a given threshold and randomly repl ace with new antibodies from the available pool. (4) Repeat (2) and (3) un til the mem bers of the AIS remain unchangeab le for ten iterations. (5) Generate recomm endations based on the fina l antibody population. In this model the most important aspect is the concentration, whi ch is calculated as below : i j i n j j i i i i x k x x m n k y x m k dt dx 3 1 , 2 1 − − = ∑ = (1) k 1 represents stimulation rate, k 2 represents suppression rate and k 3 represents death rate y represents the concen tration of the antig en (fixed in our m odel) x i represents the concen tration of antibody i x j represents the concen tration of antibody j m i,j represents the affinity b etween the antibody i and j m i represents the affinity be tween the antibody i and t he antigen n represents the num ber of antibodies in AI S In our system we fi x the parameters as k 1 =0.3 , k 2 = 0.2 , k 3 =0.1, based on Cayz er and Aickelin [3]. For one antibody, the concentration value i s proportional to a high antibody-antigen af finity, is decreased with a high antibody- antibody affinity. In the absence of either, the death rate is use d to slowly decrease an antibody’s concentration. Next we w ill describe the af finity measure algorithm s we use. 3 T wo Affinity Measu re Algorithm s We use t wo different algorithm s, We ighted Kappa (WK) [1] and K endall’s Tau (KT) [12], to calculate the affinity (correlation co efficient). The exam ples below explain how W K and KT work. For the examples we select two users from the database. User1 made 50 r atings and User2 made 54 ratings, but we only consider the ratings f or the common movies, i.e. those that they both r ated. The user e ncoding inc ludes a mov ie_id, taken from movie’s i d in the database, and a rating_score s tating how the user feels about the mov ie. The scale as which t he movies are rated is as follows: 0, 0.2, 0.4, 0.6, 0.8, 1; where 0 is very bad, 0.2 is bad, 0.4 is below average, 0.6 is above average, 0.8 is good, and 1 is very good. The two users’ encoding s are shown below: Gen eric: {(movie_id, ra ting_score)} User1: {(153, 0.6), (253, 0. 6), (296, 1), (349, 0.8), ( 355, 0.4), (457, 1), (553,1 ), (595,1)} User2: {(153, 0.8), (253, 0. 8), (296, 0.4), (349, 0.8), (355, 0), (457, 0.8), (553, 0.6), (595, 0.8)} 3.1 Weighted Kappa (WK) Before we use the WK Alg orithm to ca lculate the affinity of the two users mentioned a bove, we note that User1 and User2 have eight movies in common, thus the observation number is 8. We use Table 1 below to summ arise the user information. Table 1. Frequencies (f ij ) Table for Example 1: User2 User1 Very Bad (1 ) Bad (2) Below Average (3) Above Average (4) Good (5) Very Good (7) Total Very Ba d (1) 0 (f 11 ) 0 (f 12 ) 0 (f 13 ) 0 (f 14 ) 0 (f 15 ) 0 (f 16 ) 0 Bad (2 ) 0 (f 21 ) 0 (f 22 ) 0 (f 23 ) 0 (f 24 ) 0 (f 25 ) 0 (f 26 ) 0 Below Av erage (3) 1 (f 31 ) 0 (f 32 ) 0 (f 33 ) 0 (f 34 ) 0 (f 35 ) 0 (f 36 ) 1 Above Av erage (4) 0 (f 41 ) 0 (f 42 ) 0 (f 43 ) 0 (f 44 ) 2 (f 45 ) 0 (f 46 ) 2 Good (5) 0 (f 51 ) 0 (f 52 ) 0 (f 53 ) 0 (f 54 ) 1 (f 55 ) 0 (f 56 ) 1 Very Good ( 6) 0 (f 61 ) 0 (f 62 ) 1 (f 63 ) 1 (f 64 ) 2 (f 65 ) 0 (f 66 ) 4 Total 1 0 1 1 5 0 8 f ij (frequency in r ow i and column j in Table 1) is used to calculate the a ffinity of the two users. It represents how many movies user1 rated as categ ory i , and user 2 rated as category j , i , j ∈ {1,2,3,4,5,6}, where category 1= ‘Very Bad’, c ategory 2= ‘ Bad’, category 3=‘Below Average’, cate gory 4= ‘Above Average’, category 5= ‘Good’, category 6= ‘V ery Good’. We use Equation (2) , w hich rep resents the Weighted Kappa Algorithm , to calcula te the affinity (correlation coefficien t) from the observed and exp ected frequencies as: ) ( ) ( ) ( 1 w e w e w o p p p WK − − = (2) where WK represents the Weighted Kappa value (affinity); P o(w) r epresents t he obser ved frequencies and P e(w) represents the expected frequenc ies obtained by chance. In our system, al l users c ho ose the mov ies the y ha ve seen from the database and rate them . Hence, no frequencies exist by chance, and thus P e(w) =0 and WK = P o(w) . P o(w) can be calculated by Equat ion (3). ∑ ∑ = = = g i g j ij ij w o f w p n 1 1 ) ( 1 ( 3) where P o(w) repres ents t he observed frequencies; g represents the number of categories; n represents the number of observation s in g categories; f ij represents t he number of frequencies for the cell ( of Table 1) in r ow i , column j and w ij represents the weight value for the cell (of Table 1) in row i and column j. Here, the number of categories i s six, g = 6; the observation number n is t he num ber of movies that two users have in com mon; f ij can be acquired from Table 1. Finally, w ij can be obtained f rom Equation (4) [1]. The s maller t he difference between i and j , the greater t he weight as the two users have a stronger agreement on this movie and vice versa. When i = j , the weight will reach th e greatest value of 1 as the two users have the stronges t agreement: 1 1 − − − = g j i w ij ( 4) where w ij i s t he wei ght value for t he c ell of Table 1 in row i a nd column j ; hence i and j a lso respectively represent the rating category of User1 and User2 for the same m ovie. Using the above, we can calculate WK for Use r1 and User2 as: 0.725 2) 0.8 1 0.6 1 0.4 1 1 2 0.8 1 (0.6 8 1 ) 2 , 1 ( W = × + × + × + × + × + × × = user user K The WK correlation be tween User1 and User2 is: k (w) = P o(w) = 0.725 (i.e. good agr eement). 3.2 Kendall’s Tau method (KT) Central to KT is the notion of concordance and discordance. W e view pairs of observations ( X i , Y i ) and ( X j , Y j ) as c oncordant if X j -X i and Y j -Y i have t he same sign and as a discordant if X j -X i and Y j -Y i have opposite si gns. Let C represent the number of concordant and D represent the number of discordant pairs. KT is then as de fined in Equation (5). 1 1 , ) 1 ( 2 + ≤ ≤ − − = KT n n S KT (5) Where n represents observation num be r; S represents Kendall’s S, defined as S = C-D. For n observations, there are n(n-1)/2 pairs (1 ≤ i ≤ j ≤ n). If t hey are all concordant, KT is 1, if t hey a re all discordant KT is - 1. C is the number of concordant pa irs; D is the num ber of discordant pairs. Using the example of User1 a nd User2, the table below s hows all the concordant pai rs and discordant pairs of observations. We view zero and zero as a concordant p air. Zero and other non-zero numbers as neither discordant nor concordant and we i gnore them. Otherwise, the KT will differ depending on the order the values arr ive in. This would produ ce a distorted res ult. Table 2. Sample calcula tions of Kendall’s Tau (Movie-id, Movie- id) User1 User2 Decision (153, 253) 0.6-0.6 = 0 0.8-0.8 = 0 Concordant (153, 296) 0.6-1 = -0.4 0.8-0.4 = 0.4 Discordant (153, 349) 0.6-0.8 = -0.2 0.8-0.8 = 0 n/a (153, 355) 0.6-0.4 = 0.2 0.8-0 = 0.8 Concordant (153, 457) 0.6-1 = -0.4 0.8-0.8 = 0 n/a (153, 553) 0.6-1 = -0.4 0.8-0.6 = 0.2 Discordant (153, 595) 0.6-1 = -0.4 0.8-0.8 = 0 n/a If we calculate all values, we will find t hat there are 9 concordant pairs, 6 discordant pairs, thus C = 9, D = 6; S =9- 6=3; KT = (2*3)/8*(8-1) =0.1071 (i.e. s ome ag ree ment). 4 System Im plementation Following the algorithm ic outline given in section 2, we construct two m ovie recomm enders: One uses WK, the other KT as th e affinity algorithm of the AI S. After the AIS has chosen 100 users (antibodies), who have similar preferences to the user ( antigen) who requires recommendations, the CF algorithm uses Equa tion (6) below to calcul ate the predictions: ( ) ( ) ∑ ∑ = = × × = 100 1 i i 100 1 i i i 1 weight Rating weight prediction (6) Where weight i represents the concentration of the ith antibody and Rating i represents the rating, which the ith antibody gave the movie. We use the concentration as the weight t o calculate the prediction, as it contains both the correlation of the antibody to the antigen and the correlation of the antibody to the other antibodies. The data used in this project is publicly av ailable data, which is offered by Com paq Research (formerly DEC Research) [6]. It contains 2,811,983 ratings entered by 72,916 users for 1,628 different movies, and it has been used in numerous CF publications. We randomly chose 4,000 users whose user Ids are larger than 15,000 and who have rated more than 20 mov ies as candidate antibodies. W e use the users whose Per son Ids are sm aller than 15,00 0 as the test target user s or antigens. 5 Experimental Resu lts All experiments were executed on an Intel Pentium 4 CPU, 1.5G H z, 256MB R AM, W indows 2000 platform co mputer. T he system was code d using J ava 2 pla tform, Standard Edition (J2SE) 1.4.0. The database was implemented using Microsoft Access (XP Professional). Using the above experim ental environment, the execu tion time for one user to obtain recomm e ndations is several seconds. 5.1 Experiment 1 – Ties in KT The objective of t his experiment was to f ind out how much information we ignore when we use KT, because of the ties, and whether this seems r easonab le. In t his experiment we calculated the i gnored percentage of votes of 350 users, ra ndomly chosen from the database. Figure 1 shows that on average 38.27% of t he information was ignored. On s ome occasions, more than 50% of t he information was ignored. On average, t his represents a large amount of dat a and re sults might t herefore be a dversely affected when KT is used as an affinity m e asure. Pe rc en t of i gn or ed ze ro pair s 0 0.1 0.2 0.3 0.4 0.5 0.6 0.7 0.8 0.9 0 50 100 1 50 20 0 250 300 350 i g n o r e d z e r o p e r c e n t Om it z ero percent Aver age Line Figure. 1. Percentag e of ignored votes (KT ). 5.2 Experiment 2 – Recommenda tion Accuracy of KT versus WK The objective of this experiment was to as certain whether the choice of a ffinity measure affects t he results. We calculated t he prediction accuracy f or 500 users (who rated more than 20 movies). For each user we hid one rating, and made the prediction for the hidden movie usi ng the re maining information. We repeated this 20 times for e ach user and compare the 20 predictions with th eir hidden actual ratings. We ob tained the prediction accuracy f or each user as: Prediction accuracy = 1 – (|prediction – actua l rating| / 20). Kendall Prediction A c curacy 0.45 0.5 0.55 0.6 0.65 0.7 0.75 0.8 0.85 0.9 0.95 20 70 120 170 220 270 320 370 rating number P r e d i c t i o n A c c u r a c y Kendall Trend Line Kappa Prediction A ccuracy 0.6 0.65 0.7 0.75 0.8 0.85 0.9 0.95 20 70 120 170 220 270 320 370 Rating Number P r e d i c t i o n A c c u r a c y kappa Tr endline Figure. 2. Prediction acc uracy for KT versus predic tion accuracy for WK. The left-hand graph i n Figure 2 shows the prediction accuracy for 500 users using KT c orrelation. The median prediction accuracy was 0.798. The trend line shows t hat the prediction accuracy of users decreases slightly as th e rating num bers increase. The right-hand graph in Figure 2 shows the predi ction accuracy for 500 users using the WK correlation method. The trend l ine shows t hat rating numbers do no t affect the users’ prediction accuracy. The median prediction a ccuracy was 0.8 02. To p ut this in layman’s t erms, an accuracy of 0.802 indicates that there is one rank difference between the prediction and the user’s actual rating. For example if t he system predicts a mov ie as ‘Very Good’, the user may think that it i s ‘Good’. Although WK performed slightly bet ter, using a t-test to anal yze the data s hown in Figure 2, we found that there is no sig nificant difference between the p rediction accuracy obtained from the two methods. As we use the sam e parameters and algorithmic framework as in previous work [3], we can a ccurately compare our results to those fo und there. In our experiments, the median prediction ac curacy for WK was 0.802 and 0.798 for KT. In the previous work, the a ffinity measure used is either a si mple correlation method (SC) or Pearson’s Rank Correlation (PR). The median prediction accuracy of those was re ported as 0. 652 (SC) and 0.697 ( PR). Henc e, we can r ightly cl aim that by using a more appropriate affinity function, we significantly im prove upon previous resu lts. 6 Discussion and Con clusions In this pape r we have shown tha t using a more appr opriate affinity measure, such as KT or WK, we can significantly improve upon movie recommendation results reported earlier. Furthermore, the AIS has shown it self to be relatively robust to the affinity a lgorithm c hosen. Looking more closely at our KT findings, we i gnore ties, which l eads to a loss of information (on average 38.27%). T his is caused by the fact that in t he movie prediction problem there are only si x categories, but more possible comparisons (for n ca tegories there will be ½*n(n-1) c omparisons). For this reason, if we use KT , the r ecomm endation system i s l ikely to obtain worse results than for WK. However, the t est results show that the prediction accuracy using thes e two methods has only a slight difference, with KT being only marginally worse than WK. We assu me this is because there is a large amount of user inform ation in our system (70,000 users) and t he a lgorithm can continue unti l enough suitable users a re identified. Thus ignoring large amounts of data is less of a problem, but leads to longer run- t imes. However, if there is less user information or if run- t ime w as crucial, significantly better results could almost certainly be obtained using WK rather than KT. Therefore, we can conclude that in gene ral WK is better than KT as an affinity m easure in movie recomm endation. 7 Refer ences [1] D.G. Altman( 199 1) . Some co mmo n pro blems in medica l resear ch. P ract ical stati stics for me dica l resea rch, page 39 6-43 9, New Yo rk, C hap man & H all, 1 99 1. [2] D. Bil lsus a nd M.J . Pa zzani( 19 98). Lea rning c olla bor ative in for matio n filter s. In P roc eed ings of the 15t h Inter natio nal Co nfer enc e o n M achi ne Lea rni ng, p age s 46 -53, Mad ison, WI , 19 98. [3] S. Ca yzer a nd U . Aic keli n( 20 02). On the E ffects of Id iotypi c Inte racti ons for Reco mme ndatio n Co mmuni ties in Artific ial I mm une S yste ms. I n Pr oce edings o f the 1 st I nternati on al Co nfere nce on Artific ial I mm une S yste ms ICA RIS2 00 2, p ages 154 -16 0, Cante rbur y, 20 02 . [4] S. Cayzer and U. A ickel in. A Re co mme nder S ystem bas ed on I dio typic Artificial Immune Netwo rks . Jour nal o f Ma thema tica l Mo de lling a nd Algo rith ms, in print . [5] S. C ayzer a nd U. Aic keli n(20 02 ). A Reco mme nd er Syste m base d on t he I mmu ne Net wor k. In P ro ceed ings 200 2 W orld Congr ess o n Co m putati onal Inte llige nce CEC2 0 02, page s 80 7-8 13, H ono lulu, USA, 200 2. [6] Co mpaq Syste ms Resea rch Ce ntre, Eac hMovie da ta set , http :/ /resea rch.c o mpaq.c o m/SRC / e ach movie/ [7] L.N. de Castro a nd J T immis (20 02 ). Ar tificia l Immune S yste ms: A N ew Co mputat iona l Intellige nce Appr oac h, Sp ringe r Ve rlag, Lo ndon, Sep tembe r 2 00 2. [8] J. D. Fa rmer, N. H . P acka rd and A. S. Per elson( 198 6) . T he Imm une Syst em, Adap tat ion a nd M ac hine Learni ng. Ph ysica 22D , p ages 182 -20 4, 198 6. [9] R.A. G old sby, T .J . Lindt, B .A. O sb orne , J Kub y (2 00 3). I mmuno log y, Fift h Ed ition, W. H. Fre eman & Co mpany, Jan uar y 200 3. Pages1 -21 . [10 ] N. J erne (197 4). Toward s a ne t work t heo ry of the im mune s yste m. Ann. I mmuno l, 1 25C: 373 -38 9, 19 74 . [11 ] T. M orriso n a nd U. Aic keli n(2 002 ). An Artific ial I mmun e Syste m a s a Reco mme nder Syste m for W eb Sites I n Pr ocee dings o f the 1 st I nternati onal C onfer enc e on Ar tifici al I mmun e S ystem s ICA RIS2 00 2, p ages 161 -16 9, Cante rbur y, 2 002 . [12 ] G.E . No ether (19 86). W hy Kend all’s Ta u. T he B est of Te aching S tati stics, pa ges 41 -43 . [13 ] A. Pe relso n, G . W eisbuc h(1 997 ). I mmuno log y for Ph ysics, Revie ws of M ode rn P hysic s, V ol 6 9, No.4 .
Original Paper
Loading high-quality paper...
Comments & Academic Discussion
Loading comments...
Leave a Comment