lambda-Connectedness Determination for Image Segmentation
Image segmentation is to separate an image into distinct homogeneous regions belonging to different objects. It is an essential step in image analysis and computer vision. This paper compares some segmentation technologies and attempts to find an aut…
Authors: Li Chen
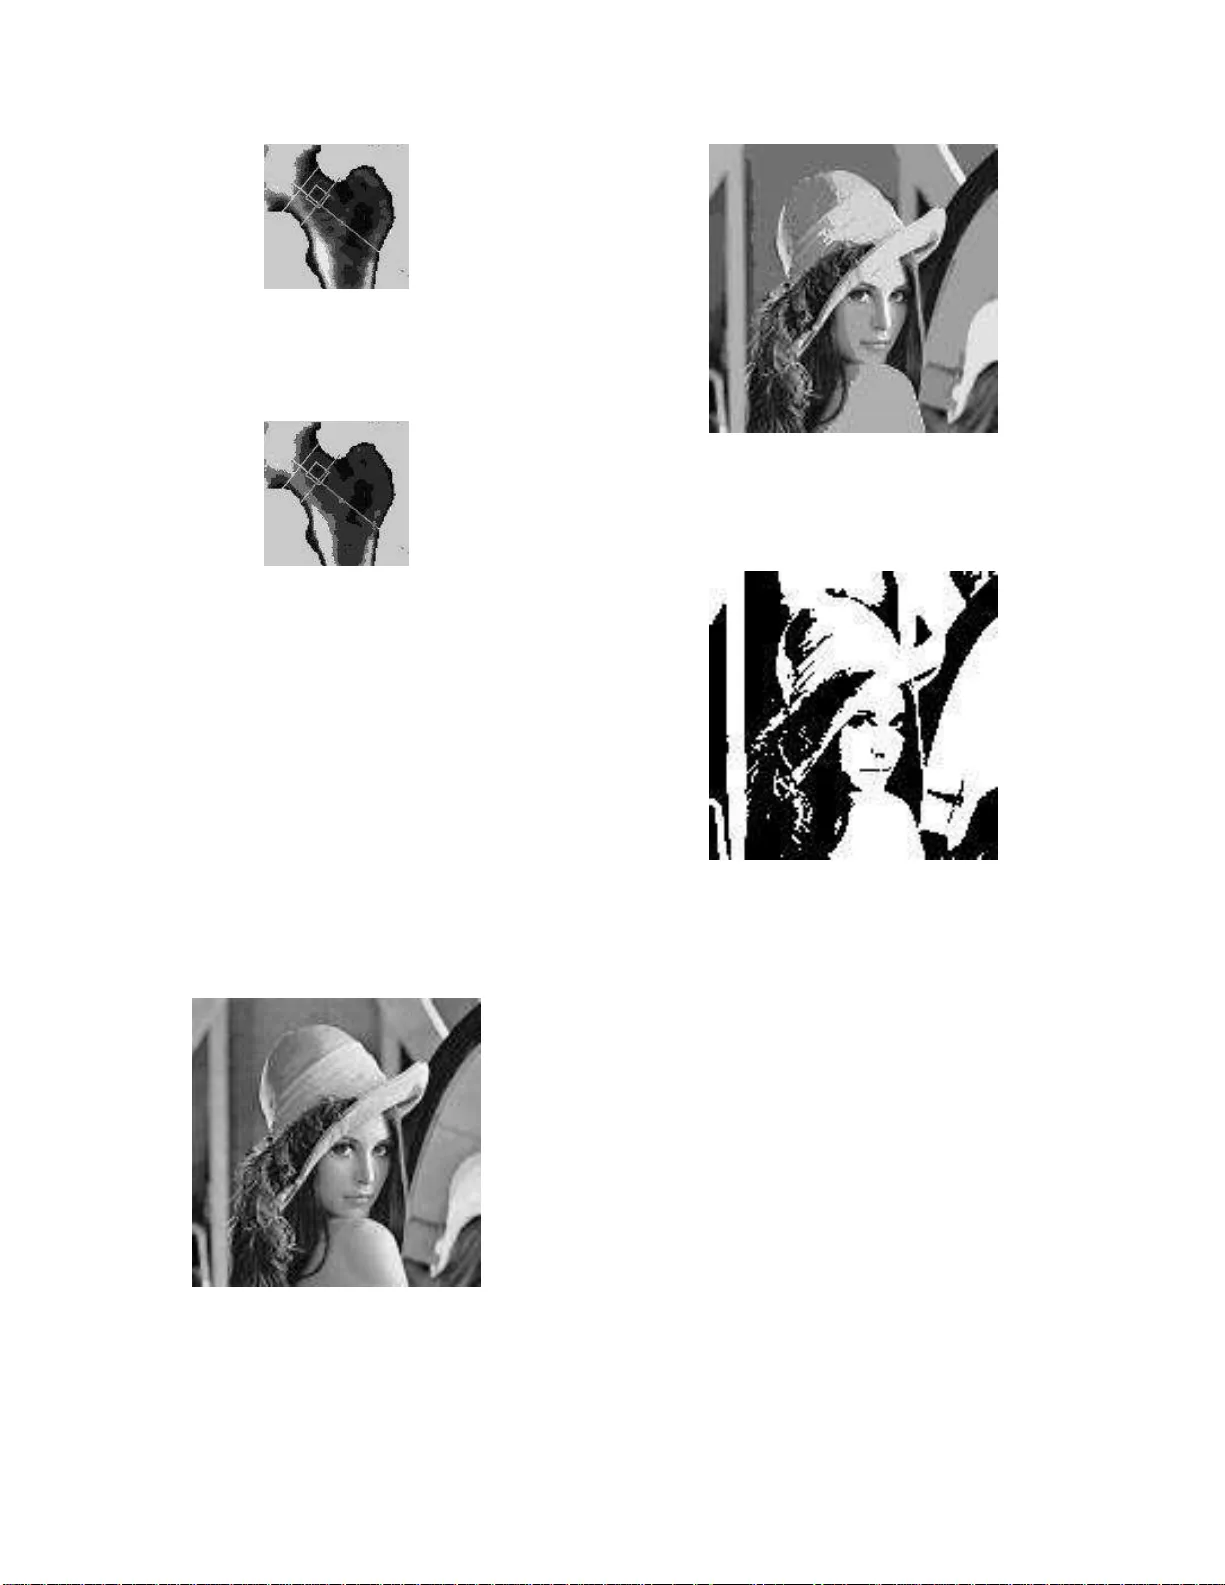
λ -Connectedn ess Determination f or Image Segmentation Li Chen Department of Computer Science and Information T echnology Univ ersity of the District of Columbia W ashington, D.C. 20008, USA lchen@udc.edu 36th Applied Imag e P attern Recognition W orkshop (AIPR 2007), October 2007, W ashington , DC, USA, IEEE Pr oceedings. Abstract Image se gmen tation is to separate an image into distinct homogeneous r egions belongin g to differ ent objects. It is an essential step in image analysis an d computer vision. This paper comp ar es some se g mentation technologies and attempts to fin d an automated way to b etter determine the parameters for image se gmentation , especially th e conn ec- tivity value of λ in λ - connected se gmenta tion. Based on the theories of the maximum entr o py method and Otsu’ s minimum varian ce method, we pr o- pose:(1) maximum entr opy connectedn ess determinatio n: a method that u ses ma ximum entr o py to dete rmine the best λ value in λ -connected se gm entation, an d (2 ) minimum vari- ance co nnectedn ess determina tion: a metho d that uses the principle of minimum variance to determine λ value. Ap ply- ing these o ptimization techniques in r e al images, the experi- mental r esults have shown gr eat pr o mise in the developme nt of the new method s. In the end , we extend t h e above metho d to mor e general case in order to compar e it with the famous Mumfor d -Shah method that uses variation al principle and geometric measur e. 1 Intr oduction Image segmentation is th e basic approach in image pro - cessing and com puter vision [22]. It is used to locate special regions and then e xtr act info rmation from them. I mage seg- mentation is used to partition an image into different co m- ponen ts or objects an d is an essential proced ure fo r im age prepro cessing, ob ject detection a nd extraction , a nd ob ject tracking. Im age segmentation is also re lated to edge de tec- tion. Even th ough there is n o unified th eory for image seg- mentation , some pra ctical method s ha ve b een studied over the years such as thre sholding, edge based segmentation, re- gion growing, cluster ing (unsupervised classification), and split-and-m erge se gm entation, to nam e a few . λ -co nnected segmentation is a technique in the category of re g ion gro w- ing segmentation. It was pr oposed to find an o bject h aving the proper ty o f gradual variation [3] [8] [4] [9] [10]. This paper attem pts to find an automated way to bet- ter determine the param eters for i m age segmentation, espe- cially the connectivity value of λ in λ -connected segmenta- tion. This paper first re v iews some major segmentation tec h- niques to explain why segmentation is difficult, and how a spec ial techniqu e would be selected in specific a pplica- tions. W e then focu s on ou r pr oblem of d etermining seg- mentation par ameters in λ -con nected segmentation . Based on the p hilosophies of the maximum entropy m ethod and Otsu’ s minimum v ar iance method, we pro pose: (1)maxi- mum entropy conn ectedness determination: a m ethod that uses max imum entropy to determ ine λ v alu e, and (2) mini- mum variance conn ectedness determin ation: a method that uses the principle of m inimum variance to determ ine λ value. Ap plying these op timization techniqu es in real im- ages, t he experimental results have sho w n the great pro mise of the new methods. In the end , we extend the above metho d to a mor e genera l case in ord er to c ompare it with the fa- mous Mu mford -Shah method that uses v ar iational princ iple and geometric measure [20]. 2 Image Segmentation Review In this section , we first r evie w currect technolo gy of im- age segmen tation: five types o f tech niques, th eir character- istics, and uses. W e th en focu s on the con nectedne ss-based image segmentation technique. 2.1 Ov erview of Image Segm en tation Ap- proac hes As we know , ther e is n o unified th eory for im age seg- mentation, some practical methods have been studied over 1 the years such as thresholding, edge based segmentation, region growing, c lustering (unsuper vised classification, e.g. k-mean or fuz zy c -mean), and split-and-merge segmenta- tion. Th ese segmentation algorithms have been developed for solving d ifferent pro blems [26]. Ho w ev er, they a re all based on one or more of the fi ve philosop hies listed below: (1) A segmen t is a class/cluster, so on e can use a clas- sification/clustering method to segment the image. Clas- sification method s usually do not nee d to u se th e loca- tion/position in formatio n. Cluster ing fo r un supervised clas- sification technology can perform better to find an objec t for samp led points within the subset of d ata fr ames. T ypi- cal tec hniques inclu de Isodata and k-mean o r fuzzy c-m ean. K -mean or f uzzy c -me an is a standard classification method that is o ften used in imag e segmentation [24]. Th is method class ifies th e pixels into different g roups in order to minimize the total “errors, ” where the “error” is the distanc e from the pixel v alu e to the center of its own group. (2) A segment is a h omogen eous region. If an object or region can be identified by absolu te intensity (th e pixel value), we u sually use threshold segmentation. In other words, an o bject will be recognized as a geometrically con- nected region whose values/intensities ar e between a certain high-limit and a low-limit. W e usually assume that th e high limit is the highest value of the image. Ther efore, in prac- tice, o ne o nly needs to deter mine the lo w-lim it. Maximu m entropy and minimum v a riance (also called Otsu’ s meth od) are tw o of the most popular meth ods fo r d etermining th e best threshold for single image [1]. Multilevel thr esholding is similar to thresho ld segmenta- tion and uses the same philosoph y , but m ultiple thr esholds are p roduc ed at on ce. It need s an e xtremely high time cost for computation [22] [29]. W e will discuss these two meth- ods in detail in section 3. (3) A se gm ent is a “smoothly-co nnected” region. In a region where inten sity changes smo othly or gradually , the region is vie wed as a segment. Smoothn ess can be mea- sured by a limit. A p opular segmentation metho d is called mean-b ased r e- gion growing segmentatio n in this paper [13]. A pixel will be included in a region if the upda ted r egion is homo ge- neous, meanin g that the difference between pixel intensity and th e m ean o f the region is limited by ǫ , a small r eal n um- ber . The λ -conne cted segmentation fo llows the same philo s- ophy . Th is is to link all pixels that ha ve the similar intensity . This method is related to a fuzzy m ethod created by Rosenfeld who treated an image as a 2D fuzzy set. Then, he used α -cut to segment the image into compon ents. An- other way is to measure tw o pixels to s e e if they are “fuzzy” connected . A pixel set is λ -co nnected if for any two po ints there is a path tha t is λ -co nnected wher e λ is a fu zzy value between 0 and 1 [ 8][3][4] [27][2 8]. This is a gener aliza- tion of thr eshold segmentation in some cases. This meth od can be used to di vide (par tition) different intensity le vels without calculating different th resholds or clip- lev el v alu es. Howe ver, fo r a com plex image, how to ca lculate th e value of λ remains unknown. A f ast algorithm can be designed to perfor m a se gm enta- tion. In fact, th e simple f orm of bo th th reshold segmen tation and λ -connected segmentation can be done in linear time. W e can see that m ean-based region growing segmenta- tion is a statistical app roach, but the λ -co nnected app roach is a graph- theoretic metho d. W e can combine them by re- quiring that the λ -conn ected segment also b e within a ǫ limit of the mean. Or after the mean-based segmentatio n, we can do a λ -connected segmentation.[7] (4)Split-an d-merge segmentation uses quadtree to d eter- mine the order in which pixel(s) shou ld b e tr eated or com- puted [ 23]. It is an algorithmic way to find an object o r to force a m erge order . Th is is because th is metho d is based on th e mean of th e merged region . It d oes not guarran tee a transitiv e r elation. Again, th e mean-based segmentation is no t an equiv alen ce relatio n. This method splits an im- age into four sectio ns and checks if eac h part is homo ge- nous. The homoge nous segmen ts are then merged together . If the segmen ts ar e no t h omoge nous, the splitting p rocess is rep eated. Th is p rocess is also called quadtree segmen ta- tion. Th e method is mo re accurate f or some complex im- ages. Ho wever , it costs more time to segment an image. The time complexity o f this method (process) is O ( nl og n ) . This was proved by Chen in 199 1.[4] (5) A segment is surroun ded b y one or se veral closed edges. If we can detect and track the edges, we c an deter- mine the location and outline of the segments. The fifth philosophy is edge detection . T o find low o r high frequ ency pixels are very common in edge detection. Howe ver, not all edge-d etection meth ods can be used in im- age segmentation since enhancin g edge is n ot the p rimary purpo se o f image segmentation. T he purpo se of ima ge seg- mentation is to find co mponen ts. The n umber of ed ges should b e relatively small. Other wise, the extraction of the closed curves will be the major problem. Recent develop- ment in dicated that the Mu mford -Shah method is pr omis- ing. The meth od uses the variational princ ipal [20]. This method has captured a considerable amoun t o f attention. The Mumf ord-Sha h m ethod considers three factors in segmentation: (1 ) the total length of all the segments?? edges, (2) the unevenness of the image with out its ed ges, and (3 ) th e tota l erro r between the origin al image and the pr oposed segmented images where each segmen t has unique o r similar values in its pixels. When the three weighted factors are minimized , the resulting image is a solution of the Mu mford -Shah method. Recently , Zhan and V ese prop osed level-sets to simplify the M umford -Shah method so that it produced better results [11]. Howe ver , 2 lev el- sets use con tour bo undaries that m ay limit the flexibil- ity of the original Mumford-Sha h m ethod. The Mumford- Shah method also needs an alternative pr ocess and its algo- rithm performan ce is still unknown. 2.2 Remarks on Selecting an Appropriate Segmen tatio n Metho d The k -mean o r fu zzy c -mean, maximum en tropy , an d the Mumfor d-Shah meth od all req uire an iterated process that is good at detailed or fin e segmentation. This is not a quick solution for f ast segmentation. T he fast segmen tation m eth- ods are only used fo r region gr owing in cluding the orig- inal thr eshold meth od, mean-based and lambd a-conn ected search, and split-and-me rge metho d. In practice, k -mean or f uzzy c-mean an d m aximum en- tropy are still the mo st pop ular . Howe ver, for some typ es of sequ ential ima ges, these two meth ods d o no t o btain sta- ble r esults when we pr ocess a set of meteor ological data to find areas with the mo st water vapor ind icating (most likely) the location of a hurricane [19]. λ -con nected se g mentation, on the other hand , h as worked very well. A problem the λ -connected meth od faced was that the λ value needed to be assign ed even tho ugh that value can be u sed th rough out each data fr ame in the da ta set. T o find a way to automati- cally d etermine the λ -value is a longtim e go al fo r th e author . Some metho ds have been pro posed such as maxim um con- nectedness spann ing tree [5] [6] and the g olden cut point [7]. In this paper, the au thor pro poses o ptimization meth ods based on maximum entropy and minimum variance, resp ec- ti vely . 2.3 The Connectedness-b ased Segm en ta- tion λ -Connected segmentatio n is based on the philosophy that a n object m ust Ha ve a smooth insid e and h as a ga p at its bou ndary (in terms of inte nsity). T r ying to find a closed curve/boun dary that indicates the intensity of the jump is the key to this method. A measure of connected ness can be used to partition a set of data into connected co mpone nts based on adjacency or neigh borho od systems. Using co nnectedn ess to divide an image d oes n ot r equire tr ansformin g the image into bina ry form. After the data is partitio ned, a fast algor ithm such a s the breadth -first-search algorith m can b e applied to find a connected comp onent [3][8]. λ -co nnected search was in - troduced to se gm ent such an image without transferring the image in to a { 0 , 1 } -imag e. Howe ver, the v alu e of λ , u sually between 0 and 1, determines the finen ess of the segmen ta- tion. λ -connected ness can be defined on an undirected g raph G = ( V , E ) with an associated (poten tial) functio n f : V → R m , where R m is the m -dimension al r eal space [10]. Giv en a mea sure α ρ ( x, y ) on each pair of adjacent po ints x, y b ased on the v alue s ρ ( x ) , ρ ( y ) , we define α ρ ( x, y ) = µ ( ρ ( x ) , ρ ( y )) if x a nd y are adjacen t 0 otherwise (1) where µ : R m × R m → [0 , 1] with µ ( u, v ) = µ ( v , u ) and µ ( u, u ) = 1 . α ρ is used to measure “n eighbo r- connectivity . ” Th e next step is to develop p ath-conn ectivity so that λ -connecte dness on < G, ρ > can be d efined in a general way . In graph the ory , a finite seq uence x 1 , x 2 , ..., x n is called a path, if ( x i , x i +1 ) ∈ E . The path-co nnectivity β of a path π = π ( x 1 , x n ) = { x 1 , x 2 , ..., x n } is d efined as β ρ ( π ( x 1 , x n )) = min { α ρ ( x i , x i +1 ) | i = 1 , ..., n − 1 } (2) or β ρ ( π ( x 1 , x n )) = Y { α ρ ( x i , x i +1 ) | i = 1 , ..., n − 1 } (3) Finally , the degree of co nnectedn ess or connectivity of two vertices x, y with respect to ρ is defined as: C ρ ( x, y ) = max { β ( π ( x, y )) | π is a (simple ) path . } (4 ) For a given λ ∈ [0 , 1] , point p = ( x, ρ ( x )) and q = ( y , ρ ( y )) are said to be λ -connected if C ρ ( x, y ) ≥ λ . In image p rocessing, ρ ( x ) is the intensity of a point x and p = ( x, ρ ( x )) defines a pixel. 3 λ V alue Determination and Optimization It is a natural and unavoidable question how we deter - mine λ v alue in connected ness-based segmentatio n? I t is somehow similar to d etermine the clip le vel in thr eshold segmentation; howe ver, l am b da v alue is not as sensitive as the clip-level in thresh olding. There are fewer λ values to be selected than clip-le vels. In C h apter 10 of [6], Chen pro- vided the detail analysis on this issue. Some techn iques have been propo sed and tested such as the binary search-based meth od an d the maximum co nnect- edness spanning tree method [ 6] [ 5]. W e also prop osed a golden- cut techn ique for bone de nsity measur ement in [7]. In this section , we p ropo se two new metho ds to determine the λ value for the segmentation . The new m ethods are based o n maximu m entropy and minimum variance, resp ec- ti vely . 3.1 Connectedness and Maxim um En- trop y In this subsection, we pro pose a method that uses the maximum entro py method to de termine the λ value. It can be called maximum entropy connectedness determination. 3 The maximu m entro py method was first prop osed by Ka- pur, Sahoo, and W o ng [ 15 ] . It is based on the maximization of inner entropy in both the foreground and backgrou nd. The p urpose o f find ing the best thresh old is to make both objects in the foregroun d a nd backgro und, respecti vely , as smooth as possible. [15] [22] [1] If F and B are in the foregro und and backg roun d classes, respectively , the m aximum en tropy can be calculated as fol- lows; H F ( t ) = − Σ t i =0 p i p ( F ) ln p i p ( F ) H B ( t ) = − Σ 255 i = t +1 p i p ( B ) ln p i p ( B ) where p i can b e viewed a s the number of pixels wh ose value is i ; p ( B ) is the numb er of pixels in backgr ound, and p ( F ) is th e numb er of pixels in foregrou nd. The m axi- mum entropy is to find the threshold value t that m aximizes H F ( t ) + H B ( t ) . Such an idea can b e used for λ -connected segmentation. Howe ver, the total inn er entropy fo r the im age is to calcu late the entr opy for each segment ( λ -connected comp onent) , no t for the thr esholding clippe d fo reground /background. This is becau se in λ -conn ected segmentation there is no sp ecific backgr ound. E ach λ -conn ected segment ca n be viewed a s foregrou nd, a nd the r est may be viewed as the back groun d. It is different from the o riginal maxim um entropy where the range of pixel v alues determines the inclusion of pixels . Therefo re, we ne ed to summarize all inner en tropies in all segments. H ( λ ) = Σ( inner en tropy of each λ -conne cted component ) (5) W e will select th e λ such that H ( λ ) will be m aximized. W e c all this λ -value the maxim um entr opy con nectedness. This unique value is a new measure for images. Since the ma ximum entropy means the min imum amount of information or minimum variation, we want th e minimum change inside each segmen t. This matches the philosoph y o f th e original max imum en tropy meth od. In other words, the λ -con nected maxim um entropy ha s a bet- ter meaning in some applications. W e use the λ e such that H ( λ e ) = max { H ( x ) | x ∈ [0 , 1 ] } . Assume there are m λ -c ompon ents, defin e in ner entropy of each λ -componen t S i : H i ( λ ) = Σ 255 k =0 − H istog ram [ k ] n log H istog ram [ k ] n where n is the number of points in the com ponen t S i . H istog ram [ k ] is the nu mber of pixels whose values are k in the segment. Th us, H ( λ ) = Σ m i =1 H i ( λ )) (6) The maximum entro py con nectedness can be viewed as a m easure o f a special conn ectivity fo r the image. If λ value is calculated in the ab ove formu la for an ima ge that m akes H ( λ ) to be max imum, we call that the imag e h ave the max- imum entropy connectedne ss λ , den oted as λ e . 3.2 Exp erimen tal results with λ e In [7], we prop osed a g olden cu t metho d for find ing the λ -value for bon e den sity co nnectedn ess calculation. W e have obtained a λ =0. 96, 0 .97 for a bone image (th e size of the picture is different fro m the one used in this paper). For a similar image, u sing the maximum entropy con nectedne ss presented in this section , we got λ e =0.95. The resu lt is quite reasonable. The o riginal ima ge a nd bo th of the segmented images are shown in Fig. 1-4 . No pre-cut (preprocessing) is perfor med in the segmentation. Figure 1. Bone Density Image Segmentation : the Original image Figure 2. Bone Density Image Segmentation : λ =0.97 What we can see in th e above three segmented images (Fig. 2 -4). Fig. 2 seemed to be th e same as th e original image Fig. 1. It is p ossible that Fig. 4 ma y represen t the better understan ding o f bone con nectivity . Howe ver, wh at we state here is that λ e can provide u s t h e meaningf ul result and it was done automatically . For the com monly used testing image ”Lena, ” Fig.5, the result of λ -co nnected segmentatio n is q uite interesting . Whatev e r we use a pre-threshold cu t or n ot, λ e is always 4 Figure 3. Bone Density Imag e Segmentat ion : λ e =0.95 Figure 4. Bone Density Imag e Segmentat ion : λ =0.93 0.99 ( Fig. 6) . An o riginal maxim um entr opy arrived at the clip-level of 125 counts of the 8 -bit gray le vel im age (0- 255 o f the p ixel value range. The r eason is that the “Lena” image does not contain many “continuou s” p arts. In the λ -connected segmentation, we can see th at λ e (=0.99 ) con- nected segmentation ha s co nnected the continuou s comp o- nent especially at the face and should er . This matches the result of using the maximu m entro py cut, Fig. 7 (W e u se NIH I mag eJ to perform the cu t.) Thus, we can say that our new method is still reasonab le. When we u se λ = 0 . 98 for the image, we get Fig. 8. Figure 5. Image Segmentation f o r testing im- age ”Lena:” the Original image Figure 6. Ima g e S egmentation f o r testing im- age ”Lena:” λ =0.99 Figure 7. Ima g e S egmentation f o r testing im- age ”Lena:” Standard Maxi mum Extr opy For the image having g radual v ar iation pro perty , λ - connected se g mentation usually has an adv an tage. W e have extensi vely tested a set o f sequential im ages in o rder to find the outlier of meteorolog ical data that indicates (most likely) the hurricane cen ter [ 19]. Th e d ata fr ames we used are water v apo r images. Except the stand ard thr eshold method and the λ - connected segmen tation metho d, all other method s we tested failed including famou s k -mean and maxim um en- tropy [19]. What we found w as that the key for this se- quential image s is that the pre-cut is n ecessary . Inter esting enoug h for us, 45% of the pick value of each im age for the cut receiv e s the b est result. After that, we can use λ =0.95 for the se gm entation parameter and extrac t the largest com- ponen t for th e outlier searching result. The problem h ere is th at 45 % of the pick v a lue a s c lip- lev el is not au tomatically ca lculated. I f we w ant a tota lly au- 5 Figure 8. Image Segmentation f o r testing im- age ”Lena:” λ =0.98 tomatic process, we m ight to use maxim um entropy to ma ke the first cut. In this testing set, we have 1 2 image frames. For some beginning images, the method w or ked we ll as e x- pected. For other im ages, the new meth od pro posed in this paper consistently got wrong results since the λ e calculated is always gre ater than or equal to 0 .97. W e cann ot get λ to b e 0.9 5 using “m aximum entro py connectedn ess. ” After looking into the detail image s, we hav e fou nd tw o prob- lems: (1) the p ixel v alues a re not “co ntinuou s” around “the desired o utlier , ” a nd (2 ) The largest co mpon ent cr iteria f or the ou tlier is no t q uite rep resent the nature o f h urrican e cen - ters (outliers), we need to chan ge the criteria to “the largest and the brightest. ” For (1) , we ha ve done a smoo thing pro cess. F o r (2), we change th e outlier criteria from the largest co mpon ent to the total intensity of the comp onent (not only testing its size). Smoothing preproce ss is reasonable, and it is good for the λ -connected segmentation to find large co mponen t. The following imag e shows such a treatm ent. W e h av e applied an automa tic pre-cut by using m aximum entropy instead of the p re-cut using the 4 5% of pick value. Fig. 9 shows an original image. Fig. 1 0 shows the re sult using our n ew method plus a maximum entropy threshold c ut of prep rocessing. A th resh- old value=23 is calculated b y stand ard max imum entropy . Then, we perfor m the automated finding process to get λ e described above. λ e = 0 . 90 was obtained and used. If we just use th e standard maximum entropy at thre shold = 23, we will hav e the following image Fig. 1 1. 3.3 Consider Outer En trop y in Maxim um En tropy Co nnectedness Using maximum entropy is a type o f p hilosophica l change. In fact, we can consider othe r fo rmulas. For ex- Figure 9. Im age Segmentat ion for Meteor o- logical data outlier: Original Image ample we can s ele ct another way to calculate the entropy of one segment. Here we pro pose a dif ferent formula. W e can calcu late the inne r entro py of a comp onent, then treat th e r est of the image as the backgrou nd for th e co mpone nt. The to tal en - tropy generated b y this segmen t is the summatio n o f both. W e ca n apply th is process to all comp onents/segments while segmenting. Let I be the image, C i ( λ ) = I − S i ( λ ) is the comp lement of compo nent S i ( λ ) H ( C i ( λ )) = { E ntropy for the set C i ( λ ) } W e can use the fo llowing form ula for the the b asis o f opti- mzation. H ( λ ) = H ( S i ( λ )) + H ( C i ( λ )) The outer (back groun d) entro py is th e total. H ( outer ) = Σ H ( C i ) In H ( outer ) , a pixel is calc ulated multiple times. W e may need to use th e average H ( outer ) /m where m is the n um- ber of se gm ents. T he relationship between this form ula and the formu la we used in the p revious su bsection is also inter - esting. Furthermo re, w e shou ld consider the fo llowing g eneral model. H o ptimal = a · H ( inner ) + b · H ( outer ) where a and b can be co nstant o r function o f segmentations. 6 Figure 10. Image Segmentation for Meteor o- logical data out lier: λ e = 0 . 9 0 , maximum en- trop y con nectedness determination. T he im- age is smoothed and pre-cut by the standard maximum entr opy at threshold = 23. 3.4 Connectedness and Minim um (Inner) V ariance In this subsection, we d ev e lop a m inimum variance- based method for finding the b est λ value in λ -co nnected segmentation. Minimum variance was first studied by Otsu in imag e segmentation [ 21 ] [ 11 ] . In oth er words, Otsu’ s seg- mentation was the first glob al optimization solution for im- age segmentatio n. I t is used to clip the im age into two parts: the object and the backgrou nd. Assume that σ 2 ( W ) , σ 2 ( B ) , σ 2 ( T ) rep resent the within- class variance, between-class variance, and the total vari- ance, respectively . The optimum threshold will be d eter- mined by maximizing one of the f ollowing cr iterion with respect to threshold t [ 21 ] [ 11 ] : σ 2 ( B ) σ 2 ( W ) , σ 2 ( B ) σ 2 ( T ) , σ 2 ( T ) σ 2 ( W ) σ is the standard d eriv ation . Since σ 2 ( T ) is c onstant for a certain imag e, this segmentatio n process is to m ake between-class v aria nce large and within-class v arian ce small. Therefo re, our task is to m ake the within-class vari- ance as small as possible. The or iginal d esign of Otsu’ s m ethod is not ab le to be implemented directly for λ -co nnected se g mentation which is similar to th e case of max imum entropy . T his is bec ause there were only two categories, the ob ject and th e back - groun d. F or the first and second criteria, in λ -conne cted segmentation there are many comp onents and it would be very hard to find b etween-class v arian ce. W e cou ld con- sider the total between-class variance, by considering ev er y Figure 11. Image Segmentation for Meteor o- logical data outlier: The image is smoothed and c lipped by standard maximum entr opy at threshold = 23. pair of componen ts. Or we could co nsider between -class variance for the components that are the neighbors . The third criterion seems likely to be valid, howe ver , when we only consider the variance within a connected compo nent, what will happ en is σ 2 ( W ) = 0 if λ = 1 . σ 2 ( T ) σ 2 ( W ) will be infinite and will alw ay s be the greatest value. In or der to make use o f Otsu’ s p hilosoph y , we modify the original fo rmula b y adding a term that is th e number of se g ments o r componen ts, M . W e try to minimize the following f ormula: H ( λ ) = Σ( inner variance of each λ − component ) + c · M (7) where c is a con stant. W e could let c = 1 . The calcu lation of the inner variance of a λ -comp onent is to com pute the variance ( square of stan dard d eviation) of the pixels in the compon ent. The following form ula is to find minimu m a verag e vari- ance (for each compo nent). H ( λ ) = Σ( inner variance of each λ − c omponent ) / M (8) W e want to find λ v such that H ( λ v ) = min { H ( λ ) | λ ∈ [0 , 1] } (9) This strategy only works for th e meteo rological data. The experimental results show that the method is promis- ing. For the other two k inds of images te sted in maximum entropy co nnectedn ess, “Len a” an d the Bone imag e, we still need to find an appr opriate way u nder minimum variance philosoph y . 7 The following images sho w the process o n the same pic- ture with a preprocessing threshold cut using the maximum entropy cut or 45% p eak cut. Then, we perfo rm the auto- mated process of find ing of λ -value. Fig. 12 shows that we arrived at λ v =0.97 using the method of minimum variance connected ness determinatio n described in this subsection. W ithou t smoothing the o riginal image, we pr e cut th e im- age using maximum entro py th reshold. The resu lt is n ot what we expected. Figure 12. Minimum variance connectedness determination without smoothing When we smo othed the image, we got λ v =0.90, and th e result turned to be correct, see Fig. 13. Figure 13. Minimum variance connectedness determination with smoothing 3.5 λ -Connectedness and Mumford- Shah’s Metho d How do we use Mumfo rd-Shah ’ s id ea to fin d the optimal segmentation? W e can define L as th e total length of the edge of all segments. H ( λ ) = α · Σ (in ner v a riance of each λ -compone nt) + β · L (10) where α and β are constants. More generally , we can do the normal λ -connected fit [4] [ 9] on ea ch λ -connected c ompo- nent. The total variance (or standar d deviation) of the (nor- mal λ -conn ected) fitted image is denoted as V . L is still the to tal length of ed ges o f segments (comp onents), and D is the difference between the fitted imag e and the origina l image. Using Mu mford- Shah’ s Metho d, we can minimize the following equation to get the λ p . H ( λ ) = α · ( V ) + β · ( L ) + γ · ( D ) (11) H ( λ p ) = min { H ( λ ) | λ ∈ [0 , 1] } (12) 4 Discussion Even though we calculated the entropy or variance in each c onnected com ponen t that is different from the stan- dard m aximum entropy and the Otsu’ s metho d in image seg- mentation, the philosophy remains the same as in these two popular m ethods. The results are very prom ising. These two new metho ds ca n be ea sily applied in o ther region- growing se gm entations. A large amount of furth er research should b e don e to suppo rt and the new method s. W e will implement the method pr oposed in subsection E in section III, and compare it with the results obtained in [11]. Refer ences [1] Ab dulkadir Sengur, Ibra him T urkoglu, M. Ce v det Ince, A com parative study on en tropic thre sholding methods, Istanb u l Univ er sity Journal of Electrical & Electronics Engineering Y ear V ol 6 No 2, pp 1 83-18 8, 2006. [2] T . Chan and L. V ese, Active co ntours without edges. IEEE Trans on Image Pro cessing, V ol 1 0, No 2 pp 266-2 77. [3] L. Chen Th ree-dimen sional fuzzy dig ital topology and its application s(I), Geop hysical Pr o specting for petr oleum , V ol 24, No 2, pp 86-89, 1985. 8 [4] L. Chen, The lambda-co nnected segmentation and the optimal algorithm for split-and -merge segmentation, Chinese J. Computers V ol 14 , pp 321-331, 1991. [5] L. Chen, λ -connected approximatio ns for rou gh sets, In Lecture Notes in Com puter Scien ce, Spring er , V ol 2457, 572- 577, 2002. [6] L. Chen, Discrete Sur faces and Manifo lds: A theory of digital- discrete geometry an d topo logy , S & P Com- puting, 2004 [7] L. Chen, λ -Measure for Bone Density Con nectivity , Proceeding s of IEE E Intern ational Symposium on In- dustrial Electro nics, 200 6 Montreal, Queb ec, Canada, 489-4 94. [8] L. Chen, H.D. Cheng, and J. Zhang, Fuzzy subfiber and its application to seismic lithology cla ssification, Information Science: Applications , V ol 1, No 2, pp 77-95 , 1994. [9] L. Chen, and O. Ad jei λ -Con nected Segmentation and Fitting: Thre e New Algor ithms, Proceed ings of IEEE confere nce on System, Man, and Cybernetics 200 4. [10] L. C h en, O. Adjei, an d D. H. Cooley , λ - Connectedn ess : Method and Application, Pr oceed - ings of IEEE co nfer en ce on System, Man, and Cyber- netics 2000 , pp 1157 -1562 , 2000. [11] M. Cheriet, J.N. Said, C.Y . Suen, A recursiv e thresh- olding techn ique for image segmentation , IEEE T ran- section on Iamge Pr ocessing , v o l 7 No 6, 1998 , 9 18- 921 [12] T . H. Corm en, C.E. L eiserson, and R.L. Riv est, Intr o- duction to Algorithm s , MIT Press , 199 3. [13] R. C. Gonzalez, and R. W ood, Digital Image Pr o cess- ing , Addison- W esley , R e ading, MA, 199 3. [14] L. Hertz an d R. W . Schafer, Multilevel thresholding using ed ge m atching, C o mput. V is. Graph. Image Pr o- cess. , vol. 44, pp. 279-295, 1988. [15] Kapur J.N., Saho o P .K. and W on g A.K.C., A new method of gr ay level pictur e thr esholding using the en- tropy of the histogr am, Comput. V ision Gr a phics Im- age Pr ocess. ,2 9, 273-2 85, 1985. [16] T . Kan ungo, D. M. Mou nt, N. Netanyahu, C. Piatko, R. Silverman, and A. Y . W u ,An e fficient k-mean s clus- tering alg orithm: Analysis and im plementation , IEEE T rans. P attern Analysis a nd Machine Intelligence , 24 (2002 ), 881-892. [17] J. Kittler and J. Illingworth , Minimum erro r threshold- ing, P attern Recognit. , v o l. 19, pp. 41-47, 1986. [18] R. K o hler, A segmentation system based on threshold- ing, Comp ut. Graphics Image Pr ocess. , vol. 15, pp. 319-3 38, 1981. [19] C-T L u, Y . K o u, J. Zhao, and L. Chen, Detectin g an d tracking region outliers in mete orolog ical data, Infor- mation Sciences , 2007, pp 1609- 1632. [20] D. Mu mford and J. Shah, Optimal app roximatio n by piecewise smooth functions a nd ass o ciated v ar iational problem s, Commu nication of Pur e and Ap plied Math- ematics , vol. 42, pp. 577- 685, 1989. [21] N. Otsu, A thresho ld selection m ethod fro m grey-level histograms, IEEE T rans. Syst., Man, Cybern. , v ol. SMC-8, pp. 62-66, 1978. [22] N. Pal and S. Pal, A revie w on image segmentation technique s, P attern Recogn ition , V ol 26, pp 1277- 1294, 1993 . [23] T . Pavilidis, Algorithms fo r Grap hics and Image Pro- cessing, Compu ter Science P r ess , Roc kville, MD, 1982. [24] T . A. Runkler, J. C. Bezdek , and L. O. Hall, Clus- tering very large data sets: the complexity of the fuzzy c-mean s algorithm, Pr oc. EUNITE 2002 , ed. K. Lieven, publ. B y Elite Fnd n, Aachen , Germany , ISBN 3-896 53-91 9-1, 420-42 5, 2 002. [25] P . K. Saho o, S. Soltani, an d A. K. C. W ong, SUR VEY : A su rvey of thr esholding techn iques, Comput. V is. Graph. Image Pr ocess. , vol. 41, pp. 233-260, 1988. [26] M. Spann and R. W ilson, A quad-tree a pproach to im - age segmen tation which co mbines statistical and spa- tial in formatio n, P attern Recognit. , v ol. 18, pp. 2 57- 269, 1985. [27] L. Tsai and F .T . Berk ey , Ionog ram an alysis using fuzzy segmen tation and connectedness tech niques, Radio Science , V ol 35, No 2, 11 73-11 86, 200 0. [28] L. Tsai, F . T . Berkey , and J. Y . Liu, Automatic iono- gram trace identification u sing fuzzy classification technique s, Comp uter Aided Pr o cessing of Ionograms and Ionoson de Recor d s , France, pp 45-50, 1996. [29] S. W ang and R. M. Haralick, Automatic multithresh- old selection, Com put. V is. Graph. I mage P r ocess. , vol. 25, pp. 46-6 7, 1984. 9
Original Paper
Loading high-quality paper...
Comments & Academic Discussion
Loading comments...
Leave a Comment