Software graphs and programmer awareness
Dependencies between types in object-oriented software can be viewed as directed graphs, with types as nodes and dependencies as edges. The in-degree and out-degree distributions of such graphs have quite different forms, with the former resembling a…
Authors: G. J. Baxter, M. R. Frean
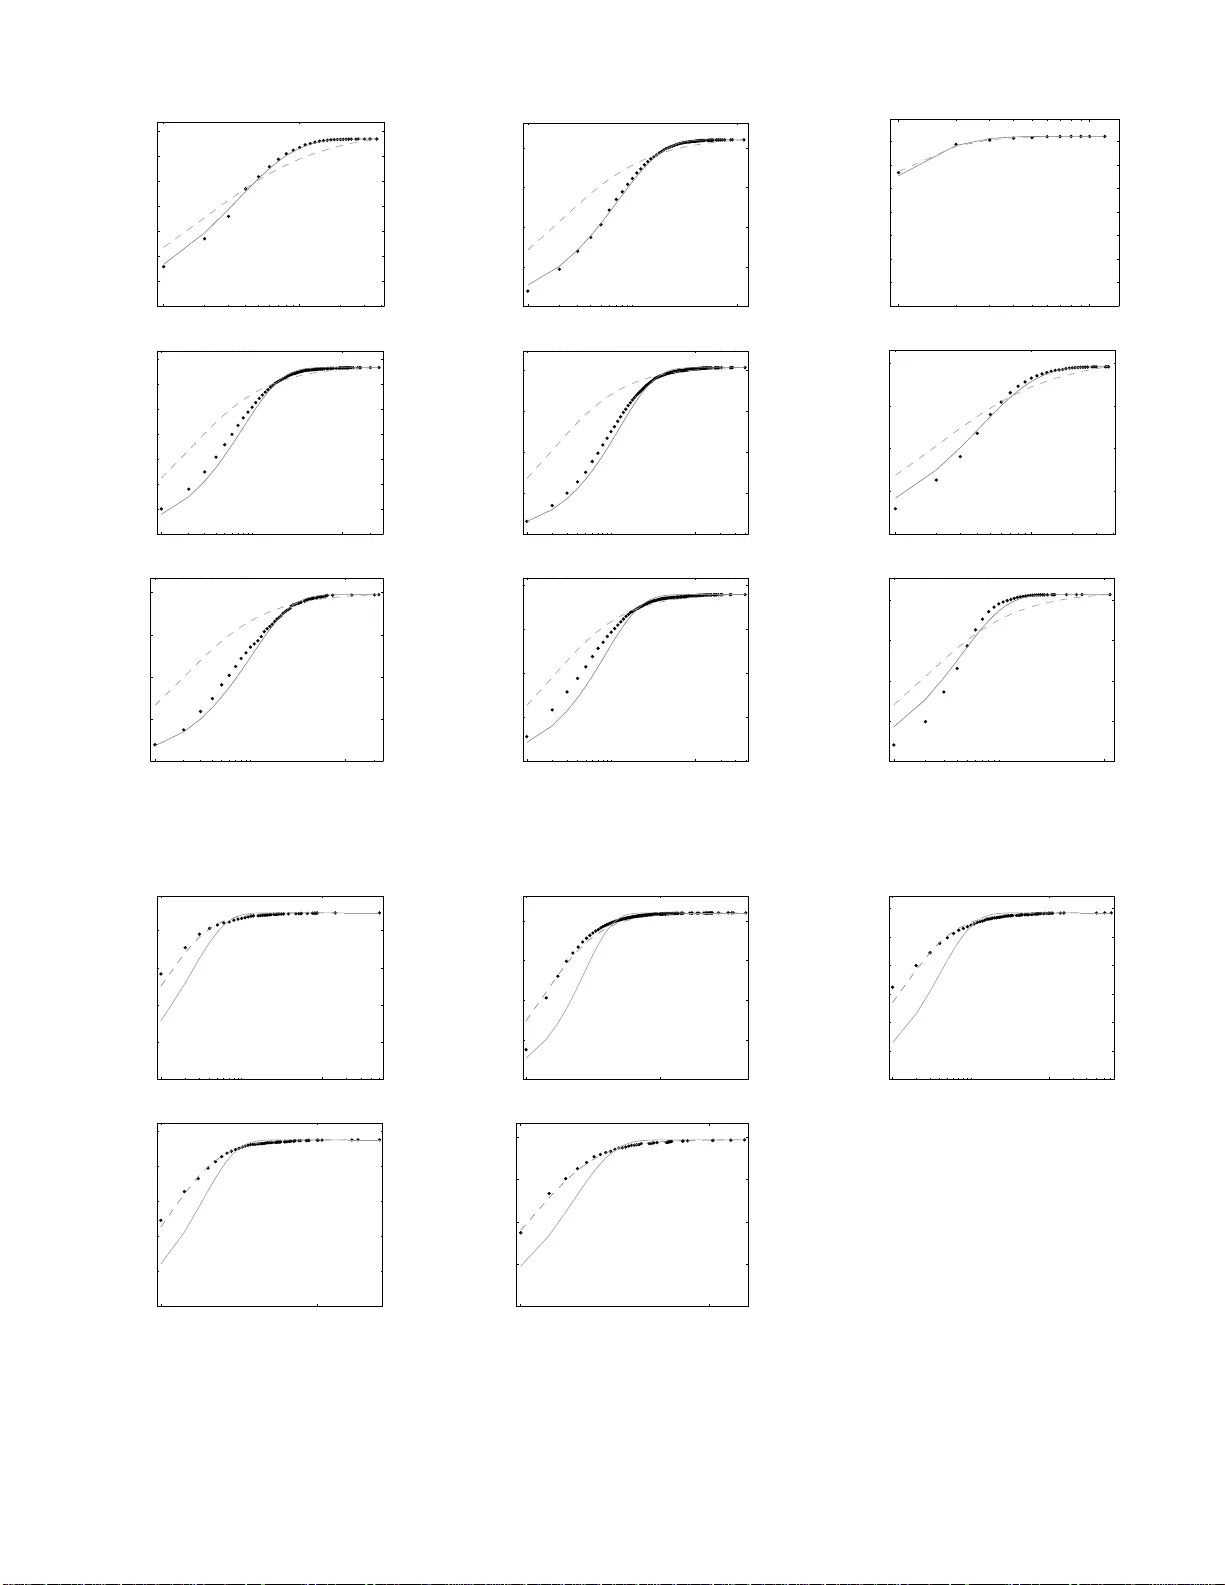
Soft w are graphs and programm er a w areness G. J. Baxter ∗ and M. R. F rean Scho ol of Mathematics, Statistics and Computer Scienc e, Victoria University of Wel lington, P.O. Box 600 Wel lington 6140, New Ze aland (Dated: N o vem b er 20, 2021) Dep endencies b et w een typ es in ob ject-orien ted s oftw are can be view ed as directed graphs, w ith types as nod es and depen dencies a s edges. The in- degree and out-degree distributions of such graphs hav e quite different forms, with t he former rese mbling a pow er-la w distribution and t he latter an exp onen tial distribution. This effect app ears to be indep endent of applicati on or type relationship. A simple generative mo del is p roposed to explore th e p roposition that the difference arises b ecause the programmer is aw are of th e ou t -degree of a type bu t not of its in- degree. The mo del repro duces t h e tw o distributions, and compares reasonably wel l to those observed in 14 different type relationships across 12 differen t Ja v a app lications. P ACS num bers: 89.75.Hc, 89.20.Ff, 05.40.-a ,89.75.Fb Keyw ords: net works, ob ject-orient ed programming, stochastic pro cesses I. INTRO DUCTION Mo dern computer pr ograms are larg e and highly struc- tured e n tities. Naturally the c o mponents of a progr am depe nd o n each other, a nd in general if we think of the progra m comp onen ts as no des a nd dep endencies as edg es, a directed g raph can b e constructed. There is not a single graph for each prog ram, a s there are many different wa ys that ‘no de’ and ‘edg e’ might b e defined. F or exa mple, for a given o b ject-or ien ted pr ogram, we might construct the graph in which nodes are top-level types and a n edge from t yp e a to type b indicates that t yp e a has a field of type b . Thus the num ber of types of fields declared in a can b e considered as the ‘out’ degree of a , while the n um b er of t yp es having fields of t yp e a is its ‘in’ degree. As another example, tw o top-le vel t yp es could b e linked when one contains a metho d (out) with a pa rameter o f the other’s t yp e (in). These differ en t ways of constructing the graph will be r eferred to as different met rics . The distributions of in-degr e e and out-degree show a clear diff erence in form. This dimorphism was o bserv ed in a rang e o f graphs generated fr o m the source co de o f a large corpus of open-sour ce Jav a soft ware in [1]. It w as found that the in-degree distributions were well fitted by p ow er-law distributions, which app ear as a stra ig h t line when plotted on log arithmic axes. The out-degre e distributions, o n the other hand, ar e noticeably curved on a log-log plot. This pa ttern a ppears regardless of the metr ic used or the applica tion of the s oft w are exa mined [1 , 2], and even app ears in other kinds of softw a re-derived g raph struc- tures [3, 4, 5]. Softw a re c ode is a direct pro duct of the ac- tions of progr ammers, and therefor e the resulting ‘s hapes’ of the co de result fro m these actions. It is clear that the difference b etw ee n in-degree and o ut-degree distributions is not accidental, but is in some way a res ult o f the wa y ∗ Electronic address: gareth.baxte r@mcs.vuw.ac.nz in which nodes and edges are created as the pr ogram is written. Because this basic shape is o bserv ed in suc h a v arie ty of softw are and metrics, the mec ha nism m ust b e quite general, and cannot depe nd on any sp ecific features of the wa y different kinds of dependencies are cr eated or different desig n metho dologies are used to write softw are. While we may b e able to characterize the different dis- tributions by fitting functions of different kinds, and ex- amining the pa rameters of the fitted functions for trends and patterns – for example, the exp onent of a p o wer law distribution – such descr iptiv e mo dels can never explain what we see at any deep lev el. W e rea lly wan t to know not just what shap es so ftw are has, but how these s hapes come ab out. One explanatio n, suggested in [1], is that the out-degr ee is more a ctiv ely controlled by the pro- grammer. The o utgoing edges of a t y pe co nsist of refer- ences directly coded as the t y pe is written, while for the in-degree, refer ences to a t yp e are cr eated as other t yp es are written. In this pap er, we prop ose a simple gener ativ e mo del based on this observ ation which repro duces features ob- served in real softw are graph degree distr ibutions. The mo del aims to capture the simplest actions of a progr am- mer with resp ect to t yp e a nd dep endency cr eation. New edges are added b etw ee n existing no des of the gr aph, and a new node can be cr eated by the division of a n ex- isting no de into tw o parts. The treatment of incoming and outgo ing connections b etw e e n no des is symmetrical in every w ay except that the division of no des dep ends on the out-degree of the parent no de in a sp ecific w ay , but is independent of the no de’s in-deg ree. This rep- resents the programmer ’s a wareness of the outgoing de- pendenc ie s but not of the co de elsewhe r e in the pr ogram which r efers to the curr en t type. It is found that this single a symmetry is s ufficien t to re pr oduce the difference in shap e betw een the tw o degree distributions observed in real soft w are. The model prop osed is similar to that developed by P rice [6] to explain citation r ates for pa- per s, though whereas P rice’s mo del pro duces pow er-law distributions for bo th in-degree a nd out-degree dis tr ibu- 2 tions, the in tro duction of the splitting step con verts the out-degree distribution to an expo ne ntial distribution. W e co nsider the degree distributions o f a v ariety of int er-cla ss r elationships in the Jav a s ource co de of 12 dif- ferent a pplications. These 12 progr ams ar e the larges t of the 50 studied in [1]. The actual programs (and ver- sion num ber s) used are listed in Appendix B. Each met- ric coun ts for each type a certain kind of depe ndenc y o n other types. W e consider 14 metrics that can b e identified as measuring either an out-degree or in-degree. Metrics used in [1] which could no t b e classified unam biguously as in- o r out-degr e e distributions were left out. The met- rics a re defined in Appendix A, a nd each is referr ed to by a short abbr eviation. Some pairs o f metrics register opp osite ends of the sa me relations hip, suggesting that they ar e the out- and in- degree distributions of the s ame graph. How e ver, considerations such as the separatio n of application code from shared librarie s mean that the count of o utgoing edges do es no t alwa ys match the to- tal of incoming edges. W e will not go into detail a bout the differences be tw een the metrics, as our a im is simply to demonstrate the exten t to whic h the model descr ibed below repr oduces the patterns observed in these v ario us data. Plots of the 5 ‘in’ metrics (see App endix A) on log arith- mic axes o ften have a linear form, suggesting a p ow er-law distribution is typical for gr aph in-degree distributions , regar dless of the sp ecific metric used or the particular progra m. Three e x amples are s ho wn in Fig. 1, whic h shows the deg ree distributions fo r three different ‘in’ met- rics (see Appendix A ) in thre e different programs of dif- fering sizes. The 9 ‘out’ metrics (see App endix A) do not appear linear on doubly log arithmic axe s , how ever a nu mber of the plots do hav e a linear shap e whe n plot- ted o n linear -logarithmic a xes, sugge s ting an exp onen tial distribution. Not all the data s ets conform clearly to this pattern, having a slig h tly different shap e or one or more p oints which do not fa ll on a neat curve. Nevertheless, the general pattern for in-degree is power-la w like, and for out-degree se e ms to b e an exp onen tial shap e. This sug - gests there is a common underlying pro cess, modified to a gr e ater or less e r degr ee by sp ecific progra mmer actio ns in each case . Soft ware g raph structure s have bee n examined in sev- eral recent studies [1, 2, 3, 4, 5, 7, 8, 9]. In particular , several hav e r eported p ow e r-law like deg ree dis tr ibutions in gra phs deriv ed from so urce code [3, 7] or f rom ob ject relationships at run-time [4]. A distinction b et ween in- degree and o ut-degree distributions has b een o bserved in graphs derived from C and C++ softw are by Myers [3], who treated b oth as approximate p ow er-law distri- butions, and V alverde and Sol ´ e [5],who in common with the present s tudy of Jav a softw are, c haracterized the in- degree as a p o wer-law a nd the out-degre e as a n exp onen- tial distribution. They showed that these distributions can be g enerated by certain ca ses o f the GNC (‘grow- ing net work mo del with copying’) netw ork growth mo del [10], although the p ow e r law distribution generated by this mo del has a fixed ex ponent of 2. Y an, Qi a nd Gu [2] examined Jav a a pplications, constr uc ting the directed graph of ‘imp ort’ rela tionships. Once again they note that the in-degree[1 4 ] distribution typically resembles a power-law while the out- de g ree has a largely exp onential behavior. Co ncas et al. [9] also studied a Jav a applica- tion, and noted a diff erence b et w een in-degree and out- degree distr ibutio ns . These observ atio ns ar e co nfirmed by the presen t study of a muc h larger gro up of Jav a ap- plications and metr ics. Y an et al. also po stulate a gen- erative mo del for suc h distr ibutions, but mak e no claims ab out its plaus ibilit y in relatio n to progr ammer actions . II. MODEL As programmers wr ite softw are co de, they will p eri- o dically add references b etw ee n types (edges), a nd o cca- sionally create new t yp es (no des). It is these asp ects of the c ode w e a re interested in, so the in tervening co de, which is a c tua lly the ma jority o f the pr ogram and sp eci- fies a ll its functions, is ignored. W e consider a simplified pro cess, ea c h step of whic h en tails either the addition of an edge b etw een tw o existing nodes or the addition of a new node. Generally there a re a few elemen ts that hav e many references to o ther par ts of the pro gram (these might be the most complex t yp es), while there are man y that reference o nly a few other types. This divergence can be approximated by ens ur ing that the “the ric h ge t richer”, inv o king the ‘cumulativ e adv antage’ mechanism of Pr ice [6]. New o utgoing e dges are added to the type which a prog rammer is ‘currently working on’, and we co nsider that the larger types (those with most out-edges already) are more likely to b e added to in future. A t each step a new edge is a dded, a nd the node the link orig ina tes from is chosen with a pro babilit y pr oportio nal to its curr en t out-degree. Conv ersely , there ar e a few elements that ar e refer - enced rep eatedly by man y of the other pa rts of the pro- gram (we mig ht think of these as the simplest and most universal elements), while there ar e many that are used only a f ew times (these might b e mor e complex ele - men ts, at a higher level of hiera r c hy , and therefore are less reusable). W e consider the n um b er of incoming de- pendenc ie s a type has to be an a ppro ximation to it’s usefulness. Therefor e the node to which a new e dg e will be linked is chosen with a proba bilit y propo rtional to its current in-deg ree. The progra mmer is conscious of the num ber of o utgo- ing refere nces he or she is a dding to a no de, and at some po in t may decide the t yp e is ‘to o big’ and create a new one. This effect is repres e nted by allowing new no des to o ccasio nally be created b y ‘splitting’ an existing no de int o t wo pieces. The edges attac hed to the origina l no de are divided betw een the t wo r esulting no des with e ac h po ssible division betw een the t wo no des of incoming and 3 10 0 10 2 10 0 10 2 degree frequency jre−1.4.2.04: PP 10 0 10 1 10 0 10 1 10 2 degree frequency jboss−4.0.3−SP1: RP 10 0 10 1 10 0 10 1 degree frequency geronimo−1.0−M5: SP FIG. 1: Some examples of degree distributions fo r ‘in’ metrics that app ear to hav e a p ow er-law distribution. Both axes are logarithmic. Po we r la w distributions app ear straigh t on these axes. 0 50 100 150 200 10 0 10 1 10 2 10 3 degree frequency eclipse−SDK−3.1−win32: DO 0 5 10 15 20 10 0 10 1 10 2 10 3 degree frequency openoffice−2.0.0: PC 0 20 40 60 10 0 10 1 10 2 degree frequency azureus−2.3.0.4: nF FIG. 2: S ome examples of degree distributions for ‘out’ metrics that app ear to hav e an exp onen tial distribution. x -axis is linear, y -axis is loga rithmic. Exp onen tial distributions appear straig ht on these ax es. outgoing edges eq ually likely , with the constraint that at least one outgoing edge m us t b e transferred to the new t yp e, and one inco ming edge must remain in the original t yp e. Finally , if w e think of the new no de a s car rying out a subset of the ‘task’ o riginally in tended for the parent no de, the tw o no des m ust b e connected, so a new edge is created from th e orig inal type to the new t yp e. This also ensures that at all times every no de has at least one incoming edge and one outgoing edg e. Let v i be the out-degree of no de i , and w i be its in- degree, with i running from 1 up to k , the current num ber of nodes. All of these quan tities ca n gr o w a s the pro cess pro ceeds. Let t be the n umber o f steps car ried out so far. Since exactly 1 edg e is added a t each step, P i v i = P i w i = t . The pro cess is initia ted a t t = 1 with a single no de (type) with a s ingle re fer ence to itself (this is necessary , as link s are only added to no des which alrea dy po ssess links), i.e. k = 1 and v 1 = w 1 = 1 . At each step: • select p ar ent no de m with probability v m /t • With probability (1 − γ ) simply a dd an edge : ◦ the parent node m is the out no de, ◦ select in no de n with pr o babilit y w n /t , ◦ v m → v m + 1 and w n → w n + 1. • Other wis e, with proba bilit y γ , s plit the parent no de: ◦ add a new no de k + 1 (the las t node n umber increments from k → k + 1), ◦ choo se r uniformly fro m { 1 , ..., v m } and s uni- formly from { 0 , ..., w m − 1 } [1 5 ], then v k +1 → r , v m → v m − r + 1; w k +1 → s + 1 and w m → w m − s . • Increment the co un ter t → t + 1 . These steps ar e rep eated for s ome predetermined num- ber o f steps t f inal . The entire simulation is defined b y only tw o parameters: the total num b er of links r equired (equal to t he num ber of simulation steps), t f inal , a nd the splitting pro babilit y , γ . Since new types only ap- pea r due to the splitting process , γ determines the ratio betw een the n umber of types a nd the num b er of links: k t → γ as t → ∞ . Note that although nodes to b e ‘work ed on’ are selected acco rding to their out-degr ee, this model is actually symmetric with r espect to in- a nd out-degree, except for the splitting step: no des acq uire outgoing edges at a rate prop ortional to their existing out-degree, and acquire inco ming edges at a rate pro por- tional to their in-degree. In this mo del edges are a dded one by o ne to different parts of the graph, so all the t yp es grow at the same time. New no des are also crea ted during this pro cess. This doesn’t necessar ily reflect the actual order in whic h program code is written. Although the graph contin ues to grow, a fter a suffi- cient n um b er of s teps, the r e lativ e degree frequencies – 4 10 0 10 1 0 1000 2000 3000 4000 5000 6000 7000 degree cumulative frequency netbeans−4.1: AC 10 0 10 2 0 2000 4000 6000 8000 degree cumulative frequency netbeans−4.1: DO 10 0 10 1 0 1000 2000 3000 4000 5000 6000 7000 degree cumulative frequency netbeans−4.1: nC 10 0 10 2 0 1000 2000 3000 4000 5000 6000 7000 degree cumulative frequency netbeans−4.1: nF 10 0 10 2 0 2000 4000 6000 8000 degree cumulative frequency netbeans−4.1: nM 10 0 10 1 0 2000 4000 6000 8000 degree cumulative frequency netbeans−4.1: PC 10 0 10 2 0 200 400 600 800 degree cumulative frequency netbeans−4.1: pkgSize 10 0 10 2 0 2000 4000 6000 8000 degree cumulative frequency netbeans−4.1: PubMC 10 0 10 2 0 2000 4000 6000 8000 degree cumulative frequency netbeans−4.1: RC FIG. 3: Cumula tive d egree distribution of ‘out’ metrics (as lab eled, see App endix fo r definitions) for netbeans-4.1 with best fit model out - degree distribution (sol id gray li ne) as describ ed in Section II. A lso sho wn for co mparison is the b est fit model in-degree d istribution (d ashed line). Horizontal scale is logarithmic and vertical scale is linear. 10 0 10 2 0 500 1000 1500 2000 degree cumulative frequency netbeans−4.1: AP 10 0 10 2 0 2000 4000 6000 8000 degree cumulative frequency netbeans−4.1: DOinv 10 0 10 2 0 500 1000 1500 2000 2500 3000 degree cumulative frequency netbeans−4.1: PP 10 0 10 2 0 500 1000 1500 2000 2500 degree cumulative frequency netbeans−4.1: RP 10 0 10 2 0 200 400 600 800 degree cumulative frequency netbeans−4.1: SP FIG. 4: Cumulativ e degree distribution of ‘in’ m etrics (as lab eled, see A ppend ix for definitions) for t he largest program studied, netbeans-4 .1 with b est fi t mo del in-degree distribution (d ashed gray line) as describ ed in Section I I. Also show n for comparison is the best fit mo del out-degree distribution ( sol id line). Horizontal scale is logarithmic and v ertical scale is linear. 5 10 0 10 1 0 2000 4000 6000 8000 degree cumulative frequency eclipse−SDK−3.1−win32: AC 10 0 10 1 0 500 1000 1500 2000 2500 degree cumulative frequency jtopen−4.9: AC 10 0 10 1 0 100 200 300 400 500 600 700 degree cumulative frequency argouml−0.18.1: AC 10 0 10 2 0 1000 2000 3000 4000 degree cumulative frequency eclipse−SDK−3.1−win32: AP 10 0 10 2 0 200 400 600 800 degree cumulative frequency jtopen−4.9: AP 10 0 10 1 0 50 100 150 200 250 300 350 degree cumulative frequency argouml−0.18.1: AP FIG. 5: T op row: Degree distribution for AC (‘out’ metric) for t h ree different programs (as lab eled, se e App endix), on logarithmic-linear axes. Bottom row : Degree distribution for AP (th e recipro cal ‘in’ metric) for the same three programs, on logarithmic-linear axes. normalized by the total num b er o f no des – reach an equi- librium distribution. Let C m be the num b er of types with out-degree m after step t . Considering the t w o pr ocesse s inv o lv ed in the mo del, C m can increase by 1 if an outgo- ing edge is added to a type with o ut- de g ree m − 1 a nd is no t split, or if a t yp e with out-degree gr eater than m is s plit at just the right place tha t one of the resulting t yp es has o ut-degree m . Similarly , C m decreases if a type of size m ga ins a new out-link, or is split, so long as the po in t of splitting is not 1 or m . With a little consider- ation, we can wr ite down the exp ected change in C m at the next step: h δ C m i = (1 − γ )( m − 1) C m − 1 + γ X r >m rC r 2 r − (1 − γ ) mC m − γ mC m (1 − 2 m ) . (1) The exp ected fraction of types that hav e degree m is f m = h C m ( t ) i h k ( t ) i . (2) It follows from the definition that h δ C m i = γ f m . Sub- stituting back into (1 ) w e find after collecting like ter ms that (1 + m − 2 γ ) f m = (1 − γ )( m − 1) f m − 1 + 2 γ R X r = m +1 f r . (3) This equation is v alid for all m > 1 . Replacing m b y m − 1 in (3), rear r anging for the summation term and substituting back into the origina l v ersion of (3) gives f m in terms o f f m − 1 and f m − 2 , and after calculating f 1 and f 2 explicitly we find b y induction the solution for general m to be f m = γ (1 − γ ) m − 1 , (4) which can be written as an exp onential f m = γ 1 − γ e − β m where β = − ln(1 − γ ). A s imila r calculation ca n be performed for the in- degree distribution. The in-degree and out-deg ree of a t yp e are completely indep endent, so the selection of a t yp e for splitting is uniform with resp ect to in-degree. If g n , in analogy to f m , is the fraction of t yp es w ith in- degree n w e find that g n 2 n − 1 n + (1 − γ ) n = 2 X l>n g l l + (1 − γ )( n − 1) g n − 1 . (5) Using a similar method to b efore w e find g n = (1 − γ ) n 2 + (1 − γ ) n g n − 1 , (6) so that g n = Γ( n + 1)Γ(2 + 2 1 − γ ) Γ( n + 1 + 2 1 − γ ) g 1 , (7) and normaliza tion can b e used to find g 1 . F o r la r ge n , the ratio g n /g n − 1 tends to 1 − 2 (1 − γ ) n , that is, the in-degree distribution tends to a p ow er -la w of the for m g n = cn − α 6 with expo nen t α = 2 / (1 − γ ). Thus the mo del predicts a decaying exp onential for the out-degr ee distribution, and an in-degree distr ibutio n with a p o wer-law tail with exp onen t gr eater than or equal to 2 . Examples of the t wo dis tr ibutions (4) a nd (7) are shown in Fig. 6. 10 20 30 40 50 10 −4 10 −3 10 −2 10 −1 10 0 n f n , g n 10 0 10 1 10 −4 10 −3 10 −2 10 −1 10 0 n f n , g n FIG. 6: Examples of the degree d istribu t ions generated by the mod el, with parameter γ = 0 . 3. S olid line is the out-degree mod el, f n , dashed line the in -degree model, g n . On linear- logarithmic axes, top, and double logarithmic axes, b ottom. II I. COMP ARISON WITH MEASURED DA T A The distributio ns (4) and (7) were fitted to the da ta de- scrib ed in Sectio n I using a max im um likelihoo d metho d, which is asymptotica lly unbiased [11] . Given some can- didate distribution f ( x , γ ), the likelihoo d that the his- togrammed data h i at v alues x i was g enerated fro m this distribution, given the par ameter γ , is p ( h | γ ) = k Y i =1 f ( x i , γ ) h i (8) and we pro ceed by finding the v a lue of γ which maximizes this quantit y . In the ca se of out metrics, f ( x i , γ ) is given by (4), and the maximum likelihoo d estimator (MLE) of γ is found analytically to be ˆ γ = k t (9) as exp ected, where t = P i x i h i is the nu mber o f edges in the graph, and k = P i h i is the num b er o f no des. F or in metrics , we use (7), for which w e hav e not bee n able to find a similar solution so the MLE of γ must be found num erically . W e again e xpect γ = k /t b ecause this was a s sumed in the deriv atio n o f (7), although in some cases this is no t the be s t fit v alue. The explanatio n of this is not kno wn, though this very simple mo del is not exp ected to expla in every detail of the da ta. The cum ulative distribution derived from function (4) using the best fit (MLE estimated) γ v alue is plotted along with the o ut metric data in Fig. 3 . This fig- ure plots all o f the out-metrics for the same pr ogram, netbea ns-4.1 , and it can be seen that in the ma jority of cases the a greement with the data is rea sonably go od, even though the num ber of no des in the graphs for dif- ferent metrics v a ries widely . F urther examples a r e shown in the top half of Fig. 5, which sho ws the same metric, AC , for three differen t programs. Notice also that a fit of the ‘wr ong’ model distribution (the predicted in-deg ree distribution) do es not fit as w ell. Similar ly , the c umula- tive bes t-fit functions (7) for each of the in metrics for netbea ns-4.1 is plotted in Fig. 4, a nd for three different progra ms for the sa me metric ( AP ) in the bottom half of Fig. 5. Again, many data sets show g o o d agr eemen t, and the in-degree mo del fits the data muc h b etter than the out-degree model (solid curve). Co mparisons were made for all the metrics and pr ograms listed in Appendices A and B and Figs. 3, 4 and 5 a re fairly r epresent ative. An example of one of the b etter fits to a n out metric da ta set is shown in Fig. 7, and an example of a go o d in metric fit in Fig. 8. T o obtain a quantitativ e measure of how well the mo del fits the data , we follow the method o f [12] and calculate a p - v alue (the pro babilit y that the data were dr a wn fro m the prop osed distribution) bas ed on the Kolmogo ro v- Smirnov (KS) statistic [13] D = max | S ( x ) − F ( x ) | (10) where S ( x ) is the cumulativ e dis tribution function (CDF) of the data and F ( x ) is the CDF of the propo sed distri- bution (i.e. F ( x ) = P y ≤ x f ( x )). The fitted distribution is cor r elated with the data, so tr eating it a s the true dis- tribution will give a falsely high p -v alue. Instead we use a Monte C a rlo pro cedure, following [12]: A large num b er of synthet ic data s ets is dr a wn fro m the b est-fit distribu- tion, e a c h one is fitted individually and the KS statistic (relative to its own b est fit distribution) calcula ted for each o f these fits. The p -v alue is then the fra c tion o f these KS statistic v alues that are la rger than that found for the original fit to the real data. The p -v a lues ca lc ulated for the in metrics and out met- rics a r e tabulated in T able I. W e see that quan titatively , the fits a r e not par ticula rly g oo d. The go odnes s of fit for out metrics is particularly p o or. The in metrics are o ften 7 0 5 10 15 20 10 0 10 1 10 2 degree frequency columba−1.0: AC FIG. 7: AC for columba-1.0 , an example of an out metric distribution that is w ell fit t ed by th e mo del. 10 0 10 1 10 0 10 1 10 2 degree frequency derby−10.1.1.0: AP FIG. 8: AP for derby-10.1.1.0 , an example of a n in metric distribution that is w ell fit t ed by th e mo del. T ABLE I: N um b er of p -v alues greater than 0. 05 and 0.1 for the out-d egree and in-degree data sets. # p -v alues # p -v alues > 0 . 05 % > 0 . 1 % out-metrics 4 / 101 4% 4 / 101 4% in-metrics 9 / 44 20% 8 / 44 18% reasona bly well fit by the mo del, but where the fit fa ils, it is sometimes b ecause the degree one p oin t is lo w er than predicted – see for exa mple Doin v for netbean s-4.1 in Fig. 4. In other cases, the distribution app ears to b e a more pur e p o wer law than t he model function. Overall, the heavy tail of the in deg ree distribution pr edicted by the mo del is successfully obser ved. The mo del fits to o ut metric distributions are g enerally worse than thos e for the in metrics and often ha ve a more co mplica ted shap e, suppo rting the hypothesis that the difference b et ween the distributions is the dir ect pro g rammer interv ention in the out-degrees of types. The K S statistic is the maximum difference b etw een the mo del and data cumulative distr i- butions, and we see fr om Fig. 3 that although the shap es are similar, there is s eparation b et ween the t wo curves ov er part of the r ange in several cases, destr oying the quantitativ e g oo dness of fit. Nevertheless, the model ap- pea rs to fit man y of the curv es well or b e qualitatively in agreement for muc h o f the r ange. Two assumptions of the mo del are that t y pes gain edges at a rate pro portiona l to the existing num ber of edges, a nd that when a type is sub divided the redistri- bution o f edges b et ween the tw o r esulting t yp es is uni- form. If the selection of no des to which new edges are attached is uniform rather than linea r, the re sulting in- degree distribution has an exp onen tial tail, which is not the case in real soft ware graphs, so it a pp ears that it is necessary that the rate o f attachm ent of new edges to a no de sho uld dep end on the existing degre e of the node, though the explana tio n for this is not as clear as in the case of w ealth distribution or paper citation rates. In the current mo del, new types a re cr eated by remov- ing r e ferences (edges) fro m an existing type and plac- ing it in a new t yp e. It is equally plausible that a pro- grammer ins tea d c o pies re ferences, creating duplicates of edg es. If this is the case, and none of the edges ar e transferred to the new node the out-degr ee distribution has a ‘fatter ’ tail than the o riginal exp onen tial distribu- tion, but the ‘hea d’ of the distribution a lso bec omes muc h steep er, mea ning tha t this model fits the out-degree dis- tribution data very p o orly . Alternatively if the e dges a r e distributed betw een the tw o no des according to a bino- mial distribution (so that each edge is equally likely to be attac hed to either no de), the resulting o ut-degree dis- tribution has a dis tribution similar to an exp onential dis- tribution, and the in- degree distribution has a p o wer-law tail w ith a minimum exp onent of 3 . This is also incom- patible w ith the da ta, which typically hav e a pow er-law tail with exponent close to 2 . IV. DISCUSSION In this paper we hav e described a simple model of the g eneration of soft ware gra ph deg ree distr ibutions based o n the assumption that the pro cess of program- ming in volv es prog rammers making active choices ab out the structure of the type o n which they are working – in particular they are conscious of the ‘size’ of the t ype, and this co mes to b e r eflected in the resulting out-degr ee, while the in-deg ree of a type emerg e s indirectly as a result of the co nstruction of other types. The o nly difference betw een inco ming and o utgoing edges in the microscopic pro cess of the mo de l is that the splitting op eration on t yp es is dep enden t on type out-degrees and is indep en- dent of in-degree s . This model is extremely simple, and depe nds on a sing le para meter γ whic h ca n b e physically int erpreted as the recipro cal o f the average deg ree of the graph. T his sug g ests that the mean num b er o f de p enden- cies p er type (both incoming and outgoing) may prov e to be a useful statistic for c o mparing different type rela tion- ships and different programs. The mode l repro duces the 8 approximate shap es of in-degree and out-deg ree distri- butions for a range of g raph construction metrics applied to a v a riet y of Jav a pr ograms. This suggests that this shap e is due to s imple statistical pro cesses common to all soft ware graphs, so tha t any differe nces due to dif- ferent design methodolo gies and so on must b e sought in the details of the de v iations from this mean b ehavior. The ag reemen t of the pro posed mo del with the measured data is not p erfect ho w ever. These and other difficulties, such a s v ar iations b et ween the s hapes of distributions be- t ween progr ams and b et ween metrics indicates that there are higher-or der effects that remain to be describ ed. Degree distribution is one of the most acc essible mea - sures of the ‘shap e’ of a netw ork , but there ar e man y more meas ures such as degre e corr e lation, clustering co ef- ficient s and so on that can b e ca lc ula ted. F ur ther analys is of real data sets for such mo re detailed measures w ould help to discriminate b et ween and to refine the v arious generative models that have so far b een prop osed. An- other aven ue of inv estigation that w ould b e par ticularly fruitful w ould be a statistical analysis of the pro gram- ming pro cess as it happens, in order to identify the rates and pr obabilities of v arious a ctions, which could then b e compared with the assumptions of the mo del pr opos ed in this paper . Ackno w ledgment s W e w ould lik e to thank Hayden Melton for compiling the data use d in the a nalysis and Ewan T emp ero and James Noble for tec hnical advice a nd helpful discussio ns. APPENDIX A: METRICS Brief desc r iptions of the metric s used in the study are listed b elo w. F o llo wing [1, 7] short co des a re used throughout the text to refer to ea c h metric. F o r more complete desc r iptions of the metr ics and how the data was extr acted from the source co de, see [1 ]. Some of t he metric s are paired, with one representing the ‘in’ degree (listed first) and a nother representing the recipro cal ‘out’ degree. In general an ‘out’ metric for a t yp e co un ts things that would a pp ear in the co de for that t yp e, while ‘in’ metrics count references to a t yp e which app ear in the co de for other types. Some o f the metrics hav e no r e ciproca l metric, but ca n still b e identified as measuring either ‘in’ or ‘out’ deg ree. The r emaining met- rics used in [1] w ere not included in the a nalysis as their in/out status was not clear or they were a mixture of in and out measures. ‘In’ me tr ics AP References to class as a me m b er. F or a g iv en t yp e , the n um b e r of top-lev el t yp es (including it- self ) in the source that ha ve a field of that t y pe. DOinv Dep ends On i n verse. F o r a given t yp e , the nu mber of type implemen tations in whic h it ap- pea rs in their source. PP References to class as a parameter. F or a g iven t yp e , the num b er of top-level t yp es in the source that declar e a metho d with a parameter of that t yp e. RP References to class as r eturn t yp e. F or a giv en t yp e , the num b e r of top-level c la sses in the so urce that declare a method with tha t type as the return t yp e. SP Sub classes. F or a given class , the n umber of top- level c la sses that sp ecify that cla ss in their exten ds clause. ‘Out’ metrics AC Mem b ers of c lass ty p e. F or a given type , the size of the set of t y pes of fields for that t ype . DO Dep ends on. F or a given t yp e , the num b er o f top- level t yp e s in the s ource that it needs in orde r to compile. PC P arameter-type class references. F o r a giv en t yp e , the size of the set o f type s used as para meters in methods for that type. PubMC Public Metho d C oun t. The num b er of meth- o ds in a type with public access t yp e. RC Metho ds returni ng classes. F or a given type , the size o f the s e t o f types used as retur n types for metho ds in that type. nC Num b er of Constructors. F or a given class , the nu mber of co nstructors of all acc e s s t yp es declar ed in the class. nF Num b er of Fields. F or a given t yp e , the num ber of fields of all a ccess t ypes declar e d in the type. nM Num b er of Metho ds. F or a given t yp e , the num- ber of all metho ds of all acces s t yp es (that is, pub- lic, protected, pr iv ate, pack age pr iv ate) declared (that is, not inherited) in the t ype. pkgSiz e P ac k age Size. The num ber of types con- tained direction in a pack age (a nd no t co n tained in sub-pack ages). 9 APPENDIX B: APP LICA TIONS The prog rams studied, their size (num b er of Classes), domain and where they were sourced are: Applic ation #Cla sses Domain Origin Notes eclipse-SDK-3.1 -win32 11413 IDE www.eclipse.org Donated by IB M netbea ns-4.1 8406 IDE netb eans.org Donated By Sun jre-1.4.2 .04 7257 JRE sun.com jbo s s-4.0.3-SP1 4143 J2EE server Sourceforg e op enoffice-2.0.0 2925 Office suite op enoffice.org Donated By Sun jtopen- 4.9 2857 Jav a toolb ox for iSeries and AS/400 servers Sourceforge Donated by IBM geronimo- 1.0-M5 1719 J2EE server Apache azureus-2 .3.0.4 16 50 P2P filesha ring Sourceforg e derby-10.1.1.0 1386 SQL database Apache Jak arta Donated b y IBM compiere-25 1e 1372 ERP and CRM Sourceforg e argouml- 0 .18.1 12 51 UML dr a wing/critic tigris.or g columba-1.0 1180 Email client Source fo rge [1] G. Baxter, M. F rean, J. Noble, M. Rick erby , H. Smith , M. Visser, H. Melton, and E. T emp ero, in Pr o c e e dings of the 21st Annual A CM SIGPLAN Confer enc e on Obje ct- Oriente d Pr o gr amming, Syst ems, L anguages, and Appli- c ations , edited by R . Johnson and R. P . Gabriel (ACM, 2006), in press. [2] Y . Dong, Q . Guo-Ning, and G. Xin-Jian, Chinese Physics 15 , 2489 (200 6). [3] C. R. Myers, Physi cal R eview E 68 , 04 6116 (2003). [4] A . Pota nin, J. Nob le, M. F rean, and R . Biddle, Commu- nications of the ACM 48 , 99 (2005). [5] S . V alverde and R. V. Sol ´ e, Europhysics Letters 72 , 858 (2005). [6] D . de Solla Price, Journal of t h e American So ciet y for Information Science 27 , 292 (1976). [7] R . Wheeldon and S. Counsell, in Thir d IEEE I nte rna- tional Worksho p on Sour c e Co de Ana lysis and Manipu- lation (SCAM03) (2003). [8] S . V alverde and R. V. S ol ´ e, Physica l R eview E 72 , 026107 (2005). [9] G. Concas, M. Mar chesi, S . Pinna, and N. Serra, IEEE T ransactions on Soft w are Engineeri ng 33 , 687 (2007). [10] P . L. Krapivsky and S. Redn er, Physical Review E 71 , 036118 (2005). [11] O. E. Ba rnsdorff and D. R. Cox, Infer enc e and Asymp- totics , Monographs on Statistics and App lied Probabilit y (Chapman and Hall, London, 1994 ). [12] A. Clauset, C. R. Sh ali zi, and M. E. J. Newman, Preprint, arXiv:0706.1 062 (2007). [13] M. K endall and A. Stuart, The A dvanc e d The ory of Statistics , vol. 2 (Charle s Griffin, 1979), 4th ed. [14] Our con ven tion. Y an et al. use the opp osite co nv ention for th e d irectio n of edges in the graph. [15] The split prop ortions r and s are chosen from different ranges t o ensure that all nodes h a ve at least one in- and one out- link after the n ew edge from m to k + 1 is added .
Original Paper
Loading high-quality paper...
Comments & Academic Discussion
Loading comments...
Leave a Comment