Applying Software Defect Estimations: Using a Risk Matrix for Tuning Test Effort
Applying software defect esimation techniques and presenting this information in a compact and impactful decision table can clearly illustrate to collaborative groups how critical this position is in the overall development cycle. The Test Risk Matri…
Authors: ** James Cusick (Wolters Kluwer, j.cusick@computer.org) --- **
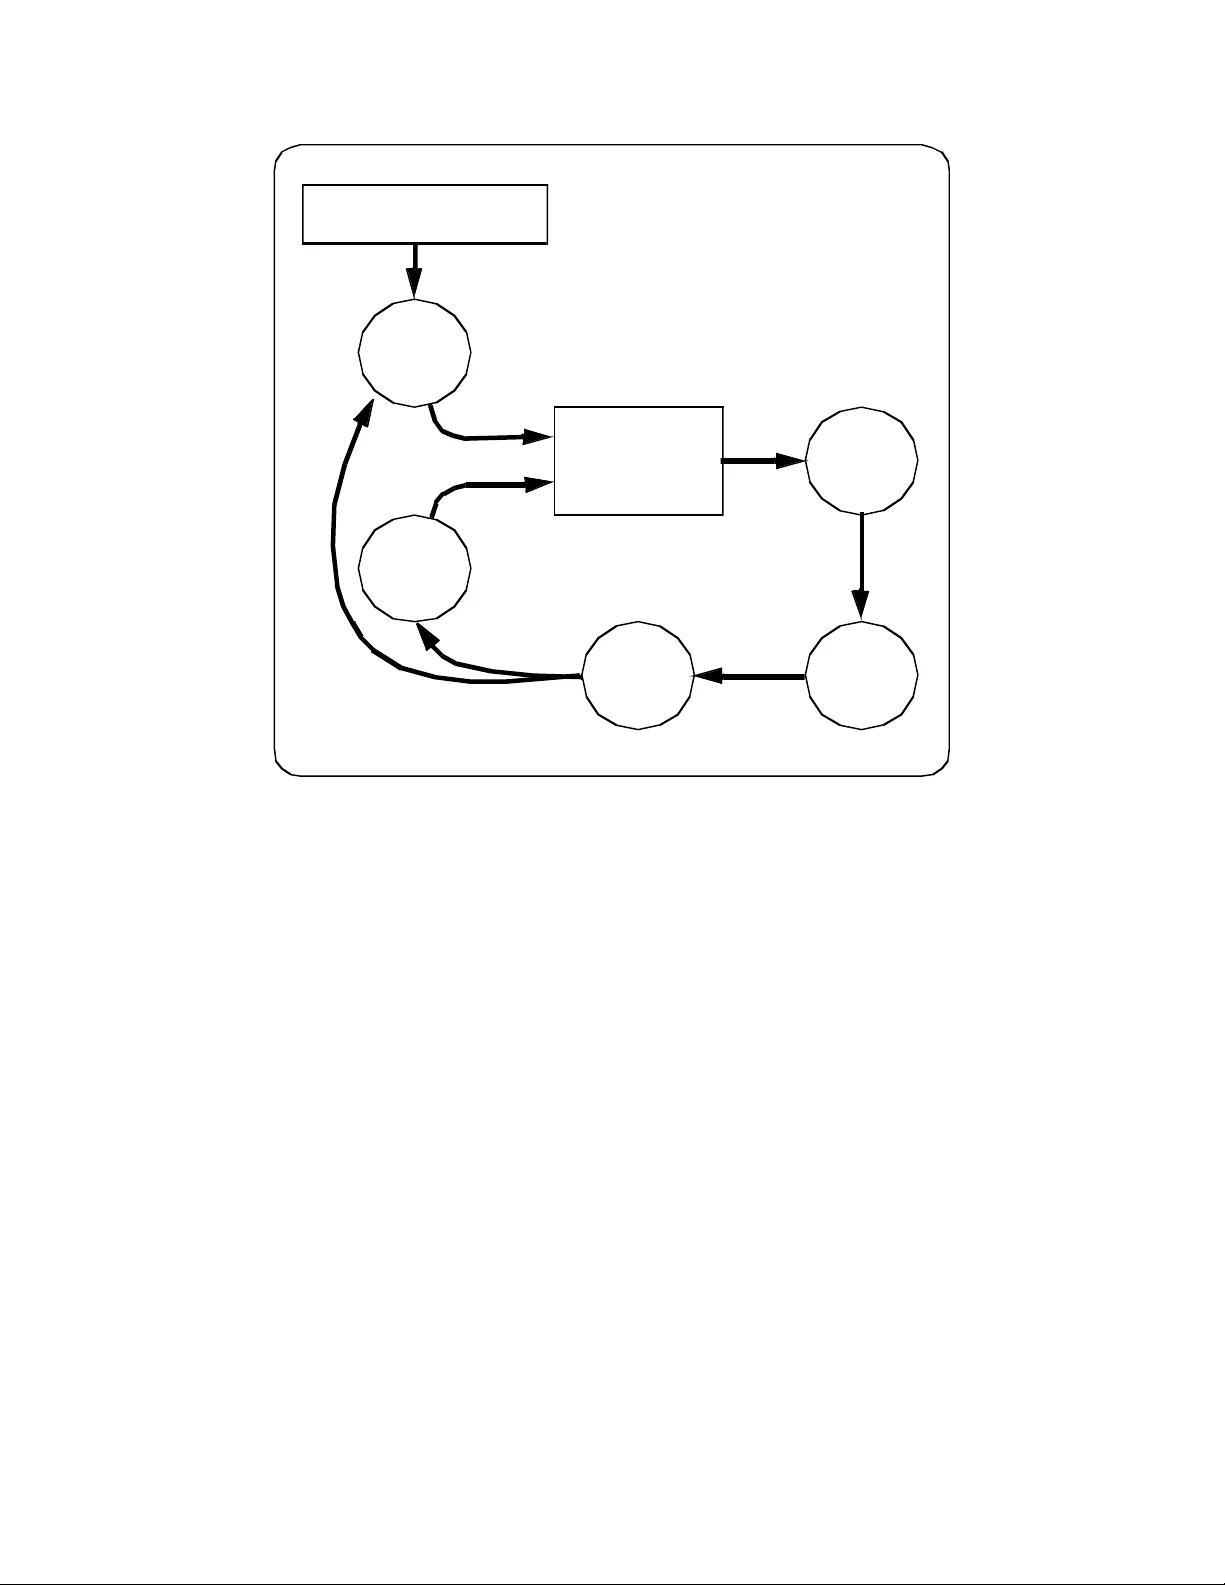
1 Applying Software Defect Estimations: Using a Risk Matrix for Tuning Test Effort James Cusick Wolters Kluwer j.cusick@computer.org ABSTRACT Applying soft ware defect estimati on techniques and presenting t his informati on in a compact and impactful decisio n table can clearly illustrate to co llaborative groups how critical this position is in the overall development cycle. The Test Risk Matrix described here has prove n to be a valuable a ddition t o the manage ment to ols and a pproaches used in developing large scale software on several releases. Us e of this matrix in development planning meet ings can clari fy the attenda nt risks and possibl e consequences of carrying out or bypassing specific test activities. KEY WORDS Quality Assurance, Software Testi ng, System Testing, Defect Prediction, Risk Management, Process Tuning INTRODUCTION Managing so ftware system testing som etimes l ands technic al staff firm ly between a r ock and a ha rd place. On the one hand devel opment overruns t end to cut into sc heduled t est tim e in order t o meet pr oduct delivery com mitments. On the other han d professi onal duty calls for extensi ve testing to u ncover bugs before release. Applyin g software defect estim ation tec hniques a nd presenti ng this i nformati on in a compact and impactful decision table can clearly illustrate to co llaborative groups how critical this position is in the overall dev elopment cycle. DEVELOPMENT TUNING APPROACHES In developm ent shops wi th well defi ned processes s ometim es the steps required t o produce s oftware can stretch out interminably. Not all software development e fforts call for each step in a process to be carried out. In some cases a tailored developm ent approach is crafted for each software proje ct. DeGrace (1990) covers some of th ese approaches. One approa ch at NASA is called NASA -NMI-5330.1. Th is approach categorizes the planned software on 10 characteristic s. The overall grade of the software can the n be plugged i nto a Software Assurance Pract ices Grid i ndicating which qual ity practi ces are recomm ended. 2 Another de velopm ent planni ng ma trix describe d by De Grace is DO D-STD-79 25. In thi s approa ch a complexity assessment matrix is used to assign a complexity ranking to any software system. Based on that rating a mi nimum docum entation grid is us ed to dete rmine what doc uments shoul d be prod uced with the software. These plannin g tools provi de som e helpful guidance i n develo pment tuni ng for docum entation an d quality assurance activities but do not cover system testing activ ities. Further, these processes rely somewhat on subjective considerations su ch as if the design is complex or simple. SYSTEM TEST RISK MA TRIX During the management of som e recent releases of software our tea m found a useful application of software developm ent estimations in the selection of syst em test proce dures. The Test Level M atrix proved helpful in clearly identifying which test activ ities woul d and would not be conducted. Specifically, this grid provided a sim ple comm unication to ol for u se with othe r develo pment manage rs in neg otiating the risks of not conducting certain tests or of cutting the test cycle. This risks were clearly enunciated in ter ms of defects not fou nd by a shorte r test cycle and thereby an increase i n the number of defects delivered to the field. This application appears to bu ild on the work n oted above done by NASA and DOD but driv es into the new area of system test tuning. Process Integration of The Test Risk Matrix The Test Risk Matrix combines information from soft ware developm ent estimates and the softwa re testing process to project the number of de live red defects for a software system release based on t he intensity or level of testing carried ou t. Figure 1 below represents the information flow in the application of the Test Risk Matrix. Once system requirem ents are known and es timates of software size can be calculated the Test Risk Matrix ca n be applied. Placing the sta ndard test ing procedures in a table all ows for a decisi on to be made on what level o f testing will be conducted . Upon completion o f testing improvemen ts can be made to the understanding of the test process and future so ftware estimations. The Test Risk Matrix Details The Test Risk Matrix attempts to succin ctly bring to light the risk , in terms of delivered defects, asso ciated with choosing a particular tes ting schedul e or coverage stra tegy. The cont ents of the Test Ri sk Matrix cover key characteristics of typical system test efforts. The first table is the Test Risk Matrix and the second table is the Test Scope Matrix. The Scope row shown in Table 1 is decomposed in Table 2 to provid e test scalability and to maintain simplicity in Table 1. Each element of the Test Risk Matrix is d efined below. Each element is either a "Standa rd " element or a "Custom" element. Standard elem ents generally do not change in value fr om applicati on to applica tion. Cust om elements need to be calculated spe cifically for each application of the Test Risk Matrix. 3 SYST EM R EQ U I R EMEN TS Soft w are Estima t i o n Te s t Me t h o d s T est R i sk Matrix T e st L e ve l D e ci si o n T e st Execu t i on Te s t Re s ult s Fi g ur e 1 - P r oc es s I n t eg r a t i o n o f T h e T e st Ri sk M at r i x Figure 1 TEST SCOPE: Test process activities as expressed in te rms of features, sanity su ites, reg ression suites, destructive tests, stress t ests, and fiel d verificati on. Each scope i ncorporates di fferent com b inations of te st process activities. See the Test Level Matrix below for specifics. STANDARD ELEMENT. INTENSITY: An expression of how the test scope tra nsl ates into actual test execu tion on a subjective scale. STANDARD ELEMENT. ENVIRONME NT: Employ existing eq uipment or a dd new t est infrastruct ure such as a dditional computi ng equipment , additional a utomated t ools, and wider use of statisti cal analysis. STAND ARD ELEMENT. STAFF, STAFF WEEKS, CALENDAR WEEKS: The number of staff i n technical head count, the number of combined staff wee ks, and the num ber of calendar weeks neede d for a given l evel of testi ng. CUSTOM ELEMENT. PREDICTED DEFECTS: The number of defects projected to be in the software at t he begin ning of the system test phase. CUSTOM ELEMENT. DEFECT REM OVAL EFFICIENC Y (DRE): The percen t of defects removed be fore del ivery to the fi eld. Normally this can never reach 100% . STANDARD ELEMENT. DELIVERED DEFECTS ( DD): The num ber of software de fects delivered to the fi el d after system test. Normally this can neve r reach 0. C USTOM ELEMENT. 4 TEST RISK MATRIX TEST LEVEL MINIMA L LOW MEDIUM HIGH EXTENSIV E TEST SCOPE A B C D E INTENSITY LIGHT LIGHT MEDIUM STRONG STRONG ENVIRONMENT Existing Existing Existing Enhanced Enhanced STAFF STAFF WEEKS CALENDAR WEEKS PREDICTED DEFECTS DRE 10% 30% 60% 85% 95% DELIVERED DEFECTS Table 1 – Test Risk Matrix The Test Scope Matrix The Test Scope Matrix is used in con junction with the Test Risk Matrix o utlined above. The Test Scop e element of the Test Risk Matrix relies on the construction and tu ning of a Test Scope Matrix in order to gauge the test process steps consider ed for execution in the system test phase. This tab le takes as input standard testing activities as governed by development guidelines. These steps are arrang ed in the grid with inclusion and/ or covera ge characteristi cs. This gird ca n be expande d in either direction by adding new scope levels or "gray scales" along the top axis or by adding furt her test activities along the other axis. The Test Scope Matrix belo w in Table 2 repr esents a simplifie d version of an actual Test Scope Matrix. Potential expansion of the test steps could includ e usab ility testing, security testing, performance testing, storage testing, configuration testin g, reliability tes ting, do cumentation testing. Definition of these an d other test process steps can be found in Meyer s (1979). SCOPE A B C D E Sanity Yes Yes Yes Yes Yes Features Subset Changed/New Most All All Regression No No Minimal Good Complete Stress No No No Good Complete Load No No Minimal Good Complete Table 2 – Test Scope Matrix 5 DERIVING ESTIMA TES FOR THE MA TRIX In order to enli ven this decision m atrix requires estimations of t he developm ent effort of the system unde r consideration for t est process tunin g. Estimati ons can flow from a variety of sources and m ay come far in advance of the initiation of th e system test phase or th ey can come "just-in-time" as system test begins. Estimates for new projects or for delta releases bo th find application in these decision tables. Software and Staff Estimates Size metrics or functional metrics can be applied in the Test Risk Matrix. The key d ata elements required are the approximate num ber of defects expected to be found, the defect removal efficiency, and the amount of staff effort re quired to con duct the test phase. The wo rst case estim ates should be arrived at first and then scaled down incrementally to fit th e Test Risk Matrix . Staffing estimat es often requi re heuristic methods of calculation but historical data on te st case execution rates are the prefer red method . Arriving at defect estimates can be done usi ng historical dat a or if nece ssa ry use of simple mathematical formulas com bined with industry average defect coun ts can serve the purpose just as well. Two such methods are briefly outlined in the following sections. Defect Prediction Methods Historical dat a rema ins the superi or met hod of defect predic tion. Orga nizati onal vagarie s such as st aff skill and process sophist ication can st rongly influe nce the rate of de fects in any soft ware product . When historical defe ct data is not available a Func tion Point co unt or estim ate can provide d efect predict ions for insertion into the Test Risk Matrix. Calculating Functio n Points for a retrofit requires taking the size of the system i n LOC divided by a predefi ned source statem ent per functi on point valu e and adjustin g for complexity (Jones, 1991).Tak ing the functi on point value and using publis hed industry a verages of def ects per function p oint provides a very rough defect estimate for any software release. Other me thods of defect prediction require onl y LOC and som e defect adjustment parame ters to calculat e inherent a nd predi cted defects (Musa, 1987). Once again if historical data is no t available substitutio n of published averages can be used as a starting point for su ch values as de fects per KLOC. Defect Removal Efficiency or Test Effectiveness Defect Removal Efficiency (DRE), or its corollary Test Effectiveness in the test phase provid e, the risk portion of the Test Risk Matrix. By d isplaying in the matrix th e projected DRE of a set of test pr actices the full im pact of phase tu ning decisi ons can be vi sualized. Using the f ormula belo w provid ed by Card ( 1990) the DRE of past defect removal activities can be arrived at for use in the matrix. E = N/(N + S) where E = effectiveness of activity N = number of faults (defects ) found by activity S = number of faults (defects) found by subsequent activ ities 6 TEST PROCESS INPUT In introducing the composition of the Test Sco pe Matrix ea rlier a variety of test procedures were listed. It is beyond the scope of this paper to discu ss in detail these test types or how to arrive at which tests to condu ct for a given sof tware product. B ased on the developm ent standards of the organizatio n, a catalogue of test types should be available for consid eration when custom izing the Test Scope Matrix for a software release. The Test Scope Matrix does not appear limited in th e number of test types which it can include nor does it appear constrai ned in the le vels of g ray scaling whic h might be a pplied. T his custom ization is best worked out by the test specialist in advance of using the Test Risk Matrix, however, it has been found that adjustments to the inclusion properties of some test ac tivities within the Test Sc ope Matrix ca n be carri ed out swiftly during negotiations on selection of a testing level. AN EXAMPLE OF USING THE TEST RISK MA TRIX Putting the matrix to work on a simple example may assist in understand ing the manner of its applicatio n. Consider a ne w software product esti mated at 100,000 LOC or a pproxi mately 80 0 Function Points i n its early stages. Estim ates of defects could range from 650 t o as much as 1400 at t he time the system ente rs system test. Applying a sliding scale of DRE to these de fect estimates, as the tables bel ow indicate, brings us to the "bot tom li ne" of software deve lopment and testing: Delivered Defects. TEST RISK MATRIX TEST LEVEL MINIMAL LOW MEDIUM HIGH EXTENSIVE TEST SCOPE A B C D E INTENSITY LIGHT LIGHT MEDIUM STRONG STRONG ENVIRONMENT Existing Existing Existing Enhanced Enhanced STAFF 2 2 4 5 5 STAFF WEEKS 6 12 32 60 80 CALENDAR WEEKS 3 6 8 12 16 PREDICTED DEFECTS 800 800 800 800 800 DRE 10% 30% 60% 85% 95% DELIVERED DEFECTS 720 560 320 120 40 Table 3 – Test Risk Matrix Example TEST SCOPE MATRIX SCOPE A B C D E Sanity Yes Yes Yes Yes Yes Features Subset Changed/New Most All All Regression No No Minimal Good Complete Stress No No No Good Complete Load No No Minimal Good Complete Table 4 – Test Scope Matrix Example 7 FUTURE DIRECTIONS The strength of the Test Level Matrix comes from th e clear indicator of risk for each test level choice presented in the matrix. Work should be done on cer tifying the defect predictions and the success rate in delivering the projected num b er of defects. Furthe r use of quantitative m ethods in aligning the test procedures could ad d rigor to the overall approach. An addition al predictive value of software reliability might also find a place in the Test Risk Matrix alo ng with Deliverd Defects. Finally, a link coul d be established from the develo pment tuning grids mentioned ab ove and the Test Risk Matrix. Such a link could clarify, f or example, the additi onal test time required if certain deve lopment st eps were clipped from the process, or the conver se, how m u ch test tim e can be save d by adding to the development stages. CONCLUSIONS The Test Risk Matrix has proven to be a valuable add ition to the management tools and appro aches used in developing lar ge scale software on several releases. Us e of t his matri x in developm ent planning m eetings can clarify the at tendant ri sks and possi ble conse quences of carryi ng out or bypassing s pecific te st activities. With a minimum of preparation th ese tables can be con structed and modified for use on any project actively applying sta ndard softwa re metri cs. In gearing up a software metrics program this matrix provides an early opportun ity to demonstrate the ap plicability of software metrics in a decision support role. REFERENCES 1. Card D. N., and Glass, R. L., Measuring Software Design Quality, Prentice-Hall, 1990. 2. DeGrace, P., and Stahl, L. H., Wicked Problem s, Righteous Solu tions: A Catalogue of Modern Software Engineering Paradigms, Yourdon Press, 1990. 3. Jones, C., Applied Software Measurement: Assuri ng Productivity and Quality, McGraw Hill, Inc., New York, 199 1. 4. Musa, J. D., Iannino, A., and Okumoto, K., Software Reliability: Measurements, Prediction, Application, McGraw-Hill, 1987. 5. Meyers, G. J., The Art of Software Testing, J ohn Wiley & Sons, Inc ., 1979.
Original Paper
Loading high-quality paper...
Comments & Academic Discussion
Loading comments...
Leave a Comment