A System for Predicting Subcellular Localization of Yeast Genome Using Neural Network
The subcellular location of a protein can provide valuable information about its function. With the rapid increase of sequenced genomic data, the need for an automated and accurate tool to predict subcellular localization becomes increasingly importa…
Authors: Sabu M. Thampi, K. Ch, ra Sekaran
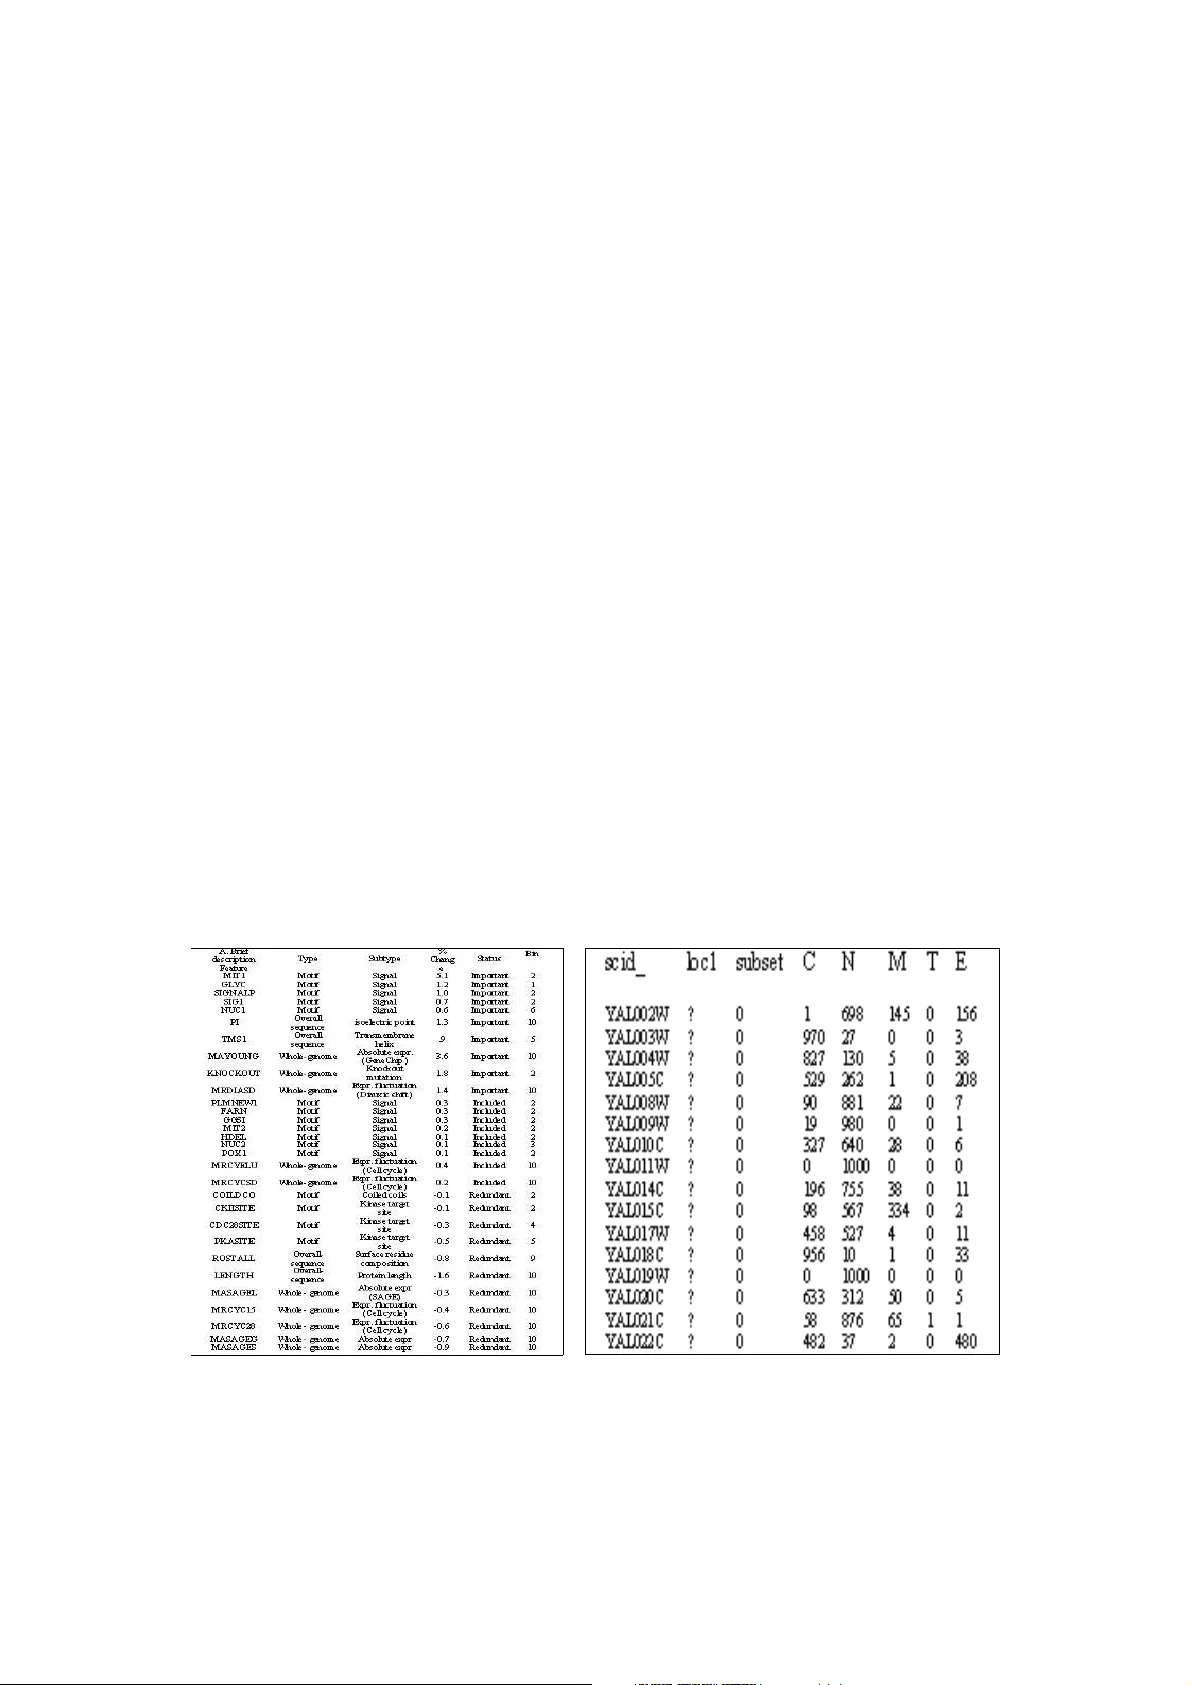
A SYSTEM FOR PREDICTING SUBCELLULAR LOCALIZATION OF YEAST GENOME USING N EURAL NETWORK Sabu M. Tha mpi # , K . C han dra Sek ara n $ # Dept. of Computer Science & Engineering, L.B.S College of Enginee ring, Kas aragod E-mail: smtlbs@yahoo.co.in $ Departme nt of Comp uter Engineering, National Institut e of Technology Karn ataka E-mail: kch@ ni tk. ac.i n Abstract: The subcell ular location of a pr otein c an provide valuable informat ion about its function. With the rapid i ncreas e of sequenced genomic data, the need for an aut omated and accurate t ool to predic t subcellul ar localizati on becomes incre asingly i mportant . Many efforts have been ma de to pred ict protein subcel lular loca lization . T his pa per aims to merge the artific ial neural networks and bioin formati cs to pr edict the locat ion of prote in in yeast genome. We introduce a new subcell ular predictio n method based on a backprop agation neural network. The results show that the prediction within an error limit of 5– 10% c an be achieved with the system. Keywords: Neural networks, B ackpropagati on, Protein, Subcellular Localizat ion INTRODUC TION A protein is a very large biological molec ule composed of a chain of smaller mole cules called amino acids. Thousands of diff erent proteins are present in a cell, the synthe sis of each type of protein bein g directed by a diff erent gene. Prot eins make up much of th e cellular structu re. Proteomics is concer ned with qualita tive and quantit ative s tudies of gene expressi on at the level of the functional protei ns themselves. Proteomi cs inc ludes the identif ication, chara cteriza tion and quant ization of the entir e complement of proteins in cells with a view to understa nding their func tion in relati on to t he life of the cell. An are a of protein characteriz ation tha t it consider ed particu larly usef ul in the post- genomic s era is t he study of prot ein localiza tion. In order to functio n properly, protein s must be transpor ted to va rious localiz ation sit es w ithin a par ticular cell. Descrip tion of protein localiza tion provides infor mation about each pro tein that is complemen tary to the protein sequence and struc ture data. The abili ty to identif y known proteins with similar sequence and simila r localizat ion is becoming increasing ly importan t, as we need struc tural, fun ctional and localiza tion informa tion to accom pany the raw sequences. The f irst approach for predicti ng the lo calizat ion sites of proteins fro m their amino acid sequence s was an expert system developed by Nakai and Kanehi sa [6 , 7]. Later, expert ident ified featur es were combined with a probab ilisti c mode l, which could lea rn its parameter s fro m a set of tra ining data [5]. Better predictio n accura cy has been achieve d by using standard classi ficati on a lgorithms such as K nearest nei ghbors (KNN), the binary decis ion tree, neur al network and a nave Bayesian classifi er. This paper p roposes a neural network- based approach for the subcellul ar local izatio n of proteins. The paper is organized as follows. F irst we briefl y descr ibe the datab ases. Next we introduce variou s features. Next section demons trates the system . This is followed by resu lts and discus sion sect ion. Concl usion is given fin ally. D A T A B ASES The required database f or locali zation is collected from the website http://b ioinfo. mbb.yale .edu/genome /locali ze . There are four databa ses: Localiz ed-465, Localized- 704, Localized- 1342, and Localized- 2013. We ha ve selected the database Localized- 1342 beca use this datas et g ives the best balance between overall quality and the number of protein s and it largely avoids the circu lar val idation problem. The Localized -1342 set is div ided into seven subsets, each conta ining ~190 protein s. The proteins in each subse t are sel ected random ly. E ach prot ein belongs to only a single subset, and ther e a re no duplicat ed proteins in any subset . The protei ns in the Localiz ed-1342 dataset are mainly ass ociated with 12 subcellula r compartme nts (Ta ble 1) [1]. However, many of these comp artment s contain only a very small number of prot eins, greatl y skewing t he statisti cs. Hence, the 12 compartm ents are coll apsed into five new “gener alized” compart ments. The compar tments are th e nucleu s (N), mitochondr ia (M), cytopl asm (C), membran e (T for transmem bran e), and secret ory pathway (E for endopl asmic reticulu m or extracel lular) . State vector database cont ains the pro babilit y s tate vector, which has 5 components, e ach one giving the probabilit y that a prote in can be found in the corresponding subcellular compart ment. An example for the state vector of the prot ein, YAL001C is shown in Table 2. Here the first column i ndicates the name of the protein; se cond column indicat es the actual compart ment into which the protei n is locali zed. Third colum n indicate s the subset to which the protei n belongs. The next five columns show the initia l probabil ity of the protein to be in the five location s stated ea rlier i.e.; C, N, M, T, and E. (In that dataset the values are given after multipl ying by 1000).In the above exampl e t he probabi lity of the protein to b e in the location C is 0.001 and that in N is 0.997 and that in M is 0.0 and so on. In the feature vector dataset , for each vector ther e are five rows in the feat ure vector dataset, each one correspondi ng to C , N, M, T and E respective ly. The va lue in each row shows the numb er of proteins in t hat compart ment tha t possess the fea ture. Each compon ent of the feature vector equals the fr action of the t otal number of prote ins in tha t compa rtmen t possessing that feature. Table 1. Collapsed Comp artment s Table 2. State vector of YAL001C 2.FEA T URES Table 3 lists the featur es that are used in the system [1]. A tot al of 30 fea tures are used. The features are first divided into three categori es depending on the informati on they were derived from : (i) motif s (16 features ); (ii) over all- sequence (four features) ; and (iii) wh ole- genome (ten featu res). The 30 featur es a re subdivided into three groups, depending on how much they contr ibuted to the overa ll predictive strength of our syste m: the ten most importan t fea tures, nine other included feature s and 11 redundan t fea tures. For all the result s reported here, the 11 redundant featu res are excluded and bas ed our system on the best 19 features. For each feat ure, the pr oteins are divided into a speci fic number of bins according to th e differe nt values. Each bi n can be used as a separat e feat ure, and creat ed a separate feature vector for each bin. The state v ector of a protein is updat ed with feature vector of the bin it belongs to. DEMONSTRA TING THE PROPOSED SYS TEM Five pri or st ate vec tors and five feat ure vectors are used. There are 10 nodes in the input layer. The output lay er consists of five nodes sinc e we need the probabili ty of the protein to be in the five compartmen ts C, N, M, T and E. The hi dden layers are selec ted by trial and error. The data is nor malize d so that it lies between 0 and 1.If the probabili ty for a location in a feature vect or is 0, or if a comp onent of the stat e vector becom es 0 (after norma lizi ng) while updati ng, the probabi lity for the corr esponding location in the result ant st ate vector will always be equal to 0. A pseudo-count of 0.0001 i s added to all state vector components that are equal to 0, each time the stat e vector is up dated. The tra nsfer functio n used i s sigmoid. The network is trained using the first six subsets of the lo calized -1342 datas et whose compart ment of local ization is previou sly known. During cros s-vali dation it is observed that the additio n of some feature s with redundant informat ion decr ease the overa ll predic tion accuracy. Hence we have sele cted only 13 features which raise the predict ion accuracy. Table 3 summarizes the degree t o which each feature raised or lowered the pr ediction accuracy when it is added to or subt racted from our system. This gives a rough measure of the “inform ation content ” of t he feature. In the training phase we took each protein one by one and applied 13 featur es one at a time. The desired out put is t he updated st ate vecto r after applying that parti cular feature. The actual output is the updated s tate vector obtained after ap plying that feature. The first feature is appl ied t o the prior state vector of the protein obtain ed fro m the state vector da taset. Let P be a protein having state vector S(C, N, M, T, E) and X be the fi rst feature applied to P. The inputs and output relations hip is as shown in fig. 1. From the second fea ture onwards, the features are applied on the updated state vector obtained from applying the pr evious feat ure. Let Y be the next fea ture applied af ter X a nd l et U(C, N, M, T and E) be t he updated state vector obtained from apply ing feat ure X for protein P. The deta ils are shown in fig. 2. This proc ess is repeat ed for all the 13 feature s. The updated state vector after the applicati on of the 13 featu res will give us the actual location of the protein. The component of the state vector with t he highest value will be the actual loca tion of the protein. F or example, i f the updated state vecto r is (0.04, 0.07, 0.8, 0.03, 0.06), the p rotein is localized to the compart ment M i.e. Mitochon dria. At first the difference between the desired output and the actual outpu t is huge and hence the mean squ are error is a lso large. Slowly t he err or comes down as the number of iteration s thro ugh t he prote ins is increased. The network is trained repeatedl y by changin g the learning rate and momentum until we get c onverged. Once the network is trai ned compl etely, th e p redicted location i s ma tching with the actual location of the protein speci fied in t he dataset . The demonst rated system has p redicted the location of the proteins whose actual location is not known accurat ely. The detail s of a few of these pro teins are liste d in t able 4. RESUL TS AND DISCUSSION The proposed protei n locali zatio n predic tion s ystem was implem ented using C languag e. To make the soft ware user friend ly, we have provided a graphical user interfac e in Visual Basic. A few screen shots are shown in figu res 3, 4, and 5. Fir st use r selec ts a protein. The r esult will be disp layed in a ba r chart form. The results show that the predicti on within an error limit of 5– 10% can be achieved with this met hod. This performan ce is higher than the Bayesian appr oach. Bayesian appr oach is able to pre dict onl y up to 75% accuracy on individual protei n predic tions. Table 3. Featu res Table 4: P roteins with Unknown Locali zation s Fig. 1. Neural network output after applying state vecto r S and feature P Fig 2. Neural network output afte r applyi ng updated state vector U and featu re Y CON CL USION An automati c, r eliabl e and efficient pr ediction syst em for protei n subcel lular local izati on is needed for large- scale genome a nalysis. In this paper, a new method for protein s ubcellular localiza tion predict ion is presente d. The network was train ed and te sted with data for predictin g protein localizat ion in yeast genome. The syste m is able to predict the location of the protein s whose actual locatio n is unknown. The demonstra ted method provide s superior predictio n perfor mance as compare d to Bayesian met hod. Fig 3. User Inte rface Fig 4. User Selects a Protein Fig 5. Result in a bar chart form REFEREN CES [1] Amar Drawid, Mark Gerstei n., A Bayesia n System for Integra ting Expression Data with Sequence Patterns for Localizing Protei ns: Comprehens ive A pplication to the Yeast Genome, http: //pap ers.ger steinla b.org/e- print/bay esloc- jmb/t ext.pdf. [2] Cairns, P. Huyck, et .al, A Comparison of Categor izatio n Algor ithms for Pre dicting the Cellular Locali zation Sites of Protein s, IEEE Engineering in Medicin e and Biology, pp.296-300, 2001. [3] B. Yegnananaraya na., Artifi cial Neural Networks, Pr entice-H all of India Pvt. Ltd., 2001. [4] Simon Haykin, Neural Networks – A Compreh ensive Foundati on, Addison Wesley Longman (Sin gapore) Pte. Ltd., 2001. [5] Horton, P., and Nakai K., A pr obabilis tic classifi catio n system for predicti ng the cellular localiza tion sites of protei ns, Proceedings of the Fourth In ternati onal Conference on Intellig ent Syst ems for Molecu lar Biol ogy, pp.109- 115, 1996. [6] Nakai, K. and Kanehisa, M, E xpert system f or pre dicting pro tein locali zation s ites in gram-nega tive bacteria, PROTEINS, pp.95- 110, 1991. [7] Nakai, K. and Kanehisa , M, A knowledge bas e for predic ting protein local izati on sites in eukaryoti c cells, Genomics, pp.897- 911, 1992.
Original Paper
Loading high-quality paper...
Comments & Academic Discussion
Loading comments...
Leave a Comment