A Review of Accelerated Test Models
Engineers in the manufacturing industries have used accelerated test (AT) experiments for many decades. The purpose of AT experiments is to acquire reliability information quickly. Test units of a material, component, subsystem or entire systems are …
Authors: ** *저자 정보가 논문 본문에 명시되어 있지 않음* **
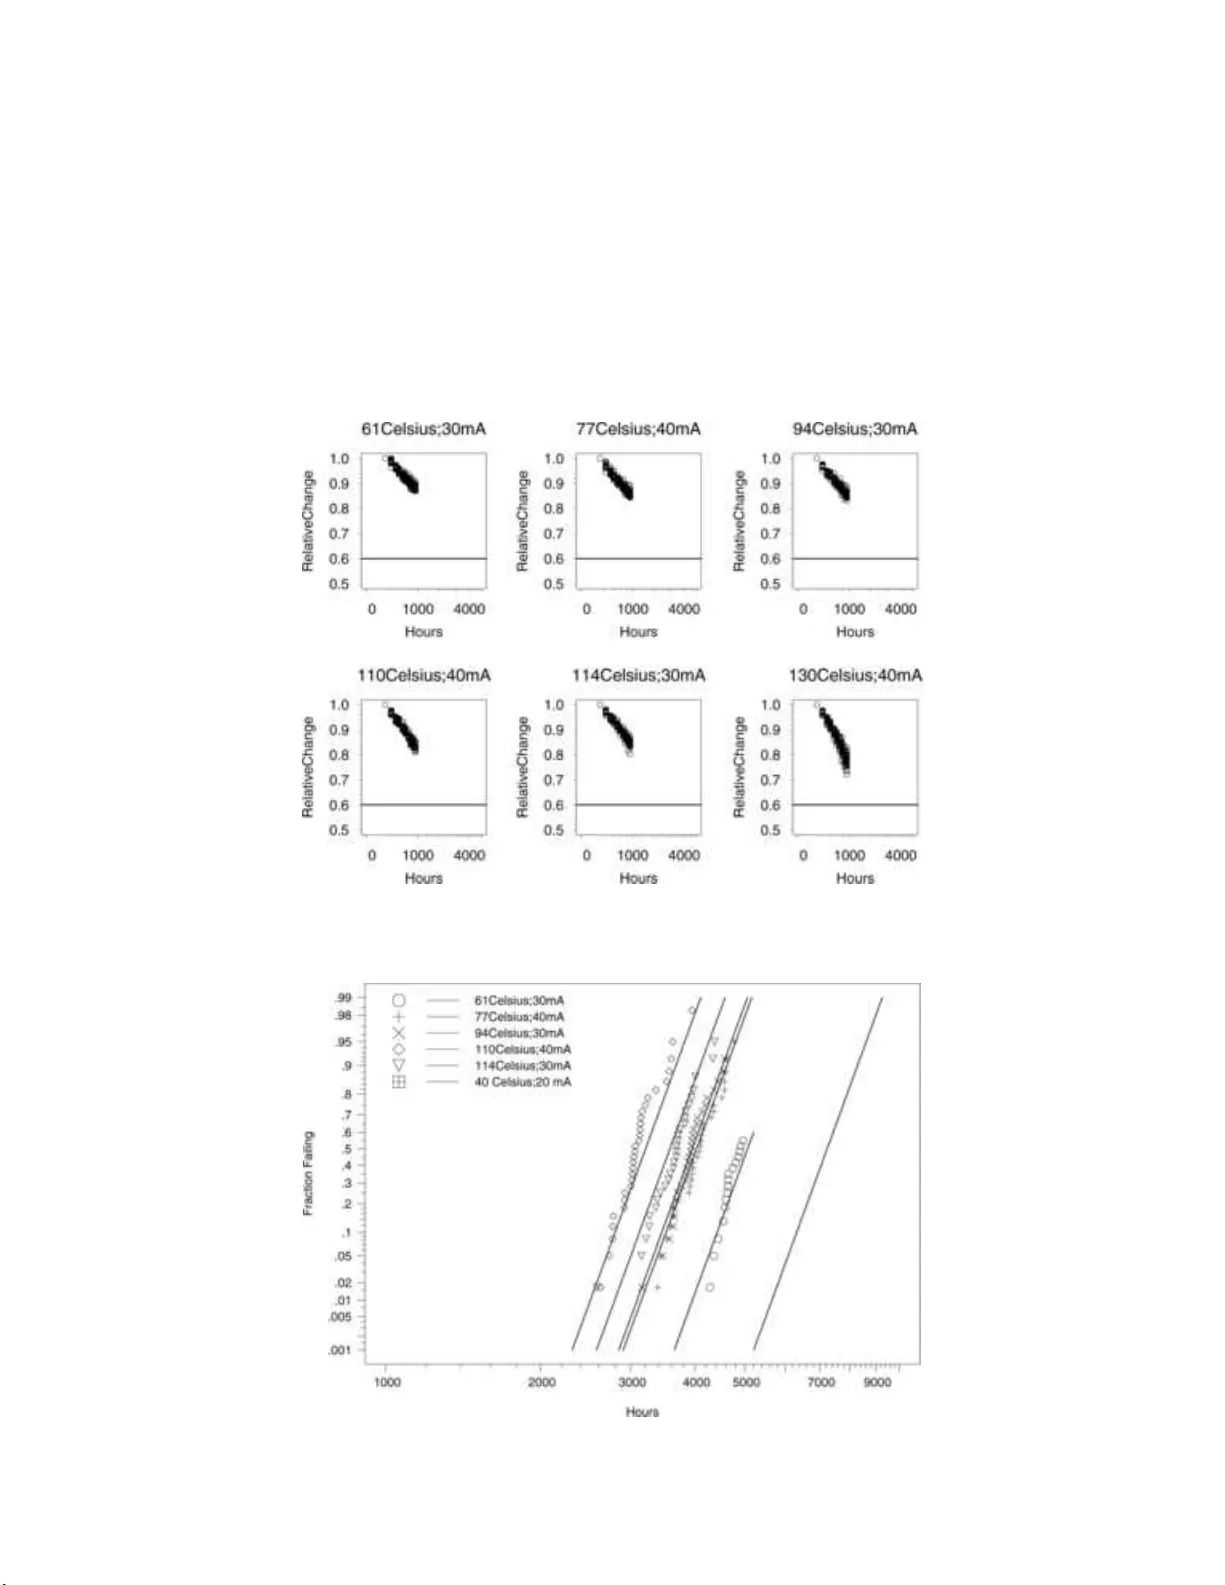
Statistic al Scienc e 2006, V ol. 21 , N o. 4, 552– 577 DOI: 10.1214 /0883423 06000000321 c Institute of Mathematical Statistics , 2006 A Review of Accelerated T est Mo dels Luis A. Escoba r and Will iam Q. Meek er Abstr act. Engineers in the manufacturing industries ha ve used accel- erated test (A T) exp erimen ts for m an y decades. Th e p urp ose of A T exp eriment s is to ac quire relia bilit y information quic kly . T est u nits of a material, comp onent , sub s ystem or en tire systems are sub jected to higher-than-usual le ve ls of one or more accelerat ing v ariables suc h as temp erature or stress. T hen the A T results are used to predict life of th e units at use conditions. T he extrap olation is t ypical ly justified (correctly or incorrectly) on the basis of physica lly motiv ated mo dels or a com bination of emp irical mo del fitting with a sufficien t amount of previous exp erience in testing s imilar units. T he need to extrap olate in b oth time and the accelerating v ariables generally necessitates the use of fully parametric mo dels. S tatisticians ha ve made imp ortan t con- tributions in the deve lopment of appropriate sto chastic mo d els for A T data [t ypically a distribution for the resp ons e and regression r elation- ships b et w een the p arameters of this distribution and the acce lerating v aria ble(s)], statistic al metho ds for A T planning (c hoice of accelerat- ing v ariable lev els and allocation of av ailable test units to those level s) and metho d s of estimation of su itable reliabilit y metrics. T his pap er pro vides a review of many of the A T mo dels that ha v e b een used suc- cessfully in this area. Key wor ds and phr ases: Reliabilit y , regression mo del, lifetime data, degradation data, extrap olation, acceleratio n factor, Arrhenius rela- tionship, E yr ing relationship, in v erse p ow er relationship, vol tage-stress accele ration, ph otod egradation. 1. INTRODUCTION 1.1 Motivation T o da y’s manufacturers face strong p r essure to de- v elop new, higher-tec hnology pro du cts in r ecord time, Luis A . Esc ob ar is Pr ofessor, D ep artment of Exp erimental Statistics, L ouisiana State University, Baton Ro uge, L ouisiana 70803, USA e-mail: luis@lsu.e du . Wil liam Q. Me eker is Distingu ishe d Pr ofesso r, Dep artment of S tatistics, Iowa State University, Ames, Iowa 50011, USA e-m ail: wqme eker@ia state.e du . This is an electr o nic reprint of the original article published b y the Institute of Mathematical Statistics in Statistic al Scienc e , 2006, V o l. 21, No . 4, 552–57 7 . This reprint differs from the original in pagination a nd t yp ogr aphic detail. while improving pro du ctivit y , pro du ct field r eliabil- it y and ov erall qualit y . This has motiv ated the d e- v elopmen t of metho ds lik e concurren t engineering and encourage d wid er use of d esigned experiments for pro duct and pro cess imp ro v ement . The requir e- men ts for higher r eliabilit y hav e increased the need for more up-fr ont testing of materials, comp on ents and systems. This is in line with the mo dern qualit y philosoph y for p ro ducing high-reliabilit y p ro ducts: ac hiev e high reliabilit y by impro ving the design and man ufacturing pro cesses; mo v e a wa y fr om reliance on in sp ection (or screening) to ac hiev e high reliabil- it y , as d escrib ed in Meek er and Hamada ( 1995 ) and Meek er and Escobar ( 2004 ). Estimating the failure-time distribution or long- term p erformance of comp onent s of high-r eliability pro du cts is particularly difficult. M ost mo dern pro d- ucts are designed to op erate w ithout failure for y ears, 1 2 L. A. ESCOBAR AND W . Q. MEEKER decades or longer. Thus few units will f ail or degrade appreciably in a test of practica l length at normal use conditions. F or example, the design and con- struction of a comm unications satel lite ma y allo w only eight mon ths to test comp onents t hat are ex- p ected to b e in service for 10 or 15 years. F or such applications, Accelerat ed T ests (A Ts) are used in man ufacturing ind ustries to assess or demonstrate comp onen t and subsystem r eliabilit y , to certify com- p onents, to detect failure mo des so that they can b e corrected, to compare diffe rent man ufacturers, and so forth. A T s h a v e b ecome increasingly imp or- tan t b ecause of rap id ly changing tec hnolog ies, more complicate d prod ucts with more comp onents, higher customer exp ectations for b etter reliabilit y and the need for rapid pro duct dev elopmen t. Th ere are diffi- cult practi cal and statistical issues in v olv ed in accel- erating the life of a complicate d p ro duct that can fail in differen t w a ys. Generally , informati on fr om tests at high lev els of one or more accele rating v ariables (e.g., use rate , temp erature, v oltage or pressure) is extrap olated, through a physic ally reasonable statis- tical mo del, to obtain estimates of life or long-term p erformance at lo wer, normal le ve ls of the acce ler- ating v ariable(s). Statisticia ns in m an ufacturing ind u stries are of- ten aske d to b ecome inv olv ed in planning or ana- lyzing data from accelerated tests. A t fi rst glance, the statistics of accelerat ed testing app ears to in - v olv e little more than regression analysis, p erh aps with a few complicating factors, such as censored data. The very nat ur e of A Ts, ho w ev er, alwa ys re- quires extrap olation in th e accelerating v ariable( s) and often requires extrap olatio n in time. This im- plies critica l i mp ortance of mod el c hoice. Relying on the common statistical practice of fitting curve s to data can r esu lt in a n inadequate mod el or even nonsense results. S tatistic ians wo rking on A T pro- grams n eed to b e aw are of general principles of A T mo deling and current b est practices. The p urp ose of this r eview pap er i s to o utline some of the b asic ideas b ehin d accelerate d testing and esp ecially to review cur ren tly used A T mo deling practice and to d escrib e the most commonly used A T mo dels. In our concluding remarks we mak e ex- plicit su ggestions ab out the p oten tial con tributions that statisti cians should b e making to the dev elop- men t of A T mo dels and metho ds. W e illustrate the use of the differen t mod els with a series of examples from the literature and our own exp eriences. 1.2 Quantitat ive versus Qualitative Accelerated T ests Within the reliabilit y discipline, the term “acce ler- ated test” is u sed to describ e t wo completely differ- en t kinds of useful, imp ortan t tests that ha v e com- pletely differen t purp oses. T o distinguish b etw een these, the terms “quan titativ e accelerated tests” (Qua- nA T ) and “qualitat iv e acc elerated t ests” (QualA T) are sometimes used. A Q u anA T tests u nits at com binations of higher- than-usual lev els of certain accelerati ng v ariables. The pu rp ose of a QuanA T is to obtain information ab out the failure-time distribution or degradation distribution at sp ecified “use” lev els of these v ari- ables. Generally failure mo des of in terest are kno wn ahead of time, and there is some knowle dge a v ail- able that describ es the relationship b et wee n the fail- ure m ec hanism and the accelerating v aria bles (either based on physical/ c hemical theory or large amoun ts of previous exp erience with similar tests) that can b e used to identify a mo d el th at can b e used to justify the extrap olation. In this pap er, we describ e mo dels for QuanA Ts. A Q u alA T tests un its at h igher-than-usual combi- nations of v ariables lik e temp erature cycling and vi- bration. Sp ecific names of suc h tests includ e HAL T (for highly accelerate d life tests), STR I FE (stress- life) and EST (en vironment al stress testing). The purp ose of su c h tests is to identify p ro duct wea k- nesses caused b y fla ws in the pr o duct’s design or man ufacturing pro cess. Nelson ( 1990 , pages 37–39) describ es such tests as “elephan t tests” and outlines some imp ortant issues related to QualA Ts. When there is a failure in a QualA T it is n ecessary to find and carefully stud y the fai lure’s ro ot cause and assess whether the failure mo de could o ccur in actual use or not. Knowledge and physical /c hemical mo deling of the p articular failure mo de is u seful for helping to mak e this assessmen t. W hen it is deter- mined that a failure could o ccur in actual u s e, it is necessary to c h ange the pro duct design or man- ufacturing pro cess to eliminate th at cause of fail- ure. Nelson ( 1990 , page 38) describ es an example where a costly effort w as made to remo ve a high- stress-induced failure m o de that n ev er would ha v e o ccurred in actual use. Because the results of a Qu alA T are used to make c hanges on the pr o duct design or manufacturing pro- cess, it is difficult, or at the v ery least, v ery risky to use the test data to pr edict what will h app en in n or- mal use. Thus Qu alA Ts are generally though t of as b eing nonstatistical. ACC ELERA TED TEST MODELS 3 1.3 Overview The rest of this pap er is organized as follo ws. Section 2 describ es the b asic physical and p r acti- cal ideas b ehind the use of A Ts and the c harac- teristics of v arious kinds o f A T data . Section 3 d e- scrib es the concept of a time-transformation mo del as an accelerated failure-time mo del, describ es some commonly used sp ecial cases and also presen ts sev- eral nonstandard s p ecial cases that are imp ortan t in practice. Section 4 describ es acceleration mo dels that are used when pro du ct use r ate is increased to get information quic kly . Sections 5 and 6 explain and illustrate the u se of temp erature and h umid- it y , resp ectiv ely , to accelerate failure mechanisms. Section 7 describ es some of the sp ecial c haracteris- tics of A Ts for photo degradation. Section 8 explains and illustrates the use of in creased vol tage (or volt- age stress) in A Ts with the commonly used inv erse p o wer relationship. T his section also describ es ho w a more general relatio nsh ip, based on the Bo x–Co x transformation, ca n b e used in sensitivit y analyses that help engineers to make decisions. Section 9 de- scrib es examples in whic h com binations of t wo or more accelerat ing v ariables are used in an A T. Sec- tion 10 discusses s ome practical c oncerns and gen- eral guidelines for conducting and in terpreting A T s. Section 11 describ es areas o f fu ture researc h i n th e dev elopmen t of accelera ted test mo dels and the role that statistici ans will hav e in these dev elopmen ts. 2. BA S IC IDEAS OF ACCELERA TED TESTING 2.1 Different T yp es of Acc eleration The term “acceleratio n” h as many differen t mean- ings within the field of reliabilit y , bu t the term gen- erally implie s making “time” (on whatev er scale is used to measure device or comp onen t life) go more quic kly , so that reliabili ty inf orm ation can b e ob- tained more rapidly . 2.2 Metho ds of Acceleration There are differen t metho ds of accelerat ing a reli- abilit y test: Incr e ase the use r ate of the pr o duct. This method is appropriate for pro d ucts that are ordinarily not in con tin uous use. F or example, the median life of a b earing for a certain w ashing mac hine agitator is 12 ye ars, based on an assu med use r ate of 8 loads p er w eek. If the m ac hine is tested at 112 loads p er week (16 p er d a y), the m ed ian life is reduced to roughly 10 mon ths, und er the assu m ption that the increased use rate do es not c hange the cycles to failure d istri- bution. Also, b ecause it is not necessary to hav e all units fail in a life test, usefu l reliabilit y information could b e obtained in a matter of we eks instead of mon ths. Incr e ase the intensity of the exp osur e to r adia- tion. V arious t yp es of r adiation can lead to m aterial degradation and pro duct failure. F or example, or- ganic materials (ranging fr om human s kin to mate- rials like ep o xies and p olyvin yl c hloride or PV C) will degrade when exp osed to ultra violet (UV) radiation. Electrical insulation exp osed to gamma ra ys in nu- clear p o we r plan ts will degrade more r apid ly than similar insu lation in similar environmen ts without the radiation. Mo deling and acceleratio n of degra- dation pr o cesses by increasing radiation int ensit y is commonly done in a manner th at is similar to accel- eration by increasing u se r ate. Incr e ase the aging r ate of the pr o duct. Increasing the leve l of exp erimental v ariables lik e temp erature or humidit y can accelerate the c hemical pro cesses of certain failure mec hanisms suc h as chemic al degra- dation (resulting in ev entual w eak ening and failure) of an adhesive mechanica l b ond or the g rowth of a conducting filamen t across an insu lator (eve ntuall y causing a s h ort circuit). Incr e ase the level of str ess ( e.g. , amplitude in tem- p er atur e cycling , voltage , or pr essur e ) under which test units op er ate. A u nit will fail when its str ength drops b elo w applied stress. T h us a unit at a high stress will generally f ail more rapidly than it w ould ha v e failed at low stress. Com binations of these metho ds of acceleration are also emplo yed. V ariables lik e vol tage and te mp era- ture cycling can b oth increase the r ate of an electro- c hemical r eactio n (th us accelerati ng the aging rate) and increase stress relativ e to strength. In suc h sit- uations, when the effec t of an accelerating v ariable is complicated, there ma y not b e enough physical kno wledge to pr o vide an adequate physical mo del for acceleration (and extrap olation). Em pirical mo d- els may or may not b e u seful for extrap olation to use conditions. 2.3 T yp es of Resp onses It is u seful to distinguish among A Ts on the basis of the nature of the r esp onse. 4 L. A . ESCOBAR AND W. Q. MEEKER A c c eler ate d Bi nary T ests ( ABTs ) . The resp onse in an ABT is bin ary . That is, whether the p ro d- uct h as failed or not is the only r eliabilit y inf orma- tion obtained f rom eac h u nit. S ee Meeke r and Hahn ( 1977 ) for an example and references. A c c eler ate d Life T ests ( AL Ts ) . The resp onse in an AL T is d irectly related to the lifetime of the pro du ct. Typica lly , AL T d ata are righ t-censored b e- cause th e test is stopp ed b efore all units fail. In other cases, the AL T resp onse is interv al-censored b ecause failures are d iscov ered at particular insp ec- tion times. See Chapters 2–1 0 of Nelson ( 1990 ) for a comprehensiv e treatmen t of AL Ts. A c c eler ate d R ep e ate d Me asur es De gr adation T ests ( ARMDTs ) . I n an ARMDT, one measures degra- dation on a sample of u nits at different p oin ts in time. In general, eac h unit pro vides sev eral degrada- tion measuremen ts. The degradation resp onse could b e actual c hemical or physic al degradation or p er- formance degradation (e.g., drop in p o wer output). See Meek er and Escobar ( 1998 , C hapters 13 and 21) for examples of ARMDT mo deling and analysis. A c c eler ate d Destructive De g r adation T ests ( ADDTs ) . An ADDT is similar to an ARMDT, ex- cept that the measuremen ts are d estructiv e, so one can obtain only one observ ation p er test un it. See Escobar, Meek er, Kugler and Kramer ( 2003 ) f or a discussion of ADDT metho dology and a detailed case stu dy . These differen t kinds of A T s can b e close ly re- lated b ecause they can in vo lv e the same un derlying physi cal/c hemical mec hanisms for failure and mo d- els for a cceleration. They are different, ho w eve r, in that differen t kind s of statistical mo dels and analy- ses are p erformed b ecause of t he differences in th e kind of resp onse th at can b e observed. Man y of th e underlying physic al mo del assu mp- tions, concepts and pr actice s are the same for ABTs, AL Ts, ARMDTs and ADDTs. There are close r e- lationships among mo dels for ABT, AL T, ARMD and ADD data. Because of the d ifferen t t yp es of resp onses, how ev er, the actual mo dels fitted to the data and metho ds of analysis differ. In some cases, analysts use degradation-lev el data to defi n e failure times. F or example, turn ing ARMDT data int o AL T data generally simplifies analysis but ma y sacrifice useful inform ation. An imp ortant c haracteristic of all A Ts is the need to extrap olate outside the r ange of a v aila ble data: tests are done at accelerate d con- ditions, b u t estimates are needed at use conditions. Suc h extrap olation r equires strong mo del assum p- tions. 3. ST A TISTICA L MODELS F OR A CCELERA TION This section discusses accel eration mo d els and some physi cal considerations that lead to these mo dels. F or fur ther information on these mo d els, see Nelson ( 1990 , Chapter 2) and Meek er and Escobar ( 1998 , Chapter 18). Other useful references include Smith ( 1996 ), Section 7 of T obias and T rindade ( 1995 ), Sections 2 and 9 of Jensen ( 1995 ) and Klinger, Nak ada and Menendez ( 1990 ). In terpretation of accele rated test d ata requ ir es mo d- els that relate accelerating v ariable s lik e temp era- ture, v oltage, pressure, size, etc. to time acceler- ation. F or testing o v er some r an ge of acc elerating v aria bles, one can fit a mo del to the data to describ e the effect that the v ariables h a v e on the failure- causing pro cesses. The general idea is to test at high lev els of the accelerating v ariable(s) to sp eed up fail- ure pr o cesses and extrap olate to lo w er lev els of the accele rating v ariable( s). F or some situations, a phys- ically reasonable s tatistical mo del may allo w such extrap olation. Physic al ac c eler ation mo dels. F or well- un dersto o d failure mec hanisms, on e ma y h a v e a mo del b ased on physi cal/c hemical theory that d escrib es the failure- causing p r o cess ov er the r ange of the data and pro- vides extrap olation to us e conditions. The relation- ship b et w een accele rating v ariables and the actual failure mechanism is usually extremely complicated. Often, how ev er, one has a simple mo del that ade- quately describ es the pro cess. F or example, failure ma y result from a complicate d c hemical pro cess with man y steps, b u t there ma y b e one r ate-limit ing ( or dominan t) s tep and a goo d understandin g of this part of th e pro cess ma y pro vide a mo del that is ad- equate f or extrap olation. Empiric al ac c eler ation mo dels. When there is lit- tle understanding of the chemica l or physic al pro- cesses leading to failure, it may b e imp ossible to dev elop a mo d el based on physic al/c hemical theory . An empirical mo del ma y b e the only alternativ e. An empirical mo del may pro vide an excellen t fit to the a v ai lable data, but provide nonsense extrap olations (e.g., the quadratic mo dels used in Meek er and Es- cobar, 1998 , Section 17.5). In some situations there ma y b e extensive emp irical exp erience with particu- lar com binations of v ariables and failure mechanisms ACC ELERA TED TEST MODELS 5 and this exp erience may pro vide the needed justifi- cation for extrap olation to use conditions. In the rest of this section we w ill describ e the gen- eral time-transformation mo del and some sp ecial ac- celerati on mo d els that ha v e b een useful in sp ecific applications. 3.1 General Time-T ransfo rmat ion Functions A time-transformation mo del maps time at one lev el of x , sa y x U , to time at another lev el of x . This can b e expressed as T ( x ) = Υ[ T ( x U ) , x ] , where x U denotes u se conditions. T o b e a time transfor- mation, the function Υ( t, x ) must hav e the follo wing prop erties: • F or an y x , Υ(0 , x ) = 0, as in Figure 1 . • Υ( t, x ) is nonnegativ e, that is, Υ( t, x ) ≥ 0 for all t and x . • F or fixed x , Υ( t, x ) is monotone increasing in t . • When ev aluate d at x U , the transformation is the iden tit y transformation [i.e., Υ( t, x U ) = t for all t ]. A quant ile of the d istribution of T ( x ) can b e d e- termined as a functio n of x and the corresp onding quan tile of the distribu tion of T ( x U ) . In particu- lar, t p ( x ) = Υ [ t p ( x U ) , x ] for 0 ≤ p ≤ 1 . As sho wn i n Figure 1 , a plot of T ( x U ) v ersus T ( x ) can imply a particular class of transform ation fun ctions. I n par- ticular, • T ( x ) en tirely b elo w the diagonal line implies ac- celerati on. • T ( x ) entirel y ab o v e the d iagonal li ne implies de- celerati on. • T ( x ) can cross the d iagonal, in wh ic h case the transformation is accelerating o v er some times and decelerating ov er other times. In this case the c.d.f.’s of T ( x ) and T ( x U ) cross. See Martin ( 1982 ) and LuV alle, W elsher and Svobo d a ( 1988 ) for further discussion of time-transformation mo dels. 3.2 Scale-Accelerated Failure-Time Mo dels (SAF Ts) A simple, commonly used mo del used to c har- acterize the effect that explanatory v aria bles x = ( x 1 , . . . , x k ) ′ ha v e on lifetime T is the scale-acc elerated failure-time (SAFT) mo del. The mo d el is u biquitous in the statistical lite rature where it is generally re- ferred to as the “accelerate d failure-time mo del.” It is, ho w ev er, a very sp ecial kind of accele rated f ailure- time mo del. Some of the explanatory v ariables in x Fig. 1. Gener al failur e-time tr ansformation wi th x u < x . are used for acceleration, but others ma y b e of inter- est for other reasons (e.g., for pro d uct design opti- mization decisions). Und er a SAFT mo del, lifetime at x , T ( x ), is scale d b y a deterministic factor that migh t dep end on x and u nkno wn fi xed parameters. More sp ecifically , a mo d el for the random v ariable T ( x ) is SAFT if T ( x ) = T ( x U ) / AF ( x ), w here the ac c eler atio n f actor A F ( x ) is a p ositiv e function of x satisfying AF ( x U ) = 1 . Lifetime is accelerat ed (de- celerate d) when AF ( x ) > 1 [ AF ( x ) < 1]. In terms of d istribution quan tiles, t p ( x ) = t p ( x U ) AF ( x ) . (1) Some sp ecial cases of these imp ortan t SAFT mo dels are discussed in the follo wing s ections. Observe that u n der a SAFT mo del, the probabil- it y that fail ur e at c onditions x o ccurs at or b efore time t can b e written as Pr[ T ( x ) ≤ t ] = Pr[ T ( x U ) ≤ AF ( x ) × t ]. It is common pr actice (bu t certainly n ot necessary) to assume t hat lifetime T ( x ) has a log- lo cation-sca le distribu tion, with parameters ( µ, σ ) , suc h as a lognormal distribution in w hic h µ is a fu nc- tion of the accelerati ng v ariable(s) and σ is constan t (i.e., do es not dep end on x ). In this case, F ( t ; x U ) = Pr[ T ( x U ) ≤ t ] = Φ log( t ) − µ U σ , where Φ d en otes a standard cum ulativ e distribution function (e.g., standard normal) and µ U is the lo- cation p arameter for th e distribution of log[ T ( x U )]. 6 L. A . ESCOBAR AND W. Q. MEEKER Th us, F ( t ; x ) = Pr[ T ( x ) ≤ t ] = Φ log( t ) − { µ U − log[ AF ( x )] } σ . Note that T ( x ) also h as a log-lo cation-scal e distribu- tion with lo cation p arameter µ = µ U − log [ AF ( x )] and a scale p arameter σ that do es n ot dep end on x . 3.3 The Prop o rtional Hazard Regression M o del F or a con tin uous cdf F ( t ; x U ) and Ψ ( x ) > 0 d efine the time trans f ormation T ( x ) = F − 1 (1 − { 1 − F [ T ( x U ); x U ] } 1 / Ψ( x ) ; x U ) . It can b e sho wn that T ( x ) and T ( x U ) ha v e the pro- p ortional hazard (PH) relationship h ( t ; x ) = Ψ( x ) h ( t ; x U ) . (2) This time-transformation f u nction is illustrated in Figure 1 . In this example, the amount of accelera- tion (or decelerati on), T ( x U ) /T ( x ), dep ends on the p osition in time and the mo del is n ot a S AFT. If F ( t ; x U ) has a W eibull distribu tion with scale pa- rameter η U and shap e parameter β U , then T ( x ) = T ( x U ) / AF ( x ), where AF ( x ) = [Ψ( x )] 1 /β U . This im- plies that this particular PH regression mo d el is also a SAFT r egression mo d el. It can b e sh o wn that the W eibull d istribution is the only d istribution in w hic h b oth ( 1 ) and ( 2 ) hold. Lawless ( 1986 ) illustrates this result n icely . Fig. 2. Sup er al loy fatigue data with fitte d l o g-quadr atic Weibul l r e gr ess ion mo del with nonc onstant σ . Cen sor e d ob- servations ar e indic ate d by ⊲ . The r esp onse, cycles, is shown on the x-axis. 3.4 Another Non-SA FT Example: The Nonconstant σ Regression Model This section describ es accele ration mo dels w ith nonconstan t σ. In some lifetime applications, it is useful to consider log-lo cation-scal e m o dels in whic h b oth µ and σ d ep end on explanatory v ariables. T h e log-quan tile fun ction for this mo d el is log[ t p ( x )] = µ ( x ) + Φ − 1 ( p ) σ ( x ) . Th us t p ( x U ) t p ( x ) = exp { µ ( x U − µ ( x )) + Φ − 1 ( p )[ σ ( x U ) − σ ( x )] } . Because t p ( x U ) /t p ( x ) d ep ends on p , this mo del is not a SAFT m o del. Example 1 ( Weibul l lo g-qu adr atic r e gr ession mo- del with nonc onstant σ f or the sup er al loy fatigue data ). Meek er and Escobar ( 1998 , Section 17.5) analyze sup erallo y fatigue data using a W eibull mo del in whic h µ = β [ µ ] 0 + β [ µ ] 1 x + β [ µ ] 2 x 2 and log ( σ ) = β [ σ ] 0 + β [ σ ] 1 x (see Nelson, 1984 and 1990 , for a similar anal- ysis u sing a lognormal distribution). Figure 2 sh ows the log-quadratic W eibull regression mo d el with non- constan t σ fit to the sup erallo y fatigue data. Meek er and Esco bar ( 1998 ) indicate that the ev- idence for nonconstant σ in the data is not strong. But h aving σ decrease w ith stress or strain is typi- cal in fatigue data and this is wh at the data p oin ts plotted in Figure 2 sho w. Th us, it is reasonable to use a m o del w ith d ecreasing σ in this case, eve n in the absence of “statistica l significance,” esp ecially b ecause assuming a constant sigma could lead to an ti-conserv ativ e estimates o f life at lo wer leve ls of stress. 4. USE-RA TE ACCE LERA TION Increasing the us e rate can b e an effectiv e metho d of accelerati on for some pro ducts. Use-rate accelera- tion may b e appropriate for pro d ucts suc h as electri- cal motors, rela ys and switc hes, p ap er copiers, print- ers, and home appliances such as toasters and w ash- ing machines. Also it is common practice to increase the cycling rate (or frequency) in fatigue testing. The manner in whic h the use rate is increased ma y dep end on the pro du ct. ACC ELERA TED TEST MODELS 7 4.1 Simple Use-Rate Acc eleration Models There is a basic assum ption un derlying simple use- rate accelerati on mo dels. Usefu l life must b e ade- quately mo d eled with cycles of op eration as the time scale and cycling rate (or frequency) sh ould not af- fect the cycles-to-failure distribution. Th is is r eason- able if cycling sim ulates actual us e and if the cycling frequency is lo w enough that test units return to steady state after eac h cycle (e.g., co ol down). In such simple situations, w here the cycles-to- failure distribution do es not dep en d on the cycling rate, we sa y that r e cipr o city ho lds . Th is implies th at the un- derlying mo del for lifetime v ersus use rate is SAFT where A F (UseRate) = UseRate / UseRate U is the fac- tor b y whic h the test is accelerated. F or example, Nelson ( 1990 , page 16) states that failure of r olling b earings can b e accelerated by running them at three or more times the normal sp eed. Johnston et al. ( 1979 ) demonstrated that the cycles-to-failure of elec- trical insu lation was sh ortened, app ro ximately , by a factor of AF (412) = 412 / 60 ≈ 6 . 87 when the applied A C v oltage in endurance tests w as increased from 60 Hz to 412 Hz. AL Ts with increased u se r ate attempt to sim ulate actual use. Thus other environmen tal factors should b e con trolle d to mimic actual use en vironment s. If the cycling rate is to o high, it can cause r e cipr o city br e akdown . F or example, it is necessary to hav e test units (suc h as a toaster) “cool do wn ” b et w een cy- cles of op eration. Otherwise, heat bu ildup can cause the cycles-to- failure distribution to d ep end on the cycling r ate. 4.2 Cycles t o F ailure Dep ends on Use Rate T esting at higher frequencies could shorten test times but could also affect the cycles-to-fa ilure dis- tribution due t o sp ecimen heati ng or other effects. In some complicated situations, w ear rate or degra- dation rate d ep ends on cycling frequency . Also, a pro du ct ma y deteriorate in stand-by as w ell as dur - ing actual use. R ecipro cit y breakdo wn is kno wn to o ccur, for example, for certain comp onent s in copy- ing mac hines w h ere comp onen ts tend to last longer (in terms of cycles) wh en pr in ting is d one at higher rates. Do wling ( 1993 , page 706) describ es ho w in - creased cycle rate m a y affect the crac k gro wth rate in p er cycle fatigue testing. In such cases, the empiri- cal p o wer-rule rela tionship AF (UseRate) = (UseRate / UseRate U ) p is often used, where p can b e estimated by testing at tw o or more use rates. Example 2 ( Incr e ase d cycling r ate for low-cycle fatigue tests ). F atigue life is typical ly measur ed in cycles to failure. T o estimate lo w-cycle fatigue life of metal sp ecimens, testing is done u sing cycling rates typical ly ranging b et we en 10 Hz and 50 Hz (where 1 Hz is one stress cycle p er second), d ep end- ing on material t yp e a nd a v ail able test equipmen t. A t 50 Hz, accumulat ion of 10 6 cycles would requir e ab out fiv e h ours of testing. Accum ulation of 10 7 cy- cles would require ab out tw o da ys and accum ulation of 10 8 cycles would require ab out 20 days. Higher frequencies are used in th e stud y of high-cycle fa- tigue. Some fatigue tests are conducted to estimate crac k gro wth rates, often as a function of explanatory v ari- ables lik e stress and temp erature. Su c h tests gener- ally u se rectangular compact tension test sp ecimens con taining a lo ng slot cut norm al to the cen terline with a chevron mac hined into the end of the notc h. Because the lo cation of the c hevron is a p oint of highest stress, a crac k will initiate and gro w from there. Other fatigue tests measur e cycles to failure. Suc h tests use cylindrical dog-b one-shap ed sp eci- mens. Again, crac ks tend to initiate in the narro w part of the dog b one, although sometimes a notc h is cut into the sp ecimen to initiate the crac k. Cycling r ates in fatigue tests are generally increased to a p oin t where the d esired resp onse can still b e measured w ithout distortion. F or b oth kind s of fa- tigue tests, th e results are u sed as inpu ts to engi- neering m o dels that predict the life of actual system comp onen ts. Th e d etails of suc h mo dels that are ac- tually us ed in practice are usually proprietary , but are typified, for example, by Miner’s rule (e.g., page 494 of Nelson, 1990 ) which uses resu lts of tests in whic h sp ecimens are tested at constan t stress to pre- dict life in whic h s ystem comp onen ts are exp osed to v arying stresses. Example 15.3 in Meek er and Es- cobar ( 1998 ) d escrib es, generally , ho w r esults of fa- tigue tests on sp ecimens are used to pr edict the re- liabilit y of a jet engine turb ine disk. There is a danger, ho we ve r, that increased tem- p erature du e to in creased cycling r ate will affect the cycles-to -failure distribu tion. This is esp ecially true if there are effects lik e creep-fatig ue inte raction (see Do wling, 1993 , page 706, for f urther discus- sion). In another example, there w as concern th at c hanges in cycling rate w ould affect the distribu- tion of lubrican t on a rolling b earing surface. In particular, if T is life in cycles and T has a log- lo cation-sca le distribution with parameters ( µ, σ ) , 8 L. A . ESCOBAR AND W. Q. MEEKER then µ = β 0 + β 1 log(cycles/unit time) where β 0 and β 1 can b e estimated from d ata at t wo or more v alues of cycles/unit time . 5. USING T EMPERA TURE TO A CCELERA TE F A ILURE MECHANISMS It is sometimes said that high temp erature is the enem y of reliabilit y . In creasing temp erature is one of the most commonly us ed metho ds to accelerate a failure mechanism. 5.1 Arr henius Relationship fo r Reaction Rates The Arrhenius relationship is a widely used mo del to describ e the effect that temp erature has on the rate of a simple c hemical reaction. T h is relationship can b e written as R ( temp ) = γ 0 exp − E a k × temp K (3) where R is the reaction rate, and temp K = temp ◦ C + 273 . 15 is thermo d ynamic temp erature in k elvin (K ), k is either Boltzmann’s constant or t he univ ersal gas co nstant and E a is the activ ation en- ergy . T h e p arameters E a and γ 0 are pro duct or m a- terial charac teristics. In applications inv olving elec- tronic comp onen t r eliabilit y , Boltzmann’s constan t k = 8 . 6171 × 10 − 5 = 1 / 11605 in units of electron- v olt p er k elvin (eV / K) is commonly used an d in this case, E a has units of electron v olt (eV). In the case of a simple one-ste p c hemical reac- tion, E a w ould represen t an ac tiv atio n energy that quan tifies the minim um amount of energy needed to allo w a certain chemica l r eactio n to o ccur. In most applications inv olving temp erature accele ration of a failure mec hanism, the situation is muc h m ore com- plicated. F or example, a c hemical degradation pro- cess may ha v e m ultiple s teps op erating in series or parallel, with eac h step having its o wn rate constant and activ ation energy . Generally , the hop e is that the b ehavio r of the more complicated p ro cess can b e approxima ted, o v er the en tire r ange of temp era- ture of interest, by the Arrhenius relationship. This hop e can b e realized, f or example, if there is a single step in the degradation pro cess that is rate-limiting and th us, for all p ractical purp oses, con trols the rate of the en tire reactio n. O f course this is a strong as- sumption that in most practical applicatio ns i s im- p ossible to v erify completely . I n most accele rated test applications, it w ould b e m ore appropriate to refer to E a in ( 3 ) as a quasi-activation ener gy . 5.2 Arr henius Relationship Time-Accele ration F acto r The Arrhenius acceleration factor is AF ( temp , temp U , E a ) = R ( temp ) R ( temp U ) (4) = exp E a 11605 temp U K − 11605 temp K . When temp > te mp U , AF ( temp , temp U , E a ) > 1. When temp U and E a are un dersto o d to b e, resp ec- tiv ely , pr o duct use temp erature and reaction-specific quasi ac tiv atio n energy , AF ( temp ) = AF ( temp , temp U , E a ) will b e used to denote a time-accelerati on factor. The follo wing example illustrates ho w one can assess ap p ro ximate acceleration facto rs f or a prop osed accelerat ed test. Example 3 ( A dhesive-b onde d p ower element ). Meek er and Hahn ( 1985 ) describ e an adhesive- b onded p o wer elemen t that was designed for use at temp = 50 ◦ C. S upp ose that a life test of this elemen t is to b e c ondu cted at t emp = 120 ◦ C. Al so supp ose t hat exp erience with this pro du ct suggested that E a can v ary in the range E a = 0 . 4 eV to E a = 0 . 6 eV. F ig- ure 3 giv es the accelerat ion factors for the c hemical reaction wh en testing the p o w er elemen t at 120 ◦ C and quasi-activ ation energies of E a = (0 . 4 , 0 . 5 , 0 . 6) eV. Th e corresp onding approximat e accelerati on fac- tors at 1 20 ◦ C are AF (120) = 12 . 9 , 24 . 5 , and 46 . 4 , resp ectiv ely . The Arr henius relationship do es not apply to all temp erature accel eration problems and will be ad- equate o ve r only a limited temp erature range (de- p endin g on the particular app licatio n). Y et it is sat- isfactorily and w idely used in many applications. Nelson ( 1990 , page 76) commen ts that “. . . i n certain applications (e.g., motor insu lation), if the Arrh e- nius relationship . . . do es n ot fit the data, the data are susp ect rather than the relationship.” 5.3 Eyring Relationship Time- Acceleration F actor The Arrhenius r elationship ( 3 ) w as disco vered by Sv an te Arrhenius thr ough empirical observ ation in the late 1800 s. Eyring (e.g., Gladstone, Laidler and Eyring, 1941 , or Eyring, 1980 ) giv es physic al theory describing the effe ct that temp erature h as on a re- action rate. W ritten in terms of a reaction rate, the ACC ELERA TED TEST MODELS 9 Fig. 3. Time-ac c eler ation factors as a function of temp er atur e for the adhesive-b onde d example with E a = (0 . 4 , 0 . 5 , 0 . 6) eV. Eyring relationship is R ( temp ) = γ 0 × A ( temp ) × exp − E a k × temp K where A ( temp ) is a f unction of temp erature dep end- ing on the sp ecifics of the reaction dynamics and γ 0 and E a are constan ts (W eston and Sch w arz, 1972 , e.g., pro vides more detail). Applications in the liter- ature ha v e t ypically used A ( temp ) = ( temp K) m with a fixed v alue of m ranging b et we en m = 0 (Boc- calett i et al., 1989 , page 379), m = 0 . 5 (Klinger, 1991 ), to m = 1 (Nelso n, 1990 , page 100, and Mann, Sc hafer and Singpu rw alla, 1974 , page 436). The Eyring relationship temp erature acceleratio n factor is AF Ey ( temp , temp U , E a ) = temp K temp U K m × AF Ar ( temp , temp U , E a ) where AF Ar ( temp , temp U , E a ) is the Ar r henius ac- celerati on factor from ( 4 ). F or use o ve r practical ranges of temp erature acce leration, and for practi- cal v alues of m not far from 0, the factor outside the exp onent ial has relativ ely little effect on the acceler- ation factor and the additional term is often dropp ed in fa v or of the simpler Arr henius r elationship. Example 4 ( Eyring ac c eler ation f actor for a met- al lization failur e mo de ). An accele rated life test will b e used to study a metalliza tion failure mec ha- nism f or a solid-sta te electronic device . Exp erience with this typ e of failure mechanism suggests that the quasi-activ ation energy s h ould b e in the n eigh b or- ho o d of E a = 1 . 2 eV . The usu al op erating j unction temp erature for the device is 90 ◦ C. The Eyring ac- celerati on factor for testing at 160 ◦ C, using m = 1 , is AF Ey (160 , 90 , 1 . 2) = 160 + 2 73 . 15 90 + 27 3 . 15 × AF Ar (160 , 90 , 1 . 2) = 1 . 1935 × 491 = 586 where AF Ar (160 , 90 , 1 . 2) = 491 is the Arrhenius ac- celerati on factor. W e see th at, for a fixe d v alue of E a , the Eyring r elationship predicts, in this case, an acceleratio n that is 19% greater than th e Arr h e- nius relationship. As explained b elo w, ho wev er, this figure exaggerates the pr actical difference b etw een these mo dels. When fitting mo dels to limited d ata, the estimate of E a dep ends strongly on the assu med v alue for m (e.g. , 0 or 1). This depend ency will comp ensate for and reduce the effect of c hanging the assumed v al ue of m . Only w ith extremely large amoun ts of data would it b e p ossible to adequ ately s eparate the effects of m and E a using data alone. If m can b e determined accurately on the basis of physica l considerations, the Eyring relationship could lead to b etter lo w-stress extrap olations. Numerical evi- dence sho ws that the accelerat ion factor obtained from the E yring mo del assuming m kno wn , and es- timating E a from the data, is monotone decreasing as a function of m. Then the Eyring mo del giv es smaller accelerat ion factors and smaller extrap ola- tion to use lev els of temp erature w hen m > 0 . When m < 0, Arrhenius give s a smaller acceleratio n fac- tor and a conserv ativ e extrap olation to use lev els of temp erature. 5.4 Reaction-Rate A cceleration fo r a Nonlinea r Degradation P ath Mo del Some simple c hemical d egradation pro cesses (first- order kinetics) migh t b e describ ed b y the follo wing path mo del: D ( t ; te mp ) (5) = D ∞ × { 1 − e xp[ −R U × AF ( temp ) × t ] } where R U is the reaction r ate at use temp erature temp U , R U × AF ( temp ) is the rate reaction at a general temp erature temp , and for temp > temp U , 10 L. A . ESCOBAR AND W. Q. MEEKER AF ( temp ) > 1. Figure 4 sho ws th is f unction for fixed R U , E a and D ∞ , but at differen t temp eratures. Note from ( 5 ) that w hen D ∞ > 0 , D ( t ) is increasing and failure o ccurs when D ( t ) > D f . F or the example in Figure 4 , ho wev er, D ∞ < 0, D ( t ) is decreasing, and failure o ccurs when D ( t ) < D f = − 0 . 5. In either case, equating D ( T ; t emp ) to D f and solving for f ailure time giv es T ( temp ) = T ( temp U ) AF ( temp ) (6) where T ( temp U ) = − 1 R U log 1 − D f D ∞ is failure time at use conditions. F aster d egradation shortens time to any particular defin ition of failure (e.g., crossing D f or some other sp ecified lev el) by a sc ale factor that d ep ends on temp erature. Thus c hanging temp erature is similar to c hanging the units of time. Consequen tly , the time-to-failure distribu- tions at tem p U and temp are related by Pr[ T ( temp U ) ≤ t ] (7) = Pr[ T ( temp ) ≤ t/ AF ( temp )] . Equations ( 6 ) and ( 7 ) are forms of the s cale-a ccele- rated failure-time (SAFT) mo del introdu ced in Sec- tion 3.2 . With a SAFT mo d el, for example, if T ( tem p U ) (time at use or some other baseline temp erature) has a log-lo cation-sca le distribu tion with parameters µ U and σ , then Pr[ T ≤ t ; temp U ] = Φ log( t ) − µ U σ . Fig. 4. Nonline ar de gr adation p aths at differ ent temp er a- tur es wi th a SAFT r elationship. A t an y other temp eratur e, Pr[ T ≤ t ; temp ] = Φ log( t ) − µ σ where µ = µ ( x ) = µ U − log[ AF ( temp )] = β 0 + β 1 x, x = 1160 5 / ( temp K) , x U = 11605 / ( temp U K), β 1 = E a and β 0 = µ U − β 1 x U . Lu V alle, W elsher and Svo- b o da ( 1988 ) and Klinger ( 1992 ) d escrib e more gen- eral p h ysical/c hemical degradation mo del c harac- teristics needed to assure that the SAFT prop erty holds. Example 5 ( Time ac c eler ation for Devic e-A ). Ho op er and Amster ( 1990 ) analyze the temp erature- accele rated life test d ata on a p articular kind of electronic d evice that is id entified here as Device- A. The data are giv en in Meek er and Escobar ( 1998 , page 637). Th e purp ose of the exp eriment w as to determine if Device-A w ould meet its failure-rate ob jectiv e th r ough 10,000 hours and 30,000 hours at its nominal op erating ambien t temp erature of 10 ◦ C. Figure 5 sho ws th e censored life d ata and the Ar rhenius-lognormal ML fit of the distrib ution quan tiles v ersus temp erature, d escribing the r ela- tionship b et wee n life and temp erature. There were 0 failure out of 30 units tested at 10 ◦ C, 10 out of 100 at 40 ◦ C, 9 out of 20 at 60 ◦ C, and 14 out of 15 at 80 ◦ C. The censored observ at ions are denoted in Fig- ure 5 by ∆. The life-temp erature relationship plots as a family of straight lines b ecause temp erature is plotted on an Arrhenius axis and life is plotted on a log axis. The dens ities are normal densities b ecause the lognormal life d istrib utions are plotted on a log axis. Fig. 5. Arrhe nius-lo gnormal mo del fitte d to the Devic e-A data. Censor e d observations ar e indic ate d by ∆ . ACC ELERA TED TEST MODELS 11 5.5 Examples where the A r r henius Mo del is not App ropriate As describ ed in Section 5.1 , strictly sp eaking, the Arrhenius relationship will describ e the r ate of a c hemical reaction only un der sp ecial circumstances. It is easy to construct examples wh ere the Arrheniu s mo del do es not hold. F or example, if there is more than one comp eting c hemical reactio n and those c hemical reactions hav e differen t activ at ion energies, the Ar r henius mo del w ill not d escrib e the rate of the o v erall c hemical reaction. Example 6 ( A c c eler ation of p ar al lel chemic al r e- actions ). Consider the c hemical degradatio n path mo del having t w o separate reactions con tributing to failure and describ ed by D ( t ; te mp ) = D 1 ∞ × { 1 − exp[ −R 1 U × AF 1 ( temp ) × t ] } + D 2 ∞ × { 1 − exp[ −R 2 U × AF 2 ( temp ) × t ] } . Here R 1 U and R 2 U are the use-condition r ates of th e t w o parallel reactions con tributing to failure. S up- p ose that the Arrhenius relatio nsh ip can b e used to describ e temp erature dep end ence for these rates, pro viding accele ration functions AF 1 ( temp ) and AF 2 ( temp ). T hen, un less AF 1 ( temp ) = AF 2 ( temp ) for all temp , this degradation mod el does not lead to a SAFT mo del. In tuitiv ely , this is b ecause tem- p erature affects the t wo degradatio n pro cesses dif- feren tly , indu cing a nonlinearity in to the accelera- tion function relating times at tw o d ifferen t temp er- atures. T o obtain useful extrap olation mod els f or degra- dation pr o cesses having more than one step, eac h with its o wn rate constan t, it is, in general, nec- essary to h a v e adequate mo dels for the imp ortant individual steps. F or example, when the individual pro cesses can b e observe d, it may b e p ossible to es- timate the effect that temperature (or ot her accel- erating v aria bles) has on eac h of the rate constan ts. 5.6 Other Units f o r Activation Energy The d iscus s ion and examples of the Arr h enius and Eyring relationships in Sections 5.2 – 5.4 used units of electron v olt for E a and electron v olt p er k elvin for k . These units for the Arrheniu s mo del are used most commonly in applications inv olving electronics. In other areas of app licatio n (e.g., d egradation of or- ganic materials su c h as pain ts and coatings, plastics, fo o d and ph armaceutica ls), it is more common to see Boltzmann’s constant k in units of elect ronv olt re- placed w ith the un iv ersal gas constant in other u nits. F or example, the gas constan t is commonly giv en in units of kilo joule p er mole k elvin [i.e., R = 8 . 31447 kJ / (mol · K)]. In this case, E a is activ ation energy in un its of ki lo joule p er mole (kJ / mol). The corre- sp ondin g Arrhenius accele ration factor is AF ( temp , temp U , E a ) = exp E a 120 . 2 7 temp U K − 120 . 2 7 temp K . The univ ersal gas constan t can also b e expressed in units of kilo calorie p er mole ke lvin, kc al / (mol · K) [i.e., R = 1 . 9858 8 kca l / (mol · K)]. In this case, E a is in units of kilo calorie p er mole (k cal / mol ). Th e cor- resp ondin g Arrhenius accele ration factor is AF ( temp , temp U , E a ) = exp E a 503 . 5 6 temp U K − 503 . 5 6 temp K . It is also p ossib le to u se u nits of kJ / (mol · K) and k cal / (mol · K ) for the E a co efficient in the Eyring mo del. Although k is standard notation for Boltzmann’s constan t and R is standard notation f or the u niv er- sal gas constan t, w e use k to den ote either of these in the Ar r henius relationship. 5.7 T emp erature Cycling Some failure mo des are caused by temp erature cycling. I n particular, temp erature cycling causes thermal expansion and con traction whic h can ind uce mec hanical stresses. S ome failure m o des ca used b y thermal cycling include: • Po wer on/off cycling of electronic equipmen t can damage int egrated circuit encapsulement and sol- der join ts. • Heat generated by tak e-off p o we r-thru st in jet en- gines can cause crac k initiation and gro wth in fan disks. • Po wer-up/p o we r-down cycles can cause cracks in n uclear p ow er plant h eat exc hanger tub es and tur- bine generator comp onen ts. • T emp erature cycling can lead to delamination in inkjet p rin thead comp onents. 12 L. A . ESCOBAR AND W. Q. MEEKER As in fatigue testing, it is p ossible to accelerate thermal cycling failure mo des by increasing either the frequency or amplitude of th e cycles (increasing amplitude generally increases mec hanical stress). T he most commonly u sed mo del for accele ration of ther- mal cycling is the C offin–Manson relationship wh ic h sa ys that the num b er of cycles to failure is N = δ (∆ temp ) β 1 where ∆ temp is the temp erature range and δ and β 1 are prop erties of the material and test setup. This p o we r-ru le relatio nsh ip explains the effect that temp erature range has on the thermal-fatigue life cycles-to -failure distribu tion. Nelson ( 1990 , page 86) suggests that f or some m etals, β 1 ≈ 2 and that for plastic encapsulement s used for in tegrated circuits, β 1 ≈ 5. Th e Coffin–Manson relationship w as origi- nally d ev elop ed as an empirical mo del to describ e the effect of temp erature cycling on the failure of comp onen ts in the hot part of a jet engine. S ee Nel- son ( 1990 , page 86) for further discussion and refer- ences. Letting T b e the rand om n umber of cycles to fail- ure (e.g., T = N ε wh ere ε is a random v aria ble). Th e accele ration factor at ∆ temp , r elativ e to ∆ temp U , is AF (∆ temp ) = T (∆ temp U ) T (∆ temp ) = ∆ temp ∆ temp U β 1 . There ma y b e a ∆ te mp threshold b elo w which little or no fatigue damage is done du ring thermal cycling. Empirical evidence has sho wn that the effect of temp erature cycling can dep end imp ortan tly on temp max K, the maxim um temp erature in the cy- cling (e.g., if temp max K is more than 0.2 or 0.3 times a metal’s melting p oint). The cycles-to- failure distri- bution for temp erature cycling can also dep end on the cycling rate (e.g., du e to heat bu ildup). An em- pirical extension of the Coffin–Manson relationship that describ es suc h d ep endencies is N = δ (∆ temp ) β 1 × 1 ( freq ) β 2 × exp E a × 11 605 temp max K , where f req is the cycling frequen cy and E a is a quasi-activ ation energy . As with all accele ration mo dels, caution m ust b e used wh en using such a mo del outside the range of a v ai lable data and past exp erience. 6. USING HUMIDITY TO ACCELERA TE REA CTION RA TES Humidit y is another commonly u sed acce lerating v aria ble, particularly for failure mec hanisms inv olv- ing corrosion and certain kind s of c hemical degrada- tion. Example 7 ( A c c eler ate d life test of a printe d wiring b o ar d ). Figure 6 s ho ws data fr om an AL T of p r in ted circuit b oards, illustrating the u se of h umidity as an accele rating v ariable. Th is is a subset of the larger exp eriment describ ed by LuV alle, W elsher and Mitc hell ( 1986 ), in vo lving accelerati on with temp erature, hu- midit y and v oltage. A table of the d ata is giv en in Meek er and LuV alle ( 1995 ) and in Meek er and Es- cobar ( 1998 ). Figure 6 sho ws clearly that failures o ccur earlier at higher lev els of h umidit y . V ap or densit y measures the amount of w ate r v a- p or in a vo lume of air in u n its of mass p er u nit vo l- ume. P artial v ap or pressure (so metimes simp ly re- ferred to as “v ap or pressure”) is closely r elated and measures that part of th e total air p ressure exerted b y the water molecules in the air. P artial v apor p res- sure is appro ximately p rop ortional to v ap or densit y . The partial v ap or pr essure at which molecules are ev ap orating and condensing from the sur face of wa- ter at th e same rate is the saturation v apor pressu re. F or a fixed amount of m oisture in the air, s aturation v apor pr essure increases with temp erature. Relativ e humidit y is usu ally defined as RH = V ap or Pr essure Saturation V ap or Pressure Fig. 6. Sc atterplot of printe d ci r cuit b o ar d ac c eler ate d life test data. Censor e d observations ar e indic ate d by ∆ . Ther e ar e 48 c ensor e d observations at 40 78 hours in the 49.5 % RH test and 11 c ensor e d observat ions at 3067 hours in the 62.8 % RH test. ACC ELERA TED TEST MODELS 13 and is commonly expressed as a p ercen t. F or most failure mec hanisms , physic al/c hemical theory s ug- gests that RH is th e appropriate scale in which t o relate reaction rate to humidit y esp ecially if temp er- ature is also to b e u sed as an accelerating v ariable (Klinger, 1991 ). A v ariet y of differen t h umid ity m o dels (mostly empirical but a few with some ph ysical basis) hav e b een suggested for differen t kinds of failure mec h- anisms. Much of this w ork has b een motiv ate d by concerns ab out the effect of en vironment al humidit y on plast ic-pac k age d electronic devices. Hum idit y is also an imp ortan t factor in the service-life distribu - tion of pain ts and coatings. In most test applications where humidit y is used as an accele rating v ariable, it is used in conjunction w ith temp erature. F or exam- ple, Pe c k ( 1986 ) presen ts data and models rela ting life of semiconductor elec tronic comp onent s to hu- midit y and temp erature. See also P ec k and Zierdt ( 1974 ) and Jo yce et al. ( 1985 ). Gillen and Mead ( 1980 ) d escrib e a kin etic approac h for mo deling ac- celerate d aging data. LuV alle, W elsher and Mitc hell ( 1986 ) describ e the analysis of time-to -failure data on prin ted circuit b oards that ha v e b een tested at higher than usual temp erature, humidit y and v olt- age. They suggest AL T mo d els based on the physics of f ailure. Chapter 2 of Nelson ( 1990 ) and Bo ccaletti et al. ( 1989 ) review and compare a n um b er of dif- feren t humidit y mo dels. The Eyring/Arrhenius te mp erature-h umidity ac- celerati on relationship in the form of ( 14 ) uses x 1 = 11605 / temp K , x 2 = log( RH ) and x 3 = x 1 x 2 where RH is relativ e humidit y , expr essed as a pr op ortion. An alternativ e humidit y relationship su ggested by Klinger ( 1991 ), on the basis of a simple kinetic mo del for corrosion, uses the term x 2 = log[ RH / (1 − RH )] (a logistic transf ormation) instead. In most applications wh ere it is u s ed as an accel- erating v ariable, higher humidit y increases degrada- tion rates and leads to earlier failures. I n applica- tions w h ere drying is the failure mec hanism, how- ev er, an artificial enviro nment with lo w er h umidit y can b e used to accelerate a test. 7. ACCELERA TION MODEL F OR PHOTODEGRAD A T ION Man y organic comp ounds d egrade c hemically w h en exp osed to ultra violet (UV) radiat ion. Suc h degra- dation is kn o wn as photodegradation. This sect ion describ es mo dels that hav e b een used to study pho- to degradation and that are us efu l when analyzing data from accelerated photo degradation tests. Man y of the ideas in this section originated from early r e- searc h in to the effects of ligh t on ph otographic em ul- sions (e.g., James, 1977 ) and the effect that UV ex- p osure has on causing skin cancer (e.g., Blum, 1959 ). Imp ortant app licatio ns includ e p rediction of s ervice life of pro du cts exp osed to UV radiation (outdo or w eathering) and fib er-optic systems. 7.1 Time Scale and Mo del for T otal Effective UV Dosage As describ ed in Martin et al. ( 1996 ), the appro- priate time scale f or photo degradation is the total (i.e., cumulat ive ) effect iv e UV dosage, denoted by D T ot . In tuitiv ely , this total effectiv e dosage can b e though t of as the cum ulativ e n umber of photons ab- sorb ed in to the degrading material and that cause c hemical c hange. The total effectiv e UV dosage at real time t can b e expressed as D T ot ( t ) = Z t 0 D Inst ( τ ) dτ (8) where the instant aneous effectiv e UV dosage at real time τ is D Inst ( τ ) = Z λ 2 λ 1 D Inst ( τ , λ ) dλ = Z λ 2 λ 1 E 0 ( λ, τ ) (9) × { 1 − exp[ − A ( λ )] } φ ( λ ) dλ. Here E 0 ( λ, τ ) is the sp ectral irradiance (or intensit y) of the light sour ce at time τ (b oth artificial and nat- ural ligh t sources hav e p oten tially time-dep endent mixtures of ligh t at different wa v elengths, denoted b y λ ), [1 − exp( − A ( λ ))] is the sp ectral absorban ce of the material b eing exp osed (damage is caused only b y ph otons that are absorb ed in to the m aterial) , and φ ( λ ) is a quasi- quantum efficiency of the absorbed radiation (allo wing for the f act that photons at cer- tain w a v elengths ha v e a higher probabilit y of caus- ing damage than others). Th e fu nctions E 0 and A in the integ rand of ( 9 ) can either b e m easured directly or estimated f rom data and the function φ ( λ ) can b e estimated from data. A s imp le log-linear mo del is commonly used to describ e qu asi-quan tum efficiency as a function of w a v elength. That is, φ ( λ ) = exp( β 0 + β 1 λ ) . The integ rals o ve r wa vele ngth, lik e that in ( 9 ), are t ypically tak en o ve r the UV-B band (290 nm to 14 L. A . ESCOBAR AND W. Q. MEEKER 320 nm), as this is the range of wa vele ngths o ve r whic h b oth φ ( λ ) and E 0 ( λ, t ) are imp ortantly dif- feren t from 0. Longer wa velengt hs (in the UV-A band) are n ot terribly harmfu l to organic materials [ φ ( λ ) ≈ 0]. Sh orter w a ve lengths (in the UV-C band ) ha v e more energy , but are g enerally filtered out b y ozone in the atmosphere [ E 0 ( λ, t ) ≈ 0 ]. 7.2 Additivity Implicit in the mo del ( 9 ) is the assumption of ad- ditivit y . Additivit y imp lies, in th is setting, that th e photo-effect ive ness of a source is equal to the sum of the effectiv eness of its sp ectral comp onents. This part of the mo d el mak es it relativ ely easy to con- duct exp osur e tests w ith sp ecific com binations of w a v elengths [e.g., by using selected b and-pass fil- ters to d efine E 0 ( λ, τ ) functions as lev els of sp ectral in tensit y in an exp erimen t] to estimate the quasi- quan tum efficiency as a fun ction of λ . T hen the to- tal d osage mo del in ( 9 ) can b e used to predict pho- to degradation under other combinat ions of wa v e- lengths [i.e., f or other E 0 ( λ, τ ) functions]. 7.3 Recip ro city and Recip ro cit y Breakdo wn The intuitiv e id ea b ehin d recipro cit y in photo degra- dation is that the time to reac h a certain lev el of degradation is inv ersely prop ortional to th e rate at whic h ph otons attac k the material b eing degraded. Recipro cit y breakdown o ccurs when the coefficient of prop ortionalit y c hanges with ligh t in tensit y . Al- though reci pr o cit y pro vides an a dequate mo del for some degradati on pro cesses (particularly when t he range of in tensities used in exp eriment ation and ac- tual app licatio ns is not to o broad), some examples ha v e b een rep orted in wh ic h th ere is recipro cit y break- do wn (e.g., Blum, 1959 , and James, 1977 ). Ligh t inte nsity can b e affected by filters. Su nligh t is filtered by the ea rth’s atmo sph ere. In lab oratory exp eriment s, different neutral d ensit y filters are u sed to r educe the amount of ligh t passing to s p ecimens (without having an imp ortant effect on th e wa v e- length sp ectrum), pr o viding an assessmen t of the degree of recipro cit y br eakdo wn. Recipro cit y implies that the effectiv e time of exp osu re is d ( t ) = CF × D T ot ( t ) = CF × Z t 0 Z λ 2 λ 1 D Inst ( τ , λ ) dλ dτ where CF is an “acceleration factor.” F or example, commercial outdo or test exp osure sites use mirrors to concent rate light to ac hieve , sa y , “5 Suns” ac- celerati on or C F = 5. A 50% neutral den s it y fi lter in a lab oratory exp eriment will pr ovide deceleration corresp onding to CF = 0 . 5. When there is evidence of recipro cit y br eakdo wn, the effectiv e time of exp osur e is often mo deled, em- pirically , by d ( t ) = (CF) p × D T ot ( t ) (10) = (CF) p × Z t 0 Z λ 2 λ 1 D Inst ( τ , λ ) dλ dτ . Mo del ( 10 ) h as b een shown to fit data we ll and ex- p erimenta l work in the ph otographic literature sug- gests that wh en there is recipro cit y br eakdown, the v al ue of p do es n ot dep end strongly , if at all, on the w a v elength λ . A statistical test for p = 1 can b e u sed to assess the recipro cit y assu mption. 7.4 Mo del fo r Photo degradation and UV Intensit y Degradatio n (or damage) D ( t ) at time t dep ends on environmen tal v ariables lik e UV , temp a nd RH , that ma y v ary ov er time, say according to a mul- tiv ariable pr ofile ξ ( t ) = [UV , temp , RH , . . . ]. L ab ora- tory tests are condu cted in we ll-con trolled en viron- men ts, usu ally holding these v ariables constant (al- though sometimes such v aria bles are pur p osely c hanged during an exp erimen t, as in step-stress accel erated tests). Int erest often cente rs, ho w ev er, on life in a v aria ble environmen t. Figure 7 sho ws some typica l sample paths (for FTIR p eak at 1510 cm − 1 , repre- sen ting b enzene ring mass loss) for several sp ecimens of an ep o xy exp osed to UV radiation usin g a band - pass filter with a nominal cent er at 306 nm. Separate paths are shown for eac h com bination of (10, 40, 60, 100)% neutral den s it y filters and 45 ◦ C and 55 ◦ C, as a function of total (c umulativ e) a bsorb ed UV-B dosage. Th ese sample paths migh t b e mo deled by a giv en functional form, D ( t ) = g ( z ) , z = log [ d ( t )] − µ, where z is scaled time and g ( z ) would usually b e suggested b y kno wledge of the kinetic mo del (e.g., linear for zeroth-order kinetics and exp onentia l for first-order kinetics), although emp irical curve fitting ma y b e adequ ate for p urp oses where the amount of extrap olation in th e time dimension is not large. As in SAFT mo dels, µ can b e mo deled as a function of explanatory v ariables lik e temp erature and hu- midit y when these v ariables affect the degradation rate. ACC ELERA TED TEST MODELS 15 8. VOL T AGE AND VOL T AGE-STRESS A CCELERA TION Increasing v oltage or v oltage stress (electric field) is another commonly used metho d to accelerate fail- ure of electrical materials and comp onen ts lik e light bulbs, capacitors, transformers, heaters and insula- tion. V oltage quan tifies the amoun t of force needed to mo v e an electric charge betw een tw o p oin ts. Ph ys- ically , v oltage can b e thought of as the amount of pressure b ehind an electrical cur ren t. V oltage stress quan tifies v oltage p er unit of thic kness across a d i- electric and is measured in units of v olt/thic kness (e.g., V / mm or kV / mm). 8.1 Voltage Acceleration Mec hanisms Dep ending on the failure mo d e, higher v oltage stress can: • accelerate failure-causing electro c hemical reactions or th e growth of failure-causing discon tin uities in the d ielectric material. • increase the volta ge stress r elativ e to d ielectric strength of a sp ecimen. Units at higher stress w ill tend to fail so oner than those at lo we r stress. Sometimes one or the ot her of these effects will b e the pr imary cause of failure. In other cases, b oth effects will b e imp ortant. Example 8 ( A c c eler ate d life test of insulation for gener at or armatur e b ars ). Doganakso y , Hahn and Meek er ( 2003 ) discuss an AL T for a n ew mica-based insulation design for generator armatur e bars (GABs). Degradatio n of an orga nic bind er in the insulation causes a decrease in v oltag e strength and this was the primary cause of failure in the insulation. The insulation w as d esigned for u se at a v oltage stress of 120 V / m m. V oltage-endurance tests were conducted on 15 elect ro d es a t eac h of fiv e ac celerated v oltage lev els b et w een 170 V / mm and 220 V / mm (i.e., a total of 7 5 electro des). Eac h test w as run for 6 480 hours at wh ich p oint 39 of the electro des h ad not y et failed. T able 1 giv es the data from these tests. The insulation engineers were int erested in the 0 . 01 and 0 . 05 quanti les of lifetime at th e use condition of 120 V / mm. Figure 8 p lots the in s u lation lifetimes against volt age stress. 8.2 Inverse P o w er Relationship The in v erse p o w er relationship is fr equen tly used to describ e the effect that stresses lik e v oltag e and pressure ha v e on lifetime. V oltage is used in the fol- lo wing d iscussion. When the thic kness of a dielectric material or insu lation is constan t, volt age is prop or- tional to vo ltage stress. L et volt denote volt age and let volt U b e the vol tage at use conditions. Th e life- time at stress lev el volt is giv en by T ( volt ) = T ( volt U ) AF ( volt ) = volt volt U β 1 T ( volt U ) Fig. 7. Sampl e p aths for wave numb er 1510 cm − 1 and b and-p ass filter with nominal c enter at 306 nm for differ ent c ombi- nations of temp er atur e ( 45 and 55 ◦ C ) and neutr al density filter [ p assing ( 10, 40, 60 and 100 ) % of photons acr oss the UV-B sp e ctrum ] . 16 L. A . ESCOBAR AND W. Q. MEEKER Fig. 8. GAB insulation data. Sc att erplot of life versus volt- age. Censor e d observations ar e indic ate d by ∆ . where β 1 , in general, is negativ e. The mo d el has SAFT form with accelerat ion factor AF ( volt ) = AF ( volt , volt U , β 1 ) = T ( volt U ) T ( volt ) (11) = volt volt U − β 1 . If T ( vol t U ) has a log-location-scale d istribution with parameters µ U and σ , then T ( volt ) also has a log- lo cation-sca le distribu tion with µ = β 0 + β 1 x , where x U = log( volt U ), x = log ( volt ), β 0 = µ U − β 1 x U and σ does not dep end on x . Example 9 ( Time ac c eler ation for GAB insu- lation ). F or the GAB insu lation data in Exam- ple 8 , an estimate for β 1 is b β 1 = − 9 (metho d s for computing suc h estimates are describ ed in Meek er and Escobar, 1998 , Chapter 19). Recall that the de- sign vo ltage stress is volt U = 120 V / m m and con- sider testing at vol t = 170 V / mm. Thus, using β 1 = b β 1 , A F (170) = (170 / 12 0) 9 ≈ 23. Thus by increasing Fig. 9. Ti me-ac c eler ation factor as a f unction of voltage str ess and exp onent − β 1 = − 7 , − 9 , − 11 . v oltage stress from 120 V / mm to 170 V / mm, one estimates that lifetime is shortened by a factor of 1 / AF (170) ≈ 1 / 23 = 0 . 04. Figure 9 plots AF v er- sus v olt for β 1 = − 7 , − 9 , − 11. Using direct compu- tations or from the plot, one obtains AF (170 ) ≈ 11 for β 1 = − 7 and A F (170) ≈ 46 for β 1 = − 11. Example 10 ( A c c eler ate d life test of a mylar- p olyur ethane insulation ). Meek er and Escobar ( 1998 , Section 19.3) r eanalyzed AL T data from a sp ecial t yp e of m ylar-p olyur ethane insulation used in high- p erformance electromagnets. Th e data, originally fr om Kalk anis and Rosso ( 1989 ), giv e time to dielectric breakdo wn of un its tested at (10 0.3, 122. 4, 157.1, 219.0, 361.4) kV / mm. The pur p ose of the AL T was to ev aluate the reliabilit y of the insulating struc- ture and to estimate the life d istrib ution at sys- tem design vol tages, assumed to b e 50 kV / mm. Fig- ure 10 sho ws that failures o ccur muc h so oner at high v oltage stress. Except for the 361.4 kV / m m data, the relationship b et w een log life and log v oltage ap- T able 1 GAB insulation data V oltage stress Lifetime (V / mm) (thousand hours) 170 15 censored a 190 3.248, 4.052, 5.304, 12 censored a 200 1.759, 3.645, 3.706, 3.726, 3.990, 5.153, 6.368 , 8 censored a 210 1.401, 2.829, 2.941, 2.991, 3.311, 3.364, 3.474 , 4.902, 5.639, 6.021 , 6.456, 4 censored a 220 0.401, 1.297, 1.342, 1.999, 2.075, 2.196, 2.885 , 3.019, 3.550, 3.566 , 3.610, 3.659, 3.687, 4.152, 5.572 a Units were censored at 6.480 th ousand hours. ACC ELERA TED TEST MODELS 17 Fig. 10. Inverse p ower r elationship-lo gnor mal mo del fit- te d to the mylar- p olyur ethane dat a (a lso showing the 361.4 kV / mm data omitte d fr om the ML estimation). p ears to b e appr o ximately linear. Meek er and Es- cobar ( 1998 ), in their reanalysis, omitted the 361.4 kV / mm data because it is clear that a new f ailure mo de had manifested itself at this h ighest lev el of v oltage stress. Insulation engineers ha v e suggested to us that the new failure mo d e wa s lik ely caused b y thermal bu ildup that w as not imp ortant at lo wer lev els of v oltage stress. 8.3 Physical Motivation fo r the Inverse P ow er Relationship fo r Voltage-Stress Accele ration The in v erse p o we r r elatio nsh ip is widely used to mo del life as a fu nction of pressu re-lik e accelerat- ing v aria bles (e.g., stress, pr essure, v oltage stress). This relationship is generally considered to b e an empirical mo d el b ecause it has no formal basis from kno wledge of the ph ysics/c hemistry of the mo deled failure mo d es. It is commonly used b ecause engi- neers ha v e found, ov er time, that it often provides a useful d escription of certain kinds of A T data. This section p r esen ts a simp le physica l m otiv ation for th e inv erse p o we r r elatio nsh ip for v oltage-st ress accele ration under constan t temp erature situations. Section 9.2 describ es a more general mo del for vo lt- age accel eration in v olving a combinatio n of temp er- ature and v oltage accelerat ion. This discussion h ere is for insulation. The ideas extend, ho wev er, to other d ielectric materials, pro d- ucts and devices lik e insulating fluids, transform- ers, capacitors, adhesiv es, conduits and con tainers that can b e mo d eled by a stress-strength int erfer- ence mo del. In applications, an insu lator should not conduct an electrical curren t. An insulato r has a charact er- istic dielectric str en gth which can b e exp ected to b e Fig. 11. Diele ctric str ength de gr ading over time, r elative to voltage-s tr ess l evels (horizont al lines). random from u nit to u nit. The dielectric strength of an insulation sp ecimen op erating in a sp ecific en- vironmen t at a sp ecific v oltage ma y d egrade with time. F igure 11 sh o ws a family o f simple cur v es to mo del degradation and unit-to-unit v ariabilit y in di- electric strength o v er time. The u nit-to-unit v ari- abilit y could b e caused, for example, by materials or man ufacturing v aria bilit y . Th e horizon tal lines r ep- resen t v oltage-st ress lev el s that m igh t b e present in actual op eration or in a n accele rated test. When a sp ecimen’s dielectric s trength falls b elo w the applied v oltage stress, there will b e flash-o v er, a short cir- cuit, or other failure-causing damage to the insula- tion. Analytic ally , supp ose that degrading dielectric strength at age t can b e expressed as D ( t ) = δ 0 × t 1 /β 1 . Here, as in S ection 5.4 , failure o ccurs when D ( t ) crosses D f , the app lied v oltage stress, d en oted by volt . In Figure 11 , the u nit-to-unit v ariabilit y is in the δ 0 parameter. Equating D ( T ) to vol t and solving for failure time T giv es T ( volt ) = volt δ 0 β 1 . Then th e accele ration factor for volt v ersus volt U is AF ( volt ) = AF ( volt , volt U , β 1 ) = T ( volt U ) T ( volt ) = volt volt U − β 1 18 L. A . ESCOBAR AND W. Q. MEEKER whic h is an inv erse p o wer relationship, as in ( 11 ). T o extend this mo d el, sup p ose that higher v oltage also leads to an increase in th e degradation rate and that this increase is describ ed with the degradation mo del D ( t ) = δ 0 [ R ( volt ) × t ] 1 /γ 1 where R ( volt ) = γ 0 exp[ γ 2 log( vol t )] . Supp ose failure o ccurs wh en D ( t ) crosses D f , the ap- plied v oltage stress, denoted b y volt . Th en equating D ( T ) to volt and solving f or failure time T giv es the failure time T ( volt ) = 1 R ( volt ) volt δ 0 γ 1 . Then the ratio of failure times at vol t U v ersus volt is th e accele ration factor AF ( volt ) = T ( volt U ) T ( volt ) = volt volt U γ 2 − γ 1 , whic h is aga in an inv erse p o w er relationship with β 1 = γ 1 − γ 2 . This motiv atio n for the inv erse p ow er relationship describ ed here is not based on an y fundamenta l un- derstanding of what happ ens to the insulating ma- terial at the molecular lev el o v er time. As we de- scrib e in Section 11 , the use of suc h fun d amen tal understanding could pr o vide a b etter, m ore credible mo del for extrap olation. 8.4 Other Inverse P o w er Relationships The in v erse p o w er relat ionship is also co mmonly used for other accelerating v ariables including pres- sure, cycling rate, electric current , stress and humid- it y . Some examples are giv en in Section 9 . 8.5 A M ore General Empiric al P o w er Relationship: Box –Cox T ransformations As sho wn in Section 8.2 , the in v erse p o we r r ela- tionship induces a log-transformation in volt giving the mo del µ = β 0 + β 1 x, wh ere x = log( vol t ) . There migh t be ot her transformations of volt that could pro vide a b etter description of the data. A general, and useful, approac h is to expand the f orm ulation of the mo del by add ing a parameter or parameters and in v estigating the effect of p erturbing the added pa- rameter(s), to see the effect on answers to questions of interest. Here this appr oac h is used to expand the in v erse p o we r relationship mo d el. Supp ose that X 1 is a p ositiv e accelerating v ariable and X 2 is a collectio n of other explanatory v ariables, some of whic h migh t b e accelerating v ariables. Con- sider the mo del µ = β 0 + β 1 X 1 + β ′ 2 X 2 , w here the β ’s are unknown parameters. W e start by replacing X 1 with the more general Bo x–Co x transformatio n (Bo x and Cox, 1964 ) on X 1 . In particular, w e fit the mo del µ = γ 0 + γ 1 W 1 + γ ′ 2 X 2 where the γ ’s are unkno wn parameters and W 1 = X λ 1 − 1 λ , λ 6 = 0, log( X 1 ) , λ = 0. (12) The Bo x–Co x transformation (Bo x and Co x, 1964 ) w as originally prop osed as a simplifying transf orma- tion for a resp onse v ariable. T r ansformation of accel- erating and explanatory v ariables, ho w ev er, pro vides a conv enien t extension of the accelerating mo deling c hoices. Th e Bo x–Co x transformation includ es all the p o we r transformations and b ecause W 1 is a con- tin uous function of λ , ( 12 ) provi des a conti nuum of transformations for p ossible ev aluat ion and mo del assessmen t. Th e Bo x–Co x trans f ormation parame- ter λ can b e v aried o ve r some range of v alues (e.g., − 1 to 2) to see the effect of different vo ltage-life relationships on the fitted mo d el and inferences of in terest. The results f r om the analysis can b e dis- pla y ed in a n umber of different w a ys. F or fixed X 2 , the Bo x–Co x transformation m o del accele ration factor is AF BC ( X 1 ) = exp X λ 1 U − X λ 1 λ γ 1 , if λ 6 = 0, X 1 U X 1 γ 1 , if λ = 0, where X 1 U are u se conditions for the X 1 accele rating v aria ble. AF BC ( X 1 ) is monotone increasing in X 1 if γ 1 < 0 and monotone decreasing in X 1 if γ 1 > 0 . Example 11 ( Spring life test data ). Meek er, Es- cobar and Za y ac ( 2003 ) analyze spring accel erated life test data. Time is in units of kilo cycles to failure. The explanatory v ariables are pro cessing temp era- ture (T emp) in d egrees F ahrenheit, spring compres- sion displacemen t (Strok e) in mils, and the categor- ical v ariable Metho d wh ic h tak es the v alues New or Old. Springs th at had not failed after 5 000 kilo cy- cles w ere co ded as “Su sp end ed .” At the condition 50 mils, 500 ◦ F and the New pr o cessing metho d, there w ere no failures b efore 5000 kilo cycles. All of the ACC ELERA TED TEST MODELS 19 Fig. 12. Plot of the ML estimate of the 0.10 quantile of spring l ife at 20 mils, 600 ◦ F, using the new m etho d versus the Str oke di splac ement Box–Cox tr ansformation p ar amet er λ with 95% c onfidenc e l imits. other conditio ns had at l east some failures, a nd at fiv e of the t w elv e conditions all of the springs failed. A t s ome of the conditions, one or more of th e springs had not failed after 5000 kilo cycles. Figure 12 (see Meek er, Escobar and Zay ac, 2003 ) is a plot of the 0.10 W eibull quantil e estimates versus λ f rom − 1 and 2. Approxi mate confidence in terv als are also giv en. The plot illustrates the sensitivit y of the 0.10 quanti le estimate to the Bo x–Co x trans - formation. Note that λ = 0 corresp on d s to t he log- transformation that is commonly used in fatigue life v ersus stress mo d els. Also, λ = 1 corresp onds to no transformation (or, m ore p r ecisely , a linear trans for- mation that affects the regression parameter v alues but not the u nderlying structure of the mo del). Fig- ure 12 shows that fatigue life d ecreases by m ore than an order of magnitude as λ mov es from 0 to 1. In particular, the ML estimate of the 0.10 quan tile d e- creases from 900 megac ycles to 84 megacyc les when λ is c hanged fr om 0 to 1. Figure 13 is a profile like liho o d plot for the Box– Co x λ parameter, provi ding a visualizatio n of wh at the data say ab out th e v alue of this parameter. In this case the p eak is at a v alue of λ close to 0; this is in agreement with the commonly used fa- tigue life/stress mo del. V alues of λ close to 1 are less plausible, but cannot b e ruled out, based on these data alone. Th e engineers, based on exp eri- ence with the same failure mo de and similar mate- rials, felt that the actual v alue of λ w as near 0 (cor- resp ondin g to the log-transformation) and almost certainly less than 1. Thus a conserv ativ e decision could b e made b y designing with an assumed v alue of λ = 1 . Ev en t he somewhat o ptimistic ev al uation using λ = 0 w ould not meet the 500 megacycle tar- get life. Meek er, Escobar and Za ya c ( 2003 ) also discuss the sensitivit y to the assumed form of the temp eratur e- life relationship and the sensitivit y to c hanges in the assumed d istribution. 9. A CCELERA TION MODELS WITH MORE THAN ONE ACCELERA TING V ARIA B LE Some accelerate d tests us e more than one acceler- ating v ariable. Such tests m igh t b e suggested when it is kno wn that tw o or more p oten tial acc elerat- ing v aria bles cont ribu te to d egradation and failure. Using tw o or more v ariables ma y p ro vide needed time-acc eleration without requir in g leve ls of th e in- dividual acce lerating v ariables to b e to o high. Some accele rated tests include engineering v ariables that are not accelerating v ariables. Examples include m a- terial type, design, op erator, and so on. 9.1 Generalized Eyring Relationshi p The generalized Eyring relationship extends the Eyring relationship in S ection 5.3 , allo wing for one or more non thermal accele rating v ariables (suc h as h umidity or vol tage). F or one additional nonther- mal accelerat ing v ariable X , the mo d el, in terms of reaction rate, can b e written as R ( temp , X ) = γ 0 × ( temp K) m × exp − γ 1 k × temp K (13) Fig. 13. Pr ofile likeliho o d plot for the Str oke Box–Cox tr ans- formation p ar ameter λ in the spring li fe mo del. 20 L. A . ESCOBAR AND W. Q. MEEKER × exp γ 2 X + γ 3 X k × temp K where X is a f u nction of the non thermal s tr ess. The parameters γ 1 = E a (activ ation energy) and γ 0 , γ 2 , γ 3 are c haracteristics of the particular p hysical/ c hemical p ro cess. Additional factors like the one on the righ t-hand side of ( 13 ) can b e added for other non thermal accelerat ing v ariables. In the follo wing sections, follo wing common prac- tice, w e set ( temp K) m = 1, using what is essen tially the Arrh enius temp erature-acceleratio n r elatio nsh ip. These sections describ e some imp ortan t sp ecial-case applications of this more g eneral mo del. If the un- derlying mod el r elating the d egradation pro cess to failure is a S AFT mo del, then, as in Section 5.2 , the generalize d Eyring relationship can b e used to describ e the relatio nsh ip b et w een times at differen t sets of conditions temp and X . In particular, the accele ration factor relativ e to use conditions temp U and X U is AF ( temp , X ) = R ( temp , X ) R ( temp U , X U ) . The same app roac h used in Section 5.4 s h o ws the effect of accelerat ing v aria bles on time to f ailure. F or example, s u pp ose that T ( tem p U ) (time at use or some other baseline temp erature) has a log-lo cation- scale distrib u tion with p arameters µ U and σ . Then T ( temp ) h as the same log-location-scale distribution with µ = µ U − log[ AF ( temp , X )] (14) = β 0 + β 1 x 1 + β 2 x 2 + β 3 x 1 x 2 where β 1 = E a , β 2 = − γ 2 , β 3 = − γ 3 , x 1 = 11605 / ( temp K), x 2 = X and β 0 = µ U − β 1 x 1 U − β 2 x 2 U − β 3 x 1 U x 2 U . 9.2 T emp erature-Voltage Acceleration Mo dels Man y differen t mo dels hav e b een used to d escrib e the effect of the com bination of temp erature and v oltage on acce leration. F or instance, Meek er and Escobar ( 1998 , Sectio n 17.7) analyzed data from a study relating v oltag e and te mp erature to the fail- ure of gla ss capacitors. They mo d eled the location parameter of log- lifetime as a simple linear function of temp ◦ C and volt . The generalized Eyring rela- tionship in Section 13 can also b e u sed with X = log( volt ) , as don e in Bo yk o and Gerlac h ( 1989 ). Klinger ( 1991 ) mo deled the Bo yko and Gerlac h ( 1989 ) data b y including second-order terms for b oth accel- erating v ariables. T o derive the time-ac celeration facto r for th e ex- tended Arrhenius relationship with te mp and v olt , one can follo w steps analogous to those outlined in Section 8.2 . Using ( 13 ) with X = log ( volt ), one ob- tains R ( temp , volt ) = γ 0 × exp − E a k × temp K × exp γ 2 log( volt ) + γ 3 log( volt ) k × temp K . Again, failure o ccurs when the dielectric strength crosses the applied v oltage stress, that is, D ( t ) = volt . This o ccurs at time T ( temp , v olt ) = 1 R ( temp , volt ) volt δ 0 γ 1 . F rom this, one compu tes AF ( temp , volt ) = T ( temp U , volt U ) T ( temp , v olt ) = exp[ E a ( x 1 U − x 1 )] × volt volt U γ 2 − γ 1 × { exp[ x 1 log( vol t ) − x 1 U log( vol t U )] } γ 3 , where x 1 U = 1160 5 / ( temp U K) and x 1 = 11 605 / ( temp K). W hen γ 3 = 0, there is n o in teracti on b e- t w een temp erature and volta ge. In this case, AF ( temp , volt ) can b e factored in to tw o terms, one that inv ol ves temp erature only and another term that in v olv es v oltage only . Th us, if there is no in- teractio n, the contribution of temp erature (v oltage ) to acceleratio n is the same at all lev els of v oltage (lev els of temp erature). 9.3 T emp erature-Current Densit y Acceleration Mo dels d’Heurle and Ho ( 1978 ) and Ghate ( 1982 ) studied the effect of increased curr en t densit y (A / cm 2 ) on electromig ration in micro electronic aluminum con- ductors. High cur r en t dens ities cause atoms to mo v e more rapidly , ev en tually causing extrusion or v oids that lead to comp onent fai lure. A Ts for electromi- gration often use increased curr ent density and tem- p erature to accele rate the test. An extended Arrh e- nius r elationship could b e appr op r iate f or s u c h data. ACC ELERA TED TEST MODELS 21 In p articular, w hen T has a log-location-scale distri- bution, then ( 13 ) applies with x 1 = 11605 / temp K, x 2 = log( curr ent ). Th e mo del with β 3 = 0 (without in teraction) is kno wn as “Blac k’s equation” (Blac k, 1969 ). Example 12 [ Light emitting dio de ( LED ) r eli- ability ]. A degradation stu d y on a ligh t emitting dio de (LED) device wa s conducted to study the ef- fect of current and temp erature on ligh t outp u t ov er time an d to p redict life at us e conditions. A u nit w as said to ha v e failed if its ligh t output was re- duced to 60% of its initial v alue. Tw o lev els of cur- ren t and six lev els of temp erature w ere used in the test. Figure 14 sho ws the LED ligh t outpu t data v er- Fig. 14. Re lative change in light output fr om 138 hours at differ ent levels of temp er atur e and curr ent. R elative change i s i n the l ine ar sc ale and hours is in the squar e-r o ot sc ale which line arizes the r esp onse as a function of tim e. Fig. 15. LED devic e data. L o gnor mal multiple pr ob abil i ty plot showing the fitte d Arrhenius- inverse p ower r elationship l o g- normal m o del (with no inter action) f or the failur e LED data. The plots also show the estimate of F ( t ) at use c onditions, 20 ◦ C and 20 mA. 22 L. A . ESCOBAR AND W. Q. MEEKER sus time in hour s, in the square-ro ot scale. No units had faile d dur in g the test. F or a simp le method of degradation analysis, p redicted pseudo failure times are obtained by using ordinary lea st squares to fit a line th rough eac h s amp le path on the s quare-ro ot scale, for “Hours,” an d the linear scale for “Rela- tiv e Change.” Figure 15 sho ws the ML fit of the Arrhenius-inv erse p ow er relationship lognormal mo d el (with no interact ion) for the pseudo f ailure L ED data. The data at 130 ◦ C and 40 mA w ere omit- ted in the mo d el fitting b ecause it wa s determined that a new failure mo de had manifested itself at that highest lev el of test conditions (initial efforts by en- gineers to use the bad data had resulted in physi- cally imp ossible estimates of life at the use condi- tions). Figure 15 also s h o ws the estimate of F ( t ) at use conditions of 20 ◦ C and 20 mA . 9.4 T emp erature-Humidit y A cceleration Mo dels Relativ e h umidit y is another en vironmental v ari- able that can b e com bined w ith temp erature to ac- celerate corrosion or other c hemical reactio ns. Examples of applications includ e paints and coat- ings, electronic d evices and electronic semiconduc- tor parts, circuit b oards, p ermallo y sp ecimens, f o o ds and pharmaceuticals. Although m ost AL T mo dels that in clud e humidit y were deriv ed empirically , some h umidity mo d els h a v e a physica l basis. F or example, Gillen and Mead ( 1980 ) and Klinger ( 1991 ) stud- ied kinetic mo dels relating aging with humidit y . Lu- V alle, W elsher and Mitc hell ( 1986 ) pro vided physic al basis for studying the effect of humidit y , temp era- ture and v oltage on the failure of circuit b oards. See Bo ccaletti et al. ( 1989 ), Ch apter 2 of Nelson ( 1990 ), Jo yce et al. ( 1985 ), P ec k ( 1986 ) and Pec k and Zierdt ( 1974 ) for AL T applicati ons inv olving temp erature and h umid it y . The extended Arrhenius relationship ( 13 ) applied to AL Ts w ith temp erature and humidit y u ses x 1 = 11605 / temp K , x 2 = log( RH ) and x 3 = x 1 x 2 where RH is a p r op ortion denoting relativ e humidit y . The case when β 3 = 0 (no temp erature-humidit y in terac- tion) is known as “P ec k’s relationship” and was used b y P ec k ( 1986 ) to study fail ures of ep o xy pac king. Klinger ( 1991 ) suggested th e term x 2 = log[ RH / (1 − RH )] instead of log( RH ). Th is alternativ e relatio nsh ip is b ased on a kin etic mo del for corrosion. 9.5 Mo deling Photo degradat ion T emp erature and Humidit y Effects When mo d eling photo degradation, as describ ed in Section 7 , it is often necessary to account for the ef- fect of temp erature and humidit y . The Arrhenius rate reaction mo d el ( 3 ) can b e used to scale time (or dosage) in the usual mann er. Humidity is also kno wn to affect photo degradation rate. Sometimes the r ate o f degradation w ill b e dir ectly affecte d by moisture con ten t o f the degrading mat erial. In this case one can use a mo d el suc h as describ ed in Burch, Martin and V anLandin gham ( 2002 ) to predict m ois- ture con ten t as a function of r elativ e humidit y . Com bining these mo del terms with the log of total effectiv e UV dosage from ( 8 ) giv es log( d ; CF , p ) = log [D T ot ( t )] + p × log(CF) , µ = β 0 + E a k × temp K + C × MC(RH) , where temp K is temp erature in kelvin, MC(RH) is a mo del prediction of moisture con ten t, as a function of relativ e humidit y , k is Boltzmann’s constant, E a is a quasi-ac tiv ati on energy , and β 0 and C are pa- rameters that are c haracteristic of th e material and the degradation pro cess. Figure 16 sho ws the same data d ispla y ed in Figure 7 , except that the time scale for the data has b een adjusted for the differences in b oth th e n eu tral density filters and the t wo d ifferent lev els of temp erature, br in ging all data to the scale of a 100% neutral densit y fi lter and 55 ◦ C. 9.6 The Danger of Induced Inte ractions As illustrate d in Example 13 of P ascual, Meek er and Escobar ( 2006 ) (using data related to Exam- ple 12 of this pap er), inte ractions can cause d ifficult y in the interpretati on of accelerated test results. Ini- tially , in th at example, an inte raction term had b een used in the mo del fitting to pro vide a mo d el that fits the data b etter at the high leve ls of temp erature and current densit y that h ad b een used in the test. Ex- trap olation to the use conditions, how ev er, pro duced estimates of life that we re shorter than the test con- ditions! The problem was that with the int eraction term, there was a saddle p oint in the resp onse sur- face, outside of the r an ge of the d ata. Extrap olation b ey ond the saddle p oin t resu lted in n onsensical pre- dictions that lo wer t emp erature and cur ren t would lead to shorter life (in effect, the extrap olation was using a qu adratic mo del). It is imp ortan t to c ho ose the definition of accele r- ated test exp erimenta l factors with care. Inappr op r i- ate c hoices can induce strong in teractions b et wee n the facto rs. Su pp ose, for example, that there is no in teraction b et w een the factors vol tage stress and ACC ELERA TED TEST MODELS 23 Fig. 16. Sampl e p aths for wave numb er 1510 cm − 1 and b and-p ass fil ter with nomi nal c enter at 3 06 nm for differ ent c ombi- nations of temp er atur e ( 45 and 55 ) ◦ C and neutr al density filter (p ass ing 10, 40, 60 and 100% of photons acr oss the UV-B sp e ctrum). sp ecimen thic kness in an acceleratio n mo del f or di- electric f ailure. Then µ = β 0 + β 1 Thic kness + β 2 V oltage S tress where thickness is measured in mm and V oltag e Stress = V oltage / Thic kness is measured in V / mm. If th e mo d el is written in terms of thic kness and v oltage, µ = β 0 + β 1 Thic kness + β 2 V oltage S tress × Thic kness . Th us, the v ariables v oltage and thic kness would ha ve a strong in teraction. Similarly , if RH and temp erature h a v e no inte rac- tion in the accelerat ion m o del for a corrosion f ailure mec hanism, it is easy to s h o w that the strong effect that temp erature has on saturation v ap or pressu re w ould imply that the factors temp erature and v ap or pressure w ould hav e a strong in teraction. These concerns are related to the “sliding factor” ideas describ ed in Phadke ( 1989 , Section 6.4). 10. COMMENTS ON THE APPL ICA T ION OF A CCELERA TION MODELS 10.1 Concerns Ab out Extrap olat ion All accelerated tests in vo lv e extrap olation. The use of extrap olation in app licatio ns requires justi- fication. It is alw a ys b est wh en th e needed justifica- tion comes from deta iled ph ysical/c hemical kn o wl- edge of the effect of the accelerating v ariable on the failure mec hanism. As a practic al matt er, h o w ev er, suc h kno wledge is often lac king, as are time and re- sources for acquiring the n eeded kn o wledge. Emp ir - ical relationships are often used as justification, but rarely are data av ailable to chec k the relationship o v er the en tire range of int erest for the accelerating v aria ble(s). Ev ans ( 1977 ) m akes the imp ortant p oin t that the need to make rapid reliabilit y assessmen ts and the fact that accelerate d tests may b e “the only game in to wn” are not sufficien t t o justify the us e of the metho d. J ustification must b e based on physica l mo d - els or empirical evidence. Ev ans ( 1991 ) d escrib es dif- ficulties with accele rated testing and suggests the use of sensitivit y analysis, su c h as that describ ed in Meek er, Escobar and Zay ac ( 2003 ). He also com- men ts that accelerat ion factors of 10 “are not u n- reasonable” but that “factors muc h larger than that tend to b e figmen ts of the imaginati on and lots of correct b ut irrelev ant arithmetic.” 10.2 Som e B a sic G uidelines Some guid elines for the use of accelerati on mo d els include: • A Ts m ust generate the same f ailure mo de o ccur- ring in the fi eld. Generally , accele rated tests are u sed to o btain information ab out one particular, relat ive ly sim- ple failure mec hanism (or corresp ond ing degra- dation measure). If there is more than one fail- 24 L. A . ESCOBAR AND W. Q. MEEKER ure mo de, it is p ossible that the different failure mec hanisms w ill b e accelerate d at differen t rates. Then, unless this is account ed for in the mo d eling and analysis, estimates could b e seriously incor- rect wh en extrap olating to lo we r use lev els of the accele rating v ariables. • Accelerating v ariables should b e c hosen to corre- sp ond w ith v ariables that cause actual failures. • It is u seful to in ve stigate previous attempts to accele rate fail ur e mec hanisms similar to the ones of inte rest. There are man y researc h rep orts and pap ers that ha v e b een pub lish ed in the ph ysics of failure literature. Th e ann ual P r o c e e dings of the International R eliability Physics Symp osium , sp onsored b y the IEEE Electron Devices So ciet y and the IEEE Reliabilit y So ciet y , cont ain numer- ous arti cles describing p h ysical mod els f or a ccel- eration and failure. • Accelerated tests should b e designed, as m uch as p ossible, to min imize the amount of extrap ola- tion required, as describ ed in Chapters 20 and 21 of Meek er and Escobar ( 1998 ). High lev els of ac- celerati ng v ariables can cause extraneous failure mo des that w ould never o ccur at use lev els of the accele rating v ariables. If extraneous failures are not recognized and prop erly handled, they can lead to seriously incorrect conclusions. Also, the relationship may not b e accurate enough o v er a wide range of accele ration. • In practice , it is difficult or i mpr actical to v erify accele ration relationships o v er the en tire range of in terest. Of course, accelerate d test data should b e used to lo ok for departu r es from the assumed accele ration mo del. It is imp ortan t to recogniz e, ho w ev er, that th e a v aila ble data will generally pr o- vide v ery little p ow er to det ect anything bu t the most serious mo d el inadequacies. T ypically there is n o useful diagnostic inf ormation ab out p ossible mo del inadequacies at accel erating v ariable lev els close to use conditions. • Simp le mo dels with the righ t sh ap e hav e generally pro v en to b e more useful than elab orate multipa- rameter mo dels. • Sensitivit y analyses sh ould b e us ed to assess the effect of p erturbing u ncertain inpu ts (e.g., inputs related to mo del assu mptions). • Accelerated test p rograms should b e planned and conducted by teams including in d ividuals kn o wl- edgeable about the pro d uct a nd its use en viron- men t, the ph ysical/c hemical/ mec hanical asp ects of the failure mo de, an d the statistica l asp ects of the d esign and analysis of reliabilit y exp eriments. 11. FUTURE RESEARCH IN THE DEVELOPMENT OF ACCELERA TED TEST MODELS Researc h in the d ev elopmen t of accelerated test mo dels is a m ultidisciplinary activit y . Statisticians ha v e an imp ortan t role to p la y on the teams of sci- en tists that dev elop and u se accelerated test mo d els. On su c h a team engineers and scient ists are primar- ily resp onsib le for: • Identifying and enumerating p ossible failure mo des and, for new p ro ducts, predicting all p ossible life- limiting f ailure mo des. • Understand ing the physical/ chemic al failure mec h- anisms that lead to a pro duct’s failure mo des and for identifying accelerating v ariables t hat can be used to accelerate the failure mec hanism. • Su ggesting deterministic physica l/c hemical math- ematical r elatio nsh ips b etw een the rate of the fail- ure mec hanisms and the accelerating v ariable(s). When such a relationship is not av ailable, they ma y b e able to pro vide guidance from standard practice or pr evious exp erience with similar pro d- ucts and materials. Statisticia ns are imp ortan t for: • Planning appropriate exp erimen ts. Accelerated test programs often start with simple exp erimen ts to understand the failure m o des that can o ccur and the b eha vior of mec hanisms that can cause fail- ures. Use of traditional metho d s f or d esigned ex- p eriments is imp ortan t for these tests. In addition, there ma y b e sp ecial features of accelerated tests (e.g., censoring) that requir e sp ecial test plan- ning metho ds (see C hapter 6 of Nelson, 1990 , and Chapter 20 of Meek er and Escobar, 1998 , for dis- cussion of accelerated test planning). • Providing exp ertise in the analysis of data aris- ing from p reliminary studies and the accelerated tests themselv es. F eatures su c h as censoring, mul- tiple failure mo des and mo dels that are nonlin- ear in the paramet ers are common. Metho ds for detecting mo del d epartures are particularly im- p ortan t. Mo d el departu r es ma y suggest pr ob lems with the data, sources of exp erimenta l v ariabilit y that m igh t b e eliminated or problems with the suggested mo del that ma y suggest change s to the prop osed mo del. • Identifying sources of v ariabilit y in exp erimen tal data (either degradation data or life data) that re- flect actual v ariabilit y in the failure m ec hanism. ACC ELERA TED TEST MODELS 25 F or this pur p ose it is generally usefu l to compare field data. In most applica tions there will b e ad- ditional v aria bilit y in field data and it is imp or- tan t to u nderstand the differences in ord er to de- sign app r opriate lab oratory exp eriments and to b e able to d r a w useful conclusions and pr edictions from lab oratory data. • W orking within cross-disciplinary teams to de- v elop statistical mo dels of failure and accelera- tion based on fund amen tal understand in g of fail- ure mec hanisms. With fu ndament al un derstand- ing of failure mec hanisms and kn o wledge of s ources of v ariabilit y , it is p ossible to dev elop, from fir st principles, fail ure-time d istributions and acceler- ation mo dels. Bette r, more credible, mo d els for extrap olation should r esult from such mo deling efforts if the assu mptions and other inp uts are ac- curate. Some examples of where su ch mo dels h a v e b een d ev elop ed include – Fisher a nd Tipp ett ( 1928 ) deriv ed the asymp- totic distributions of extreme v alues and these results pro vide fund amen tal motiv atio n for use of distribu tions suc h as the W eibull distribution (one of the three distributions of m in ima) in re- liabilit y applications i n whic h failure is ca used b y the first of many similar p ossible ev en ts (e.g., the failure of a large system with many similar p ossible failure p oin ts, none of wh ic h dominates in the f ailure pro cess). – Tweedie ( 1956 ), in mo d eling electrophoretic mea- surement s, used the distrib ution of fi rst passage time of a Bro wnian motion with drift to derive the inv erse Gaussian distribution. – Birnbaum and Saunders ( 1969 ), in mo deling time to fr acture from a fatigue crac k gro wth pro cess, deriv ed a distribution that is to d a y kno wn as the Birnbaum–Saunders d istribution. This distribu tion can b e though t of as a discrete- time analog of the inv erse Gaussian distribu- tion. – Meek er and LuV alle ( 1995 ), using a kinetic mo del for the gro wth of conducting fi lamen ts, d ev el- op ed a probabilit y distribution, dep end en t on the lev el of relativ e humidit y , to p r edict the fail- ure time of p rin ted circuit b oards. – Meek er, Escobar and Lu ( 1998 ), us in g a kin etic mo del for c hemical degradatio n inside an el ec- tronic amplifying device, devel op ed a pr obabil- it y d istribution wh ich, when com bined with the Arrhenius mo del, could be u sed to predict t he failure time of the d evices. – LuV alle et al. ( 1998 ) and LuV alle, Lefevre and Kannan ( 2004 , pages 200–206) u s ed physics- based mo dels to describ e degradation pro cesses. A CKNO WLEDGMENTS W e wan t to thank t w o anonymous referees who pro vided v aluable commen ts on an earlier v ersion of this pap er. These comments led to imp ortan t im- pro v ements in the pap er. Ch arles Annis and Mic hael LuV alle provided u s , resp ectiv ely , h elpful d escrip- tions of metho ds for fatigue testing and mo deling c hemical pro cesses related to A Ts. Figures 4 and 11 originall y app eared in Meek er and Escobar ( 1998 ) and Figures 12 and 13 originally app eared in Meek er, Escobar and Za y ac ( 2003 ) and app ear in this pap er with p ermission of the cop y- righ t o wner, John Wiley and S ons, I nc. REFERENCES Birnbaum, Z. W. and Saunders, S . C. (1969). A new family of life distributions. J. Appl. Pr ob ab. 6 319–3 27 MR025349 3 Black , J. R. (1969). Electromigration—a brief survey and some rece nt results. IEEE T r ansactions on Ele ctr on De- vic es 16 338–347. Blum, H. F. (1959). Car cino gene sis by Ultr aviolet Light . Princeton Univ. Press. Boccaletti, G., B orri, F. R., D’Esponosa, F. and Ghi o, E. (198 9). A ccelerated tests . In Micr o ele ctr onic R eliabil- ity 2 . Inte grity Assessment and Assur anc e (E. Poll ino, ed.) Chapter 11. Artech House, Norwoo d, MA . Box, G. E. P . and Cox, D. R. (1964). An analysis of trans- formations (with discussion). J. R oy. Statist. So c. Ser. B 26 211–252 . MR019261 1 Boyk o, K. C. and Gerlach, D. L. (1989). Time dep en - dent dielectric breakdown of 210 ˚ A oxides. In Pr o c. 27th An nual Inter national R eli ability Physics Symp osium 1–8. IEEE Press, New Y ork. Burch, D., Mar ti n, J. W. and V anLandin gham, M. R. (2002). Computer analysis of a p olymer coating exp osed to fi eld weather conditions. J. Co atings T e chnolo gy 74 75– 86. d’Heurle, F. M. and Ho, P. S. (1978). Electromig ration in thin films. In Thi n Films : Inter diffusion and R e actions (J. M. Poate, K . N. T u and J. W. May er, eds.) 243–303. Wiley , New Y ork. Do wling, N. E. (1993). Me chanic al Behavior of Materials . Pren tice H all, Englewood Cliffs, NJ. Escobar, L. A., Meeker, W. Q., Kugler, D. L. and Kramer, L. L. (2003). Accelerated destructive degrada- tion tests: Data, mo dels and analysis. In Mathematic al and Statistic al Metho ds in R eliability (B. H. Lindqv ist and K. A. Doksum, eds.) 319–337 . W orld Scie ntific, River Edge, NJ. MR203108 2 Ev ans, R. A. (19 77). Accelerated testing: The only game in to wn. I EEE T r ansactions on R eliabili ty 26 241. 26 L. A . ESCOBAR AND W. Q. MEEKER Ev ans, R. A. (1991). Accelerated testing. IEEE T r ans actions on R eliability 40 497. Eyring, H. (1980). Basic Chemic al Kinetics . Wiley , New Y ork. Fisher, R. and T ippett, L. H. (1928). Limiting forms of the frequency distribution of the largest and smallest member of a sample. Pr o c. Cambridge Philos. So c. 24 180– 190. Gha te, P. B. (1982). Electromigra tion-induced failures in VLSI interconnects. In Pr o c. 20th A nnual International R eliability Physics Symp osium 292–2 99. I EEE Press, New Y ork. Gillen, K. T. and Mead, K. E. (1980). Predicting life ex- p ectancy and sim ulating age of complex equipment using accelerated aging tec hniques. Ava ilable from the National T echnical I nformation Serv ice, U.S. D epartment of Com- merce, 5285 Po rt Ro yal R oad, Springfield, V A 2215 1. Glasstone, S., La idler, K. J. and Eyring, H. (1941). The- ory of R ate Pr o c es ses . McGra w-Hill, New Y ork. Hahn, G . J., Mee ker, W . Q. and Doganakso y, N. (2003). Accelerated testing for speedier reliabilit y analysis. Quali ty Pr o gr ess 36 (6) 58–63. Hooper, J. H. and A mster, S . J. (1990). Analysis and presenta tion of reliabilit y data. In Handb o ok of Statistic al Metho ds f or Engine ers and Scientists (H. M. W adsw orth, ed.). McGra w Hill, New Y ork. James, T. H. , ed. ( 1977). The The ory of the Photo gr aphic Pr o c ess , 4th ed . Macmill an, New Y ork. Jensen, F. (1995). El e ctr onic C om p onent Re liabil ity : F unda- mentals, Mo del l ing, Evaluation and Assur anc e . Wiley , New Y ork. Johnston, D. R., LaFor te, J. T., Podhorez, P. E. and Galpern, H. N. (1979). F requency acceleratio n of voltage endurance. IEEE T r ansactions on Ele ctric al Insulation 14 121–12 6. Jo yce, W . B., Liou, K.-Y., Nash, F . R., Bossard, P. R. and Har tman, R. L. (1985). Metho dology of accelerated aging. A T&T T e chnic al J. 64 717–764. Kalkanis, G. and Rosso, E. (1989). The inv erse p ow er law model for the lifetime of a mylar–polyurethane laminated dc hv insulating structure. Nucle ar Instruments and Meth- o ds i n Physics R ese ar ch A281 489–496. Klinger, D. J. (1991). On the notion of activ ation energy in reliabilit y: Arrhenius, Eyring and thermo dyn amics. In An- nual R eliabili ty and Maintainability Symp osium 295–300 . IEEE, New Y ork. Klinger, D. J. (1991). Humidity acceleration factor for plas- tic pack ag ed electronic devices. Quality and R eliabili ty En- gine ering International 7 365– 370. Klinger, D. J. (1992). F ailure time and rate constant of degradation: An argument for t h e inv erse relationship. Mi - cr o ele ctr onics R eliability 32 987–994. Klinger, D. J., Nakada, Y. and Me nendez, M. A. , eds. (1990). A T&T R eliability Manual . V an Nostrand R einhold, New Y ork. La wless, J. F. ( 1986). A note on lifetime regression models. Biometrika 73 509–512. MR085591 2 LuV alle, M. J., Copeland, L. R., Kannan , S., Judkins, J. and Lem aire, P. (1998). A strategy for extrapolation in accelerated testing. Bel l L abs T e chn ic al J. 3 (3) 139–147. LuV alle, M. J., Lefevre, B. and Kannan, S. (2004). De- sign and Analysis of A c c eler at e d T est s for Mission Critic al R eliability . Chapman and Hall/CR C, Bo ca R aton, FL. LuV alle, M. J., W elsher, T. L. and M itchell, J. P. (1986). A new approach to the extrap olation of accelerated life test data. I n Pr o c. Fifth International Confer enc e on R eliability and Maintainability 620–635. Biarritz, F rance. LuV alle, M. J., Welsher, T. L. and Svobod a, K. (1988). Acceleration transforms and statistical kinetic mo dels. J. Statist . Phys. 52 311–330. MR096858 8 Mann, N. R., Schafer, R. E. and Singpur w alla, N. D. (1974). Metho ds for Statistic al A nalysis of R eliability and Life Data . Wiley , New Y ork. MR0365976 Mar tin, J. W. (1982). Time transformatio n functions com- monly used in life testing analysis. Dur ability of Bui lding Materials 1 175–194. Mar tin, J. W., Saunders, S. C., Flo yd, F. L. and Wine- bur g, J. P. (1996). Metho dolo gies for Pr e dicting the Ser- vic e Lives of Co ating Systems . F ederation of So cieties for Coatings T echnolog y , Blue Bell, P A. Meeker, W. Q. and Escobar, L. A. ( 1998). Statistic al Metho ds f or R eliabili ty Data . Wiley , New Y ork. Meeker, W. Q. and Escob ar, L. A. (2004). Reliabilit y: The other d imension of q ualit y . Quality T e chnolo gy and Quantitative Management 1 1–25. MR219037 4 Meeker, W . Q., Escobar, L. A. and Lu, C. J. (1998). Ac- celerated degradation tests: Modeling and analysis. T e ch- nometrics 40 89–99. Meeker, W . Q., Escobar, L. A. and Za y a c, S. (2003). Use of sensitivity analysis to assess th e effect of mod el u n cer- tain ty in analyzing accelerated life test d ata. In Case Stud- ies in R eliabili ty and Maintenanc e (W. R. Blisc hke and D. N. Prabhak ar Murthy , eds.) 135–162. Wiley , New Y ork. MR195977 2 Meeker, W. Q. and Hahn , G. J. (1977 ). Asymptotically optim um ov er-stress tests to estimate the surviv al proba- bilit y at a condition with a low exp ected failure probability (with discussion). T e chnometrics 19 381–404. Meeker, W. Q. and Ha hn, G. J. (1985). How to Plan an A c c eler ate d Li fe T est : Some Pr actic al G uidelines . Ameri- can So ciety for Qu ality Control, Milw aukee, WI . Meeker, W. Q. and Hamada, M. (1995). S tatistical to ols for the rapid developmen t and ev aluation of high-reliability prod ucts. IEEE T r ansactions on R eliability 44 187–198. Meeker, W. Q. and LuV alle, M. J. (1995). An accelerated life test model based on reliabilit y kinetics. T e chnometrics 37 133–146 . Nelson, W . (1984). Fitting of fatigue curves with noncon- stan t standard dev iation to d ata with runouts. J. T esting and Evaluation 12 69–77. Nelson, W. (1990). A c c el er ate d T est ing : Statistic al Mo dels , T est Plans and Data Analyses . W iley , N ew Y ork. P a scual, F. G., Meeker, W. Q. and Escobar, L. A. (2006). Accelerated life test mo dels and data analysis. In Handb o ok of Engine ering Statistics (H . Pham, ed.) Chap- ter 22. Springer, New Y ork. Peck, D. S. (1986). Comprehensive mo del for humidit y test- ing correlatio n. In Pr o c. Inter national R eliability Physics Symp osium 44–50. IEEE Press, New Y ork. ACC ELERA TED TEST MODELS 27 Peck, D. S . and Zie rdt, C. H., Jr. (1974). The reliabilit y of semiconductor devices in t h e Bell S ystem. In Pr o c. IEEE 62 185–211 . Phadke, M . S . (1989). Q uali ty Engine ering Using R obust Design . Prenti ce H all, Englew o od Cliffs, NJ. Smith, J. S. (1996). Ph ysics of failure. In Handb o ok of Re li- ability Engine ering and Management , 2nd ed. (W. G. Ire- son, C. F. Coombs and R . Y. Moss, eds.) Chapter 14. Mc- Gra w Hill, New Y ork. Tobias, P. A. and Trindade, D. C. (1995). Applie d R e- liability , 2nd ed. V an Nostrand Reinhold, New Y ork. MR087607 5 Tweedie, M. C . K. (1956). Some statis tical prop erties of inv erse Gaussian d istributions. Vir ginia J. Sci. 7 160–165. MR008495 7 Weston, R. and S chw a rz, H. A. (1972). Chemi c al Ki netics . Pren tice H all, Englewood Cliffs, NJ.
Original Paper
Loading high-quality paper...
Comments & Academic Discussion
Loading comments...
Leave a Comment