Spectrum Sensing in Cognitive Radios Based on Multiple Cyclic Frequencies
Cognitive radios sense the radio spectrum in order to find unused frequency bands and use them in an agile manner. Transmission by the primary user must be detected reliably even in the low signal-to-noise ratio (SNR) regime and in the face of shadow…
Authors: Jarmo Lunden, Visa Koivunen, Anu Huttunen
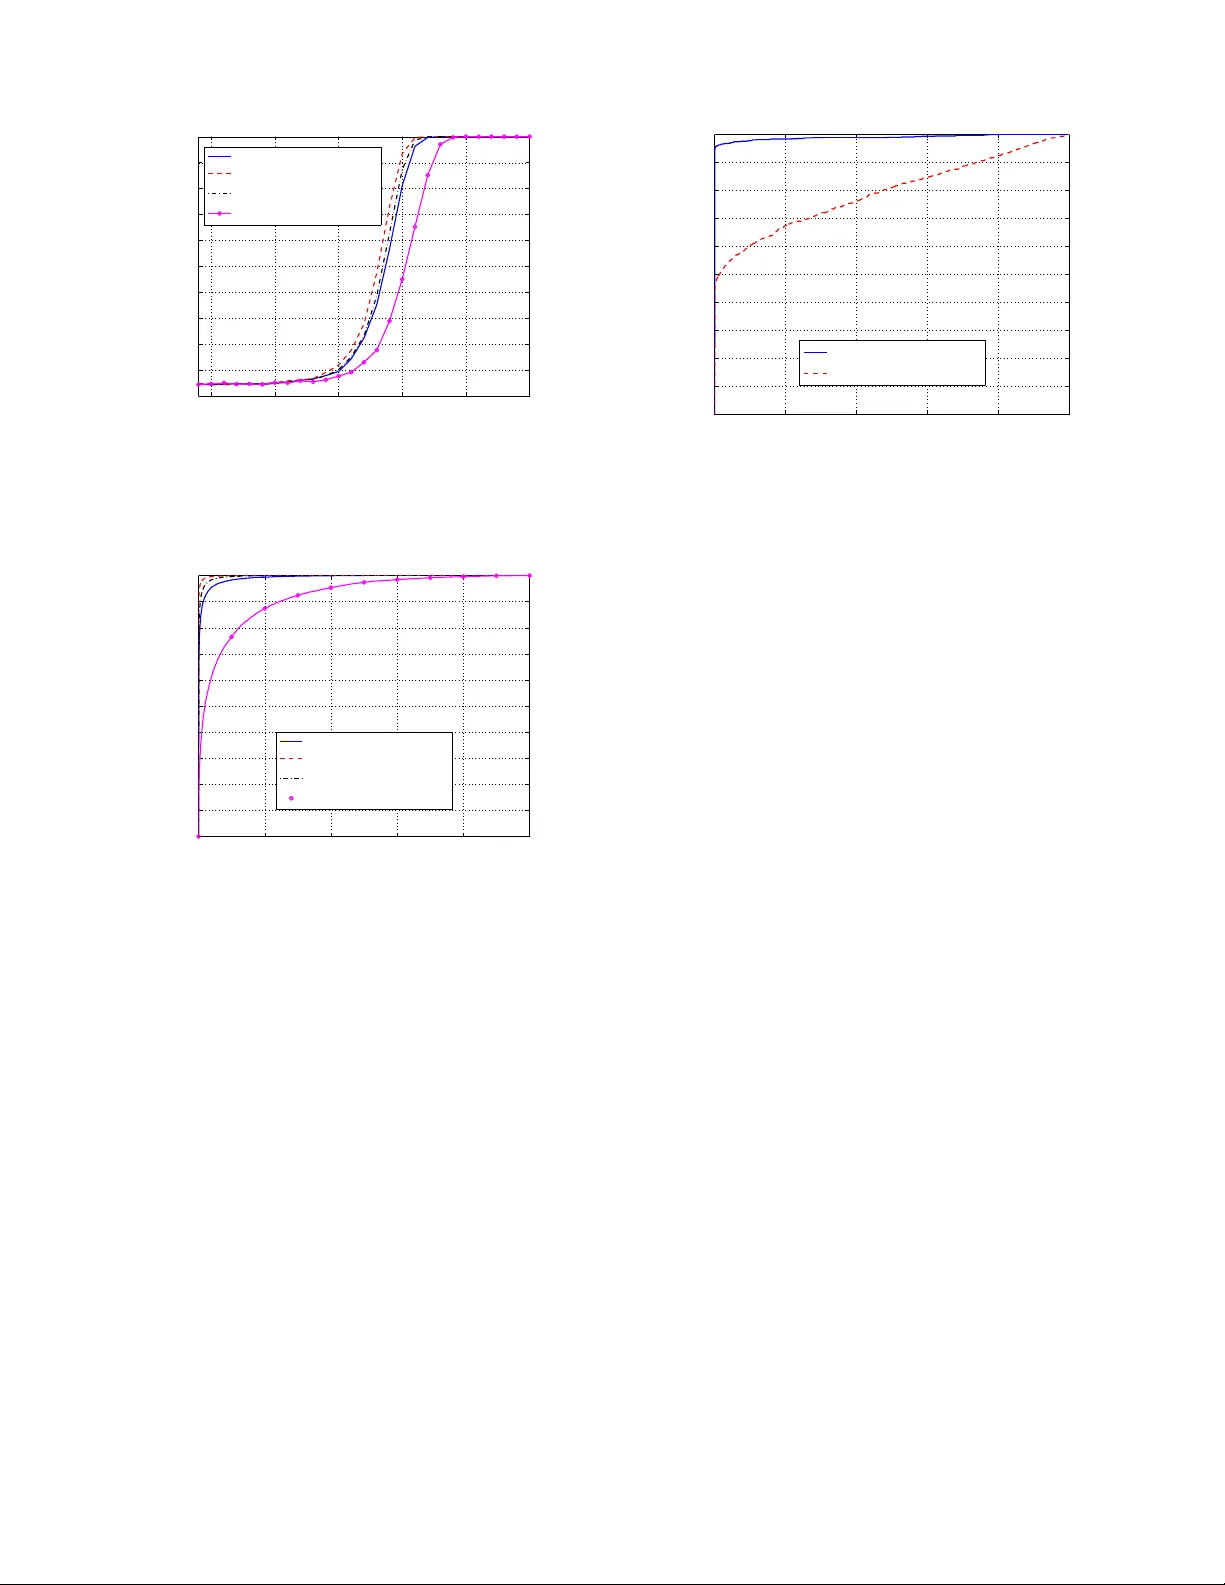
Spectrum Sensing in Cog niti v e Radios Based on Multiple Cyclic Frequencies In vited P aper Jarmo Lund ´ en ∗ , V isa Koi v unen ∗† , Anu Huttunen ∗ and H. V ince nt Poor † ∗ SMARAD CoE , Signal Processing L aborator y Helsinki Univ . of T ech nology , Finland Email: jrlund en@wooster .hu t.fi † School of E ngineer ing an d Applied Science, Princeton University Email: po or@prince ton.edu Abstract —Cognitiv e radios sense th e radio spectrum in order to fi nd unused frequency bands and use them in an agile manner . T ransmission by the primary user must be d etected reliably even in the low signal-to-noise ratio (SNR) r egime and in the face of shadowing and fadin g. Communication signals are typically cyclostationary , and ha ve many periodic statistical properties related to the sym bol rate, th e codin g and modulation schemes as well as the guard periods, for example. These properties can be exploited in designing a detector , and for distinguishing between the primary and secondary users’ signals. In th is paper , a generalized likelihood ratio test (GLRT) fo r detectin g the presence of cyclostationarity using multiple cyclic frequencies is proposed. Distributed d ecision making is employed by combining the quantized local test statistics from many secondary users. User cooperation allows for mitigating the effects of shadowing and p ro vides a larger footprint for the cognitiv e radi o system. Simulation examples demonstrate the resulting perf orma nce gains in the low SNR r egime and the benefits of cooperative detection. I . I N T RO D U CT I O N Spectrum sensing is needed in co gnitive radios in order to find opportun ities for agile use of spectrum. Moreover , it is crucial for mana ging the lev el of interferen ce caused to primary users (PUs) of the spectrum . Sen sing provides awareness of the radio op erating en vironm ent. A co gnitive radio may then adap t its parameters such as carrier freq uency , power and wav eform s dynamically in or der to p rovide the best av ailable connection and to meet the user’ s n eeds within the constraints on interference. In wireless communication system s we typically h av e some knowledge on the wa veforms and structu ral or statistical proper ties of the signals that the prim ary user of the spec trum is using. Such k nowledge may be related to the modulation scheme, the symbol or ch ip rate of the signal, the chann el Jarmo Lund ´ en’ s work was supporte d by GET A graduate school, Finni sh Defence Forces T echnica l Research Centr e and Nokia Foundat ion. The funding for V isa Koi vunen’ s sabbatical te rm at Princeto n Uni versity was provided by the Aca demy of F inland . Anu Hutt unen in on a research lea ve from Nokia Re search Cente r . H. V incen t Poor’ s work was supported by the US Nati onal Scien ce Founda tion under Grants ANI-03-38807 an d CNS-06-256 37 coding schem e, training or p ilot signals, guard period s, and the p ower le vel or correlation pro perties of the signal, just to mention a f ew . These properties may b e used to d esign a detector that works in a very low SNR regime an d has lo w complexity and conseq uently low po wer co nsumptio n. These are very d esirable pro perties especially for cognitive rad ios in mobile applications. In the absence of any kn owledge of the signal, one may hav e to r esort to classical techniqu es such as energy detection [1]. An en ergy detector may need to collect data over a long period of time to detect th e primary users reliably . Moreover, con trolling the false alarm rates in mobile applications is difficult becau se th e statistics of the signals, no ise and interference may b e tim e-varying. An other significant drawback is that energy d etection has no cap ability to distinguish am ong d ifferent types of tra nsmissions or to dichotom ize b etween p rimary a nd seco ndary users o f the spectrum. Cyclostationary processes are rando m processes for which the statistical p roperties such as the mean and au tocorrelatio n change pe riodically as f unctions of time [2]. Many of the signals used in wireless communicatio n and radar systems pos- sess this property . Cyclostationarity ma y be caused b y modu- lation or co ding [2], o r it m ay be also intentionally produc ed in ord er to aid ch annel estimation or synchro nization [3]. Cyclostationarity property has been widely used in intercept receivers [2], [ 4], [5], d irection of a rriv al or time-delay estima- tion, blind equalizatio n and channel estimation [6 ] as well as in precod er design in multicarrier communications [3]. In order to exploit c yclic statistics, the signal must be ov ersampled with respect to the sym bol rate, or mu ltiple receivers must be used to observe the signa l. The use of cyclostatio nary statistics is appealing in many ways: no ise is r arely cyclostationary and second-o rder cyclostation ary statistics retain also th e phase informa tion. Hence, procedu res based on c yclostationar ity tend to ha ve particular ly goo d perfo rmance at the low SNR regime. Moreover , cyclostationarity allows for distinguishing among different tran smission types and users if their signals have distinct cyclic frequencies. A comprehensive list of referen ces on cyclostationarity along with a survey of the literature is presented in [7]. The p resence o f cyclostation ary signals may be determined by using hypo thesis testing . Many existing tests, such as [8], are able to detect the pr esence of cyclostationarity at only o ne cyclic fr equency at a time, and they par tly ignor e the rich inf ormation pr esent in the signals. For examp le, a commun ication signal m ay have cyclic freq uencies related to the carrier fre quency , the symbol rate and its h armonics, the chip rate, guard per iod, the scrambling co de perio d, and th e channel cod ing sch eme. In this p aper we prop ose a method for detecting multiple cyclic freq uencies simu ltaneously . It extends the method of [8] to take into accoun t the rich informa tion present at different cyclic frequen cies. This pro- vides imp roved detector perfo rmance over techniques relyin g only on sing le cyclic frequency and facilitates dichoto mizing among the p rimary and secon dary user signals and d ifferent wa veforms used. In cognitive radio systems, there are typically multiple geo- graphica lly distributed secondary users (SUs) that need to d e- tect if the prim ary user is transmitting. Th e d istributed senso rs may work collaboratively to decide between two hypotheses: is the primary user active, or is the spectrum u nused and av ailable for the second ary users? Decentralized pro cessing has a num ber of advantages f or such situation s. Obviously , it allows for a larger coverage a rea. Furthermo re, ther e are gains similar to diversity gain s in wir eless comm unication s so that th e detection b ecomes less sensitive to deman ding propag ation con ditions suc h as shadowing by large obstacles, large nu mbers o f scatterers, differences in attenu ation, or fast fading caused by mobility . Moreover , distributed sensory systems may r equire less com munication bandwidth, con sume less power , be more reliab le and cost less as well. In this paper, we prop ose a simple d ecentralized dec ision mak ing approa ch based on sharin g a nd combin ing quan tized lo cal decision statistics. T his appro ach may be used in b oth decision making with or without a fu sion center . This paper is organized as follows. In Section II, there is a short r evie w of cyclo stationary statistics. A novel detecto r for multiple cyclic frequencies is derived in Section III. Section IV addr esses the prob lem of collaborative detection of prim ary user . Simulation results d emonstratin g the detector’ s reliability in the lo w SNR r egime as well as the gain s obtained via collaborative oper ation are presented in Section V . Finally , conclusion s ar e drawn in Section VI. I I . C Y C L O S T A T I O N A R I T Y : A R E C A P In this section, we provide a brief overview of cyclostation- arity in order to m ake the deri vation of the detector in Section III clearer . A continuou s-time rand om p rocess x ( t ) is wide sense second-or der cyclostationary if the re exists a T 0 > 0 such that [2]: µ x ( t ) = µ x ( t + T 0 ) ∀ t (1) and R x ( t 1 , t 2 ) = R x ( t 1 + T 0 , t 2 + T 0 ) ∀ t 1 , t 2 . (2) T 0 is called the period of the cyclo stationary process. Due to the period icity of the autocorrelatio n R x ( t 1 , t 2 ) , it has a Fourier-series rep resentation. By denoting t 1 = t + τ / 2 and t 2 = t − τ / 2 , we obtain the following expression for the Fourier-series [2]: R x ( t + τ 2 , t − τ 2 ) = X α R α x ( τ ) e j 2 π αt , (3) where the Fourier coefficients are R α x ( τ ) = 1 T 0 Z ∞ −∞ R x ( t + τ 2 , t − τ 2 ) e − j 2 π αt dt (4) and α is called the cyclic f requen cy . The fun ction R α x ( τ ) is called the cyclic au tocorrelatio n fun ction. If the pro cess h as zero mean , then th is is also the cyclic autocov ariance function. When the au tocorrelatio n fun ction h as exactly one per iod T 0 we have the following set o f cyclic frequen cies A = { α = k /T , k ≥ 1 } , where R α x ( τ ) is the cyclic a utocorr elation function an d A are the set o f cyclic fr equencies. The cyclic freque ncies are harmon ics of the f undam ental frequency . If the au tocorrela tion function has se veral periods T 0 , T 1 , . . . , we may express R α x ( τ ) at the limit [2] R α x ( τ ) = lim T →∞ 1 T Z T / 2 − T / 2 x ( t + τ 2 ) x ∗ ( t − τ 2 ) e j 2 π αt dt. (5) The process x ( t ) is almost cyclostationar y in the wide sense and the set of cyclic freq uencies A is comprised of a coun table number of frequ encies that do n ot n eed to be harmonics of the fundam ental freq uency . In gen eral, th e process is said to be cyclostationary if there exists an α 6 = 0 such that R α x ( τ ) 6 = 0 for some value of τ . T ypic ally cyclic f requenc ies ar e assumed to be k nown or may be estimated r eliably . I I I . D E T E C T I O N U S I N G M U LT I P L E C Y C L I C F R E Q U E N C I E S Statistical tests for the presence of a single cyclic frequency have b een propo sed, for example, in [8]. The tests in [8] have asymptotically con stant false alarm rate (CF A R) for testing presence o f cyclostationarity at a g iv en cyclic freq uency . Howe ver , the tests do not retain the CF AR pr operty over a set of tested frequencies. T y pical co mmunica tion signals exhibit cyclo stationarity at multiple cyclic fr equencies instead of just a sin gle cyclic frequen cy . That is, for e xample a sig nal that is c yclostationar y at the symbo l frequency is typically cyclostationary at all integer mu ltiples of the symbol frequency as well. There also may be cyclic frequen cies related to th e coding and guar d periods, or adap ti ve modulation and codin g may be used. In such cases the cyclic frequenc ies present may vary depend ing on channel qu ality an d the waveform used. If on e is testing for the presence o f ma ny different signals at a given frequen cy band, or in case th e cyclic f requen cies are not k nown, it would be d esirable to retain the CF AR property over the whole set of tested cyclic fr equencies. This would be e specially desirab le in a cogniti ve radio application where th e interest is in findin g unoccu pied fre quency ban ds. Otherwise the freq uency band may unnece ssarily be classified as occup ied for most of the time. In the following we extend the test based on second-or der cyclic statistics of [8] to multiple cyclic frequ encies. T o do so we first d efine all the terms used in th e test statistics. Let ( ∗ ) d enote an option al complex co njugation . The no- tation allows conv enient hand ling of both cyclic autoco rre- lation and conjugate cyclic autocorr elation with only one equation. An estimate of the (co njugate) cyclic a utocorr elation ˆ R xx ( ∗ ) ( α, τ ) m ay be obtain ed using M ob servations as ˆ R xx ( ∗ ) ( α, τ ) = 1 M M X t =1 x ( t ) x ( ∗ ) ( t + τ ) e − j 2 π αt (6) = R xx ( ∗ ) ( α, τ ) + ε ( α, τ ) , (7) where the latter term is the estimatio n err or . This estimator is consistent, (see [8]) so that the error goes to zero as M → ∞ . Now we need to construct a test fo r a num ber of lags τ 1 , . . . , τ N as well as a set of cyclic freq uencies of interest. Let A d enote the set of cyclic frequen cies of in terest, and ˆ r xx ( ∗ ) ( α ) = Re { ˆ R xx ( ∗ ) ( α, τ 1 ) } , . . . , Re { ˆ R xx ( ∗ ) ( α, τ N ) } , Im { ˆ R xx ( ∗ ) ( α, τ 1 ) } , . . . , Im { ˆ R xx ( ∗ ) ( α, τ N ) } (8) denote a 1 × 2 N vector contain ing the real and imaginary par ts of the estimated cyclic au tocorrelatio ns at the cyclic frequency of interest stacked in a single vector . The 2 N × 2 N cov ariance m atrix of r xx ( ∗ ) can be computed as [8] Σ xx ( ∗ ) ( α ) = Re n Q + Q ∗ 2 o Im n Q − Q ∗ 2 o Im n Q + Q ∗ 2 o Re n Q ∗ − Q 2 o (9) where the ( m, n ) th entries o f the two cov ariance matrices Q and Q ∗ are given b y Q ( m, n ) = S f τ m f τ n (2 α, α ) and Q ∗ ( m, n ) = S ∗ f τ m f τ n (0 , − α ) . (10) Here, S f τ m f τ n ( α, ω ) and S ∗ f τ m f τ n ( α, ω ) deno te the unconju- gated and conjugated cyclic spectra of f ( t, τ ) = x ( t ) x ( ∗ ) ( t + τ ) , respectively . These spectra can be estimated using fre- quency smoothed cyclic perio dogram s as ˆ S f τ m f τ n (2 α, α ) = 1 M L ( L − 1) / 2 X s = − ( L − 1) / 2 W ( s ) · F τ n ( α − 2 π s M ) F τ m ( α + 2 π s M ) (11) ˆ S ∗ f τ m f τ n (0 , − α ) = 1 M L ( L − 1) / 2 X s = − ( L − 1) / 2 W ( s ) · F ∗ τ n ( α + 2 π s M ) F τ m ( α + 2 π s M ) (12) where F τ ( ω ) = P M t =1 x ( t ) x ( ∗ ) ( t + τ ) e − j ω t and W is a normalized spectral windo w of odd len gth L . Now the h ypothesis testing problem for testing if α is a cyclic frequen cy can be fo rmulated as [ 8] H 0 : ∀{ τ n } N n =1 = ⇒ ˆ r xx ( ∗ ) ( α ) = ǫ xx ( ∗ ) ( α ) H 1 : for some { τ n } N n =1 = ⇒ ˆ r xx ( ∗ ) ( α ) = r xx ( ∗ ) ( α ) + ǫ xx ( ∗ ) ( α ) . (13) Here ǫ xx ( ∗ ) is the estimation error which is asymptotically nor- mal distrib uted, i.e., lim M →∞ √ M ǫ xx ( ∗ ) D = N ( 0 , Σ xx ( ∗ ) ) [8]. Hence, using the asymptotic normality of ˆ r xx ( ∗ ) the general- ized likelihood ratio (GL R) is given b y Λ = exp( − 1 2 M ˆ r xx ( ∗ ) ˆ Σ − 1 xx ( ∗ ) ˆ r T xx ( ∗ ) ) exp( − 1 2 M ( ˆ r xx ( ∗ ) − ˆ r xx ( ∗ ) ) ˆ Σ − 1 xx ( ∗ ) ( ˆ r xx ( ∗ ) − ˆ r xx ( ∗ ) ) T ) = exp( − 1 2 M ˆ r xx ( ∗ ) ˆ Σ − 1 xx ( ∗ ) ˆ r T xx ( ∗ ) ) . (14) Finally , by taking the logarithm an d multiplying th e result by 2, we arri ve at the test statistic in [8] T xx ( ∗ ) ( α ) = − 2 ln Λ = M ˆ r xx ( ∗ ) ˆ Σ − 1 xx ( ∗ ) ˆ r T xx ( ∗ ) . (15) Under the n ull hypothesis T xx ( ∗ ) ( α ) is asymptotically χ 2 2 N distributed. Now in ord er to extend the test for the p resence of second- order cyclostationa rity at any of the cyclic frequ encies of interest α ∈ A simultaneou sly , we fo rmulate the hypothe sis testing as fo llows H 0 : ∀ α ∈ A and ∀{ τ n } N n =1 = ⇒ ˆ r xx ( ∗ ) ( α ) = ǫ xx ( ∗ ) ( α ) H 1 : for some α ∈ A and for some { τ n } N n =1 = ⇒ ˆ r xx ( ∗ ) ( α ) = r xx ( ∗ ) ( α ) + ǫ xx ( ∗ ) ( α ) . (16) For this detection pro blem, we p ropose the following two test statistics: D m = max α ∈A T xx ( ∗ ) ( α ) = max α ∈A M ˆ r xx ( ∗ ) ( α ) ˆ Σ − 1 xx ( ∗ ) ( α ) ˆ r T xx ( ∗ ) ( α ) (17) D s = X α ∈A T xx ( ∗ ) ( α ) = X α ∈A M ˆ r xx ( ∗ ) ( α ) ˆ Σ − 1 xx ( ∗ ) ( α ) ˆ r T xx ( ∗ ) ( α ) . (18) The first test statistic calculates the maxim um o f the cy- clostationary GLR T statistic ( 15) over the cyclic frequencies of in terest A while the second calculates the sum. Assuming indepen dence of cyclic autoco rrelation estimates fo r different cyclic frequen cies the test statistic D s is th e GLR T statistic. Dependin g on the signal and the set of tested cyclic f requen- cies the test statistics m ay have d ifferent p erform ances. Th is requires furth er research. The asympto tic distrib ution of D s is unde r the null hypo th- esis χ 2 2 N N α where N α is the number of cyclic frequen cies in set A . This is du e to the fact that the sum o f independe nt chi- square ran dom v ariables is also a chi-sq uare random variable whose degrees of freedom is the sum of the de grees of freedom of the independent ra ndom variables. In the follo wing we d erive the a symptotic distribution of th e test statistic D m under the n ull h ypothesis. As stated above, under the null hypoth esis T xx ( ∗ ) ( α ) is asymp totically χ 2 2 N distributed. The cu mulative distribution fun ction of the chi- square distribution with 2 N d egrees o f fre edom is given by F ( x, 2 N ) = γ ( N , x/ 2) Γ( N ) (19) where γ ( k, x ) is the lower incomplete g amma fu nction and Γ( k ) is the ordinary gamma fu nction. For a po siti ve integer k the fo llowing identities h old: Γ( k ) = ( k − 1)! (20) γ ( k, x ) = Γ( k ) − ( k − 1)! e − x k − 1 X n =0 x n n ! . (21) Hence, the cumulative d istribution function of the chi-square distribution w ith 2 N degrees of freedom is given by F ( x, 2 N ) = 1 − e − x/ 2 N − 1 X n =0 ( x/ 2) n n ! . (22) The cu mulative distribution functio n of the maximum of d indepen dent and identically distributed ran dom variables is the cumulative distrib ution function o f the in dividual random vari- ables raised to the power d . Thu s, the cu mulative distribution function of th e test statistic D m is given by F D m ( x, 2 N , d ) = 1 − e − x/ 2 N − 1 X n =0 ( x/ 2) n n ! ! d . (23) The correspond ing p robability d ensity f unction is obtain ed by differentiating the cum ulative distrib ution fu nction, i.e., f D m ( x, 2 N , d ) = d 2 1 − e − x/ 2 N − 1 X n =0 ( x/ 2) n n ! ! d − 1 · e − x/ 2 N − 1 X n =0 ( x/ 2) n n ! − N − 1 X n =1 ( x/ 2) n − 1 ( n − 1)! ! . (24) Consequently , the null hypothesis is r ejected if F D m ( D m , 2 N , N α ) > 1 − p where p is the false alarm rate an d N α is the num ber of tested cyclic fr equencie s. I V . C O O P E R A T I V E D E T E C T I O N User cooper ation may b e used to improve the p erform ance and cov erage in a cognitive radio n etwork. The users may collaborate in finding un used spec trum and n ew oppo rtunities. Many of the collabo rativ e detection techniqu es stem fro m distributed d etection theory; see [1 0], [11]. In cogn itiv e radio systems, there are typically mu ltiple geograp hically distrib uted secondary users that need to detect wheth er the primary user is ac ti ve. All the secondary users may sense the entire b and of interest, o r monitor just a partial b and to red uce po wer consump tion. I n the latter case each SU senses a cer tain part of the spectrum, and then sh ares the acq uired info rmation with other users o r a fusio n center . The coo peration may th en be coordinated by a fusion center (FC), o r it may take place in an ad-h oc manner without a dedicated f usion ce nter . Here we assume that a fusion ce nter collects information from all K secondar y user s an d makes a decision ab out whethe r the spectrum is av ailable or not. W e assume that eac h second ary u ser sends a quantized version of its local decision statistics (such as th e likelihood ratio ) to the FC. In the case o f very coarse quantizatio n, b inary local decision may be sent. T o der iv e a test for the FC, we assume that the sensors are independen t conditioned on whether the hypoth esis H 0 or H 1 is tr ue. Then th e optimal fusion rule is the likelihood ratio test over the received local likelihood ratios l i : T K = K Y i =1 l i . (25) In case the secondary users sen d binary d ecisions, the sum of ones may calculated and comp ared to a thr eshold. Her e, we consider the simplest way o f making the decision using generalized likelihood ratios. Instead of using the product of the gener alized likelihood ratios, we can employ th e sum of generalized log-likelihood ratios. W e propo se the follo wing test statistic f or the hy pothesis testing pro blem (13) T ′ K = K X i =1 T ( i ) xx ( ∗ ) ( α ) , (26) and the following tw o fo r the h ypothe sis te sting pr oblem (16) D m,K = max α ∈A K X i =1 T ( i ) xx ( ∗ ) ( α ) (27) D s,K = X α ∈A K X i =1 T ( i ) xx ( ∗ ) ( α ) (28) where T ( i ) xx ( ∗ ) ( α ) is the cyclostationarity based test statist ic (15) from i th secondary user . Due to the use of gen eralized likelihood ratio s, n o optimality prop erties can be claimed. The GLR T test does, howev er , p erform hig hly reliably in many applications. Under the co nditional independen ce assumption the asymp- totic distributions of th e test statistic T ′ K and D s,K are un der the null h ypothesis χ 2 2 N K and χ 2 2 N N α K , respectively . T his is again due to the fact that th e sum of independen t chi- square ran dom v ariables is also a chi-sq uare random variable whose d egrees of fr eedom is the sum of the degrees o f freedom of the independent r andom variables. Th e cumulati ve distribution fu nction of D m,K is under the null hypothesis F D m ( D m,K , 2 N K, N α ) where N α is again the number o f tested cyclic frequencie s. Th e testing is done similarly as in one second ary user case. Different techn iques for r educing the amount of tran smitted data, taking into acco unt the relev ance o f the info rmation provided b y secondary users as well as h ow to deal with com - munication rate con straints will be a ddressed in a forthcoming paper . V . S I M U L AT I O N E X A M P L E S In this section the perf ormance of the pr oposed detectors is considered . The test signal is an orthogonal frequ ency di vision multiplex (OFDM) sig nal. The b aseband eq uiv alent of a cyclic prefix OFDM signal may be expressed as x ( t ) = N c − 1 X n =0 ∞ X l = −∞ c n,l g ( t − l T s ) e j (2 π / N ) n ( t − lT s ) (29) where N c is the number of subcarriers, T s is the symbol length, g ( t ) denotes th e rectan gular pu lse of length T s , and the c n,l ’ s denote the d ata symbo ls. The symb ol length is the sum of the length of the usefu l sym bol data T d and the length of the cyclic prefix T cp , i.e., T s = T d + T cp . The above OFDM signal exhibits cyclostation arity (i.e., complex conjugation is used in (6) and the f ollowing eq ua- tions) with c yclic freq uencies of α = k /T s , k = 0 , ± 1 , ± 2 , . . . and potentially o ther f requenc ies depend ing on the coding scheme. The cyclic au tocorrelatio n surfaces for α = k /T s peak at τ = ± T d [9]. In th e f ollowing the performance of cyclic detectors b ased on one and two cyclic frequen cies is compa red as a function of signal-to-n oise ratio (SNR) in an additive white Gaussian noise (A WGN) ch annel. The SNR is defined as SNR = 10 log 10 σ 2 x σ 2 n where σ 2 x and σ 2 n are the variances of the signal and the no ise, respectively . The cyclic f requenc ies employed by th e de tectors are 1 /T s and 2 /T s . The detector based on one c yclic frequency uses th e first f requen cy and the detectors based o n two cyclic frequen cies u se both frequencies. Each detector uses two time lags ± T d . The cyclic spectru m estimates were calcula ted using a length-2 049 Kaiser window with β par ameter o f 10. A Fast- Fourier transfo rm (FFT) was e mployed for faster computation. The FFT size was 1000 0 giving a cyclic f requen cy resolution of 0.00 01. The OFDM signal ha s 32 subcarriers and the length of th e cyclic prefix is 1 /4 of the u seful sym bol d ata. The subcarrier modulatio n employed is 16-QAM. The signal len gth is 100 OFDM symb ols. Fig. 1 depicts the performance of th e detectors as a function of the SNR for a constant f alse alarm rate of 0.05. Fig. 2 sho ws a zoom of the important area illustrating the dif ferences in perfor mance more clearly . All the curves are averages over 10000 experiments. It can be seen tha t the detectors based on multiple cyclic f requen cies outp erform th e detector based on single cyclic freque ncy in the low SNR regime . Furthe rmore, the multicycle detecto r calculating th e sum over the cyclic statistics of d ifferent fr equencies has th e best per forman ce. Fig. 3 plots the pro bability of detection vs. false alarm rate f or SNR o f - 7 dB. The figur e show that the d etectors have desirable receiver operating cha racteristics. That is, th e probab ility of detection increases as the false alarm r ate parameter is inc reased. Next th e perfo rmance gain fro m co operative detection of se veral second ary users is analyze d. The signal is th e same as above. The co operative detection is b ased on the data of 5 −25 −20 −15 −10 −5 0 0 0.1 0.2 0.3 0.4 0.5 0.6 0.7 0.8 0.9 1 SNR (dB) Probability of detection p fa = 0.05 1 cyclic frequency 2 cyclic frequencies, D s 2 cyclic frequencies, D m Figure 1. Probabi lity of de tectio n vs. SNR. The multi cycl e detectors achie ve bette r performance than the single cycle detecto r i n the low SNR regi me. The sum de tector of the test statistic D s has the best performance. −10 −8 −6 −4 −2 0 0.4 0.5 0.6 0.7 0.8 0.9 1 SNR (dB) Probability of detection p fa = 0.05 1 cyclic frequency 2 cyclic frequencies, D s 2 cyclic frequencies, D m Figure 2. Probability of detecti on vs. SNR. Zoom of the important region. T he multic ycle detec tors achie ve better performance than the single cy cle detec tor in the low SNR regime. The sum dete ctor of the test statistic D s has the best performanc e. 0 0.2 0.4 0.6 0.8 1 0 0.1 0.2 0.3 0.4 0.5 0.6 0.7 0.8 0.9 1 False alarm rate Probability of detection SNR = −7 (dB) 1 cyclic frequency 2 cyclic frequencies, D s 2 cyclic frequencies, D m Figure 3. Probabilit y of detec tion vs. fa lse al arm rate. T he dete ctors based on multiple cycli c frequencies achie ve bett er performance than the detector based on a sing le c yclic fre quenc y . −25 −20 −15 −10 −5 0 0 0.1 0.2 0.3 0.4 0.5 0.6 0.7 0.8 0.9 1 SNR (dB) Probability of detection p fa = 0.05 5 SUs, 1 cyclic freq. 5 SUs, 2 cyclic freqs., D s,K 5 SUs, 2 cyclic freqs., D m,K 1 SU, 2 cyclic freqs., D s Figure 4. Probabi lity of de tecti on vs. SNR. Coope ration of 5 secondary users provi des performance gain of 3 dB. Using multiple cycli c freq uencies further improv es the det ection performance. The sum de tector of the test statistic D s,K has the best performance. 0 0.2 0.4 0.6 0.8 1 0 0.1 0.2 0.3 0.4 0.5 0.6 0.7 0.8 0.9 1 False alarm rate Probability of detection SNR = −9 (dB) 5 SUs, 1 cyclic freq. 5 SUs, 2 cyclic freqs., D s,K 5 SUs, 2 cyclic freqs., D m,K 1 SU, 2 cyclic freqs., D s Figure 5. Probabil ity of de tecti on vs. fal se ala rm rate. Cooperation among secondary users combined with the use of multicyc le sum test statist ic D s,K provi des the best performance . secondary users. Each secondar y user recei ves the same d ata with dif ferent n oise. SNR is the same for each secon dary user . Fig. 4 depicts th e p erform ance for 5 seco ndary u sers compare d to the single secondar y u ser case. Per forman ce gain of ro ughly 3 d B is obtaine d fr om the coop eration of 5 secondary users. Using two cyclic frequencies provides similar perfor mance improvement as in single secondary user case. Fig. 5 sho ws the pro bability of dete ction v s. false alarm rate for SNR of -9 dB. In the fo llowing simplistic exam ple, we illustrate the gains that may be achie ved v ia collaborative detection in the face of shadowing ef fects. In order to simu late shadowing, the SNR of each u ser was independen tly selected rand omly fr om a normal distribution with a mean o f -9 dB an d standar d deviation of 10 dB. That is, th e log arithm of the receiv ed power level is normally distrib uted. Fig . 6 depicts the perform ance of the multicycle detectors for the simple shad owing scen ario. Com- parison to Fig. 5 re veals that coop eration amon g seco ndary users red uces sensiti vity to sh adowing effects significantly . 0 0.2 0.4 0.6 0.8 1 0 0.1 0.2 0.3 0.4 0.5 0.6 0.7 0.8 0.9 1 False alarm rate Probability of detection SNR = −9 (dB) 5 SUs, 2 cyclic freqs., D s,K 1 SU, 2 cyclic freqs., D s Figure 6. Probabil ity of detection vs. false alarm rate. In order to simulate shado wing the SNR of each user was ind ependent ly selected randomly from a normal distribut ion with a mean of -9 dB and standard devia tion of 10 dB. Cooperat ion among second ary user s reduces sensi ti vity to shadowing effe cts. V I . C O N C L U S I O N In this pap er , a generalized likelihood ratio test f or detectin g primary tra nsmissions with m ultiple cyclic frequen cies has been proposed , and the asym ptotic distribution of the test statistic has been derived. In this test, im pairments such as shadowing and fading are mitigated by combin ing the quan- tized local likelihood ratio s from a n umber of secondary u sers under a condition al indepen dence assump tion. Simu lation ex- amples d emonstrating the improved reliability in the detector perfor mance in the lo w SNR regime as well as sign ificant gains obtained v ia collaborative decision making h av e also been pre sented. R E F E R E N C E S [1] H. V . Poor , An Intr oducti on to Sig nal Det ection and Estimation , 2nd editi on, Springer , New Y ork, 1994. [2] W . A. Gardner , Statistical Spectral A nalysis: A Nonpr obabili stic Theory , Prentic e-Hall, Upper Saddl e Ri ve r , NJ, 1987 . [3] M. Tsatsanis and G.B. Giannakis, “T ransmitte r Induced Cycl ostation- arity for Blind Channel Equaliz ation, ” IEEE T rans. Signal Pr ocessing , V ol. 45, pp. 1785-1794, Jul. 1997. [4] T . Koi visto and V . Koi vunen, “Blind Despreading of Short-Code CDMA Signals in Asynchro nous Multi -User Systems, ” Signal Pr ocessi ng , to appear in 2007. [5] J. Lund ´ en and V . Koi vunen, “ Automatic Rada r W a veform Recognitio n, ” IEEE Journa l of Selec ted T opics in Signal Pr ocessin g , Spe cial issue on Adapti ve W a veform Design for Agile Sensing and Communicatio n, to appear in 2007. [6] L. T ong, G. Xu, a nd T . Kai lath, “Blin d Ident ificatio n and Equaliza tion Based on Sec ond-Order Sta tistics: A T ime Domain Approa ch, ” IEEE T rans. Informat ion Theory , v ol. 40, no. 2, pp. 340-349, Mar . 1994. [7] W . A. Gardner , A. Napolitano , and L. Paura , “Cyclostati onarity: Half a Centu ry of Resear ch, ” Signal Pr ocessing , V ol. 86, pp. 639-697, Apr . 2006. [8] A. V . Dandawa t ´ e and G. B. Giannaki s, “Statistica l T ests for Presence of Cyclostation arity , ” IEEE T rans. Signal Pr ocessing , vol. 42, no. 9, pp. 2355–2369, Sep . 1994. [9] M. ¨ Oner and F . Jondral, “ Air Interfac e Recognit ion for a Software Radio System Expl oiting Cy clostati onarity , ” in Pr oc. 15th IEEE International Symposium on P ersonal, Indoor and Mobil e R adio Communicat ions (PIMRC’04) , Barcelona, Spain, Sep. 5-8, 2004, vol. 3, pp. 1947-1951. [10] R. Vi swanat han, and P . K. V arshne y , “Distribu ted D etec tion with Multi- ple Sensors: P art I – Fundament als, ” Proc eedings of the IEEE , V ol. 85, No. 1, pp. 54-63, Jan. 1997. [11] R. S. Blum, S. A. Kassam, and H. V . Poor , “Distribute d Dete ction wi th Multipl e Sensors: Par t II – Adv ance d T opics, ” Proce edings of the IEEE , V ol. 85, No. 1, pp. 64-79, Jan. 1997.
Original Paper
Loading high-quality paper...
Comments & Academic Discussion
Loading comments...
Leave a Comment